báo cáo hóa học:" Leucine-rich alpha-2-glycoprotein-1 is upregulated in sera and tumors of ovarian cancer patients" pot
Bạn đang xem bản rút gọn của tài liệu. Xem và tải ngay bản đầy đủ của tài liệu tại đây (1.34 MB, 14 trang )
RESEARC H Open Access
Leucine-rich alpha-2-glycoprotein-1 is
upregulated in sera and tumors of ovarian
cancer patients
John D Andersen
1
, Kristin LM Boylan
1
, Ronald Jemmerson
2
, Melissa A Geller
3
, Benjamin Misemer
1
,
Katherine M Harrington
1
, Starchild Weivoda
2
, Bruce A Witthuhn
4
, Peter Argenta
3
, Rachel Isaksson Vogel
5
,
Amy PN Skubitz
1*
Abstract
Background: New biomarkers that replace or are used in conjunction with the current ovarian cancer diagnostic
antigen, CA125, are needed for detection of ovarian cancer in the presurgical setting, as well as for detection of
disease recurrence. We previously demonstrated the upregulation of leucine-rich alpha-2-glycoprotein-1 (LRG1) in
the sera of ovarian cancer patients compared to healthy women using quantitative mass spectrometry.
Methods: LRG1 was quantified by ELISA in serum from two relatively large cohorts of women with ovarian cancer
and benign gynecological disease. The expression of LRG1 in ovarian cancer tissues and cell lines was examined by
gene microarray, reverse-transcriptase polymerase chain reaction (RT-PCR), Western blot, immunocytochemistry and
mass spectrometry.
Results: Mean serum LRG1 was higher in 58 ovarian cancer patients than in 56 healthy women (89.33 ± 77.90 vs.
42.99 ± 9.88 ug/ml; p = 0.0008) and was highest among stage III/IV patients. In a separate set of 193 pre-surgical
samples, LRG1 was higher in patients with serous or clear cell ovarian cancer (145.82 ± 65.99 ug/ml) compared to
patients with benign gynecological diseases (82.53 ± 76.67 ug/ml, p < 0.0001). CA125 and LRG1 levels were
moderately correlated (r = 0.47, p < 0.0001). LRG1 mRNA levels were higher in ovarian cancer tissues and cell lines
compared to their normal counterparts when analyzed by gene microarray and RT-PCR. LRG1 protein was detected
in ovarian cancer tissue samples and cell lines by immunocytochemistry and Western blotting. Multiple iosforms of
LRG1 were observed by Western blot and were shown to represent different glycosylation states by digestion with
glycosidase. LRG1 protein was also detected in the conditioned media of ovarian cancer cell culture by ELISA,
Western blotting, and mass spectrometry.
Conclusions: Serum LRG1 was significantly elevated in women with ovarian cancer compared to healthy women
and women with benign gynecological disease, and was only moderately correlated with CA125. Ovarian cancer
cells secrete LRG1 and may contribute directly to the elevated levels of LRG1 observed in the serum of ovarian
cancer patients. Future studies will determine whether LRG1 may serve as a biomarker for presurgical diagnosis,
disease recurrence, and/or as a target for therapy.
Background
Ovarian cancer is the most lethal gynecologic malig-
nancy [1]; about 22,000 women are diagnosed annually
in the U.S. and ~16,000 patients succumb to the disease
[2]. New biomarkers that either replace or are used in
conjunction with the current ovarian cancer serum bio-
marker, CA125, are needed to improve diagnosis and
treatment [1-4]. Biomarkers that distinguish between
malignant and benign abdominal masses prior to sur-
gery could identify those patients who should be
referred to a gynecologic oncologist [5]. Initial cytore-
ductive surgery by a gynecologic oncology surgeon has
* Correspondence:
1
Department of Laboratory Medicine and Pathology, University of Minnesota,
MMC 609, 420 Delaware St. SE Minneapolis, MN, USA
Full list of author information is available at the end of the article
Andersen et al. Journal of Ovarian Research 2010, 3:21
/>© 201 0 Andersen et al; licensee BioMed Central Ltd. This is an Open Access article dist ributed under the terms of the Creative
Commons Attribution License ( g/licenses/by/2.0) , which perm its unrestricted use, distribut ion, and
reprodu ction in any medium, pr ovided the original work is properly cited.
been shown to result in improved outcomes for
advanced ovarian cancer patients [6]. In addition, a bio-
marker that could be used to monitor the efficacy of
therapy would be ideal to detect disease recurrence.
To date, serum biomarker discovery has been impeded
by an abundance of twelve proteins that comprise ~95%
of the serum proteome, and can mask lower abundance
proteins [7]. We have previously reported the use of
immunoaffinity depletion columns coupled with com-
plementary mass spectrometry-based proteomic technol-
ogies to identify several differentially expre ssed proteins
in the pooled sera of serous ovarian cancer patients
compared to healthy women [8,9]. One such differen-
tially expressed protein, l eucine-rich a-2-glycoprotein-1
(LRG1), is ~3-fold more abundant in ovarian cancer
serum compared to non-cancer control serum, and
represents a potential serum biomarker for ovarian
cancer.
Human LRG1 is a serum glycoprotein of 312 amino
acids in length with a predicted unmodified molecular
weigh t of 34 to 36 kD [10]. LRG1 has five potential gly-
cosylation sites; 2 D SDS-PAGE results show LRG1
molecular weight ranges from 44 to 55 kD with isoelec-
tric points ranging from 4.52 to 4.72 [11], suggesting
that modifications occur. LRG1 has a normal plasma
concentration of 21-50 μg/ml [12,13].
The function of LRG1 remains unknown, although
reports have predicted its role in cell adhesion [14,15]
due to its leucine-rich repeats, granulocytic differentia-
tion due to its expr ession in neutrophil lineage experi-
ments [16], and cell migration due to its overexpression
in high-endothelial venules and tendency to bind extra-
cellular matrix proteins [17]. LRG1 has been implicated
as a protein involved upstream of the TGF-bRIIpath-
way [18,19], suggesting a role in signalling. Serum LRG1
binding to cytochrome c has been recently demonstrated
[20] and is proposed to play a role in cell survival and
apoptosis [13,21].
In this study, we have validated our proteomic discov-
ery experiments using sera, tissue, and cell lines from
ovarian cancer patients and non-cancer controls.
Methods
Serum samples
Serum from patients with serous ovarian carcinoma (n =
58) and healthy female controls (n = 5 6) were obta ined
from the Gynecologic Oncology Group (GOG) Tissue
Bank. The majority of ovarian cancer patients had stage III
or IV serous tumors (n = 51), the others had stage I and II
tumors (n = 7). The median age of the ovarian cancer
patients was 52 years (range: 35-85 years) compared to 46
years (range: 19-58 years) for the non-cancer controls.
Additional sera were obtained from the University of
Minnesota Tissue Procurement Facility (Minneapolis,
MN). These samples were obtained immediately prior to
surgery from women with suspected ovarian ca ncer. All
patients were consented in accordance with the Univer-
sity of Minnesota Institutional Review Board (IRB)
guidelines. Definitive diagnoses were determined by
pathologists. A total of 193 samples were selected from
patients with the following pathology: 10 benign muci-
nous ovarian cystadenomas, 10 fibromas, 19 cases of
endometriosis, 16 cystadenomas, 30 other be nign ovar-
ian masses, 21 ovarian tumors of low malignant poten-
tial, 8 clear cell (5stage I or II; 3 stage III), and 79
serous ovarian cancers (11 stage I or II; 63 stage III or
IV; 5 not staged). Collection, processing, and storage of
all blood samples was strictly standardized as follows.
Blood samples were collected in a vacutainer tube,
allowedtoclotatroomtemperature(RT)for30min,
and centrifuged at ~2500 × g for 10 min at RT. The
serum was removed and immediately divided into
100 μl and 1 ml aliquots, and stored at-80°C.
Tissue and ascites samples
Tissue and ascites samples were obtaine d from the Uni-
versity of Minnesota Tissue Procurement Facility, as pre-
viously described [22,23]. All tissues were snap frozen in
liquid nitrogen within 30 min of resection and stored in
the vapor phase of liquid nitrogen. Tissue sections were
made from each sample, stained with hematoxylin and
eosin (H&E), and examined by a pathologist by light
microscopy to confirm the pathological state of each
sample; a second pathologist confirmed the diagnosis of
each sample, documented the percent tumor (typically
100%), and documented any necrosis (typically none).
The following tissues were analyzed in this study:
21 cases of serous ovarian cancer, 22 c ases of serous
ovarian cancer metastatic to the omentum, 24 cases of
serous ovarian cancer widely metastatic to other regions
(including peritoneal surfaces, bowel serosa, lymph
nodes, liver, uterus, and the mesentery of the small
bowel), 17 benign ovary tumors, 8 cases of ovarian
tumors of low malignant potential, and 57 normal ovaries
were analyzed for global gene expression. An additional 7
ovarian cancer and 13 normal ovary samples were used
for RT-PCR and/or Wester n blot experiments. Ascites
was obtained from 29 women undergoing surgery for the
removal of serous ovari an cancer, as soon as it was
released by pathology (typically within 1 hr of removal
from the patient). Ascites was centrifuged at 600 × g for
10 min at RT, and the supernatant was immediately
divided into small aliquots and frozen at -80°C.
Cell Lines
Ovarian cancer cell lines SKOV3, ES-2, NIH:OVCAR3,
HEY, C13, OV2008, OVCA429, OVCA433, A 2780-S,
and A2780-CP, provided by Dr. Barbara Vanderhyden
Andersen et al. Journal of Ovarian Research 2010, 3:21
/>Page 2 of 14
(University of Ottawa, Canada); NIH:OVCAR5, provided
by Dr. Judah Folkman (Harvard Medical School, Boston,
MA); MA148 provided by Dr. Sundaram Ramakrishnan
(University of Minnesota, Minneapolis, MN); CAOV3
provided by Dr. Robert Bast Jr. (University of Texas,
Houston, TX) were maintained as previously described
[24-26]. Immortalized normal ovarian surface epithelial
(NOSE ) cell lines 1816-575, 1816-686, HIO11 7, IMCC3,
IMCC5, HIO3173-11, and HIO135, provided by Dr.
Patricia Kruk (University of South Florida, Tampa, FL),
were cultured as previously described [27,28]. All cells
were maintained in a humidified chamber at 37°C with
5% CO
2
and were routinely subcultured with trypsin/
EDTA.
Antibodies
Mouse IgG monoclonal antibody (mAb) 2F5.A2 against
human sera LRG1 was used in the ELISAs [13]. Mouse
IgG mAb 2E3 against recombinant human LRG1
(Abnova Corporation, Taipei, Taiwan) was used for
Western blots and immunocytochemistry. Normal
mouse IgG (Equitec h-Bio, Inc. Kerville, TX) was used as
a negative control for all experiments. Mouse mAb AC-
74 against b-actin (Sigma Aldrich, St. L ouis, MO) was
used on Western blots as a loading control.
ELISA
The ELISA for LRG1, which employs cytochrome c as
the capture ligand, was conducted as described pre-
viously [13]. All samples were tested at least two times
in triplicate. Concentrations of LRG1 were calculated
from a purified standard [13]. The ELISA samples were
compared as follows: for the GOG samples, mean LRG1
concentrations were compared across patients with
ova rian cancer and control samples us ing general linear
model for repeated measures, a djusted for age. For pre-
surgical samples, mean LRG1 concent rations were com-
pared across patients of the eight diagnoses using a gen-
eral linear model for repeated measures and the least
squared means are reported. T-tests were used to make
comparisons between groups; all reported p-values are
adjusted for multiple comparisons using a Bonferroni
correction. CA125 levels were provided from the medi-
cal records. The CA125 levels were highly skewed and
the log transformation was used for all analyses. Pear-
son’s correlation was used to determine the association
between CA125 and LRG1. The diagnostic value of
LRG1, when used in addition to CA125, was considered
using receiver operating characteristic (ROC) curves.
ROC curves were constructed by plotting sensitivity ver-
sus 1-specificity and the areas under the curve (AUC)
were calculated. Patients with a benign mass, mucinous
ovarian tumors, fibroma, endometriosis and cystadeno-
mas were defined as having benign pathology, patients
with clear cell and serous ovarian cancer were defined
as having cancer and patients diagnosed as having low
malignant potential disease were excluded from the
ROC analysis.
All values reported are means ± standard deviation
(SD) unless otherwise noted. Statistical analyses were
performed using SAS 9.2 (SAS Institute, Cary, NC).
Gene Expression Analysis
Ovarian tissues from 149 patients were obtained from
the Tissue Procurement Facility as described above; tis-
sue samples were provided to Gene Logic Inc. (Gaithers-
burg, MD) for microarray analysis. On receipt of the
tissue samples at Gene Logic Inc., H&E-stained slides
were examined by a pathologist to verify the diagnosis
and percentage of tumor tissue present, and the absence
of necrosis. All tissue samples underwent stringent qual-
ity control measures to verify the integrity of the RNA
before use in gene array experiments [22,23]. Total
RNA was isolated and gene expression was assayed via
the Affymetrix U133 Set gene array at Gene Logic Inc.
Data was analyzed with the Gene L ogic Genesis Enter-
prise System® Software, using the Gene Logic normaliza-
tion algorithm, as previously described [22, 23]. The
mean expression of LRG1 for each tissue type was cal-
culated using the normalized expression values for Affy-
metrix probeset 228648_at, which is the only probe
targeting LRG1 on this platform.
Reverse Transcriptase PCR
Total RNA was isolated from cell lines and tissues as
previously described [24]. The following oligos (Invitro-
gen, Carlsbad, CA) were used: LRG1 (forward, 5′
CCATCTCCTGTCAACCACCT); reverse, 5′ GTTTC
GGGTTAGATCCAGCA) and b-actin (forward, 5′GG
CCACGGCTGCTTC; reverse, 5′ GTTGGCGTACAG
GTCTTTGC). Select LRG1 cDNA amplicons were
extracted, gel-purified, and sequenced with both LRG1
forward and reverse primers; sequences matched solely
to LRG1 mRNA and genomic DNA sequences. As
LRG1 is produced in the liver [29], we used liver mRNA
as a positive control. b-actin served as a loading control.
Protein Extraction
For tissue, ~ 100 mg of snap-frozen tissue was extracted
using a PowerGen 125 hand-held homogenizer
(Thermo-Fisher Scientific, Waltham, MA) in 2 ml of T-
PER™ Tissue Protein Extraction Reagent (Thermo-Fisher
Scientific) containing a serine-and cysteine-protease
inhibitor cocktail (Roche Applied Science, Basel, Swit-
zerland). Insoluble cellular components were removed
by centrifugation at ~20,000 × g for 20 min. For cell
lines, cells were grown to >90% confluency under nor-
mal conditions, rinsed twice with PBS and harvested
Andersen et al. Journal of Ovarian Research 2010, 3:21
/>Page 3 of 14
with a rubber policeman. Cells were then pelleted at
7300 × g for 2 min and resuspended in 50 mM Tris-
HCl, 150 mM NaCl, 0.1% (v/v) NP-40, pH 8.0; with
Halt™ protease inhibitor cocktail, EDTA-free (Pierce Bio-
technology, Rockford, IL). After a 30 min incubation on
ice with intermittent vortexing, cell suspensions were
sonicated at 20% duty cycle, output 2 with a Sonifier
450 analog (Branson Ultrasonics, Danbury, CT). Cellular
debris was removed by centrifugation at 16000 × g for
20 min. Protein concentration was d etermined by the
BCA method (Thermo-Fisher Scientific).
Glycosidase Treatment
For deglycosidation, cell extracts or LRG1 purified from
human plasma [13] were denatured and treated with
Peptide: N-Glycosidase F (PNGase F) for 2 hr following
the manufacturer ’s instructions (New England BioLabs,
Ipswich, MA).
Western Blotting
Protein samples in Laemmli buffer (2% SDS (w/w), 50%
glycerol, 0.1 M DTT, 50 mM Tris, pH 6.8), were sepa-
rated on a 4-20% or 10% Tris-HCl Criterion gel (Bio-
Rad Laboratories, Hercules, CA), and electroblotted to a
polyvinylidene difluoride (PVDF) membrane in 20%
methanol, 25 mM Tris base, 192 mM glycine, pH 8.0.
The PVDF membranes were blocked with 5% BSA in 20
mM Tris base, pH 7.6, containing 200 mM NaCl, and
0.05% Tween-20, and then incubated with primary anti-
bodies at 1 μg/ml for 1 hr at RT. Membranes were then
washed and incubated with a hor seradish peroxidase-
conjugated secondary antibody (Thermo-Fisher Scienti-
fic) and proteins were detected by enhanced chemilumi-
nescence, using SuperSignal West Femto Maximum
Sensitivity substra tes (Thermo-Fisher Scienti fic) and
exposed to film (Midwest Scientific, Valley Park, MO).
Immunocytochemistry
Nineteen of 2 1 cell lines were examined by immunocy-
tochemistry; the ovarian cancer cell line HEY and NOSE
cell line IMCC5 were not analyzed. Cell lines were
seeded into Nunclon™ 24 well plates (Nalge Nunc Inter-
national, Rochester, NY) and grown to confluence. Cells
were rinsed twice with PBS and then fixed with 100%
methanol overnight at -20°C. Cells were rehydrated with
PBSatRTandblockedwith5%v/vgoatseruminPBS
containing 0.1% Tween-20. Mouse mAb 2E3 (Abnova)
against rLRG1 was added at a 1:50 dilution in blocking
buffer and incubated overnight at 4°C. Cells were
washed and incubated in a 1:50 dilution of fluorescein-
labeled secondary antibody (goat polyclonal antibody
against mouse heavy and light chains (IgG and IgM),
Roche International, Basel,Switzerland)inthedark.
Cells were washed, followed by incubation with 4 ′,
6-diamidino-2-phenylindole (DAPI; Roche International)
in blocking buffer. Cells were then washed with blocking
buffer and stabilized with a SlowFade® Antifade kit (Invi-
trogen, Carlsbad, CA). Cells were observed with an
Olympus IX70 fluorescence microscope with a 20 ×
objective lens (Olympus, Tokyo, Japan) and a PixCell
IIe™ Image Archiving Workstation camera (Molecular
Devices, Sunnyvale, CA). Images were digitized using
DVC View, v.2.2.8 software ( DVC Company, Austin,
TX). DAPI fluorescence was observed with a 285-330
nm excitation filter and a 420 nm absorption filter (U-
MWU; Olympus). FITC fluorescence was observed with
a 470 to 490 nm excitation filter and a 520 nm absorp-
tion filter (U-MP; Olympus).
Processing of Serum-Free Conditioned Media
The ovarian cancer cell line NIH:OVCAR5, and the
NOSE cell line, 1816-575, were grown to >90% con-
fluency in media with serum [RPMI 1640 supplemented
with L-glutamine, 0.2 U/ml bovine pancreas insulin
(Sigma Aldrich), 50 U/ml penicillin and 50 μg/ml strep-
tomycin (Mediatech, Inc., Manassas, VA) and 10% heat
inactivated fetal bovine serum (FBS, Atlanta Biologicals,
Lawrenceville, GA); or a 1:1 mixture of M199: MCDB
105 (Sigma Aldrich) supplemented with 0.1 mg/ml gen-
tamicin (Invitrogen) and 15% FBS], as previously
described [24-26]. Media was decanted and cells were
rinsed three times with PBS. Cells were cultured for an
additional 24 hr in serum-free MCDB 105 media (Sigma
Aldrich). The media was collected and cellular debris
waspelletedat50,000×gat4°Cfor1.5hr.Themedia
was concentrated using a 4 ml, 5000 MWCO PES mem-
brane concentrator (VivaScience, Hanover, Germany)
centrifuged at 5000 × g to a final volume of ~100 μl.
Buffer exchange into PBS was accomplished by three
reservoir changes with PBS. Protein concentration was
determined by the BCA method.
Mass Spectrometry
Proteins were subjected to tryptic digestion, dried down
in a SpeedVac and rehydrated in water/ACN/FA
(95:5:0.1). Mass spectrometry was performed on a linear
ion trap (LTQ, Thermo Electron Corp., San Jose, CA).
Peptide mixtures were desalted and concentrated on a
Paradigm Platinum Peptide Nanotrap (Michrom Biore-
sources, Inc., Auburn, CA) precolumn (0.15 × 50 mm,
400-μl volume) and subsequently to a microcapillary
column, packed with Magic C18AQ reversed-phase
material on a flow splitter (Mich rom Bioresources, Inc.)
at ~250 nl/min. The samples were subjected to a 60
min (10-40% ACN) gradient and eluted into the micro-
capillary column set to 2.0 kV. The LTQ was operated
in the positive-ion mode using data-dependent acquisi-
tion with (collision energy of 29%) on the top four ions
Andersen et al. Journal of Ovarian Research 2010, 3:21
/>Page 4 of 14
detected in the survey scan. An inclusion list repr esent-
ing LRG1 (NCBI: gi|4712536) with m/z of +2 and +3
were included in the method.
Database Searching
MS/MS samples were analyzed using SEQUEST (Ther-
moF innigan , San Jose, CA) and X! Tandem http://www.
thegpm.org. The search was done using an NCBI refer-
ence sequence of the Homo sapiens database (Oct,
2007; 33029 entries including known contaminants).
The search parameters were carbamidomethyl-cysteine
and oxidized methionine with 2 trypsin miscleavages.
Scaffold (version Scaffold-01_05_14, Proteome Software
Inc., Portland, OR) was used to validate MS/MS based
peptide and prot ein identification. Protein probabilities
were assigned by the Protein Prophet algorithm [30].
Proteins of interest with fewer than three peptides for
ID were verified using manual inspection of product ion
spectra in relat ion to candidate peptide sequence s. Pep-
tide candidates were judged as correct if a continuous
series of a minimum of four b-or y-type product ions
were present, if all product ion peaks were at least 3
times the intensity of background and if all experimental
fragment ions could be matched to theoretical fragment
ions.
Results
Quantification of LRG1 in Serum
The level of serum LRG1 from 58 women with serous
ovarian cancer and 56 healthy control women was quan-
tified by ELISA. The distribution of serum LRG1 levels
and age of patients and controls is presented in Table 1.
Ovarian cancer patients had a statistically significant ~2-
fold increase in serum L RG1 compared to healthy con-
trols (age adjusted, p = 0.0008; Figure 1A). The mean
LRG1 concentration for ovarian cance r patient sera was
89.33 ± 77.97 μg/ml compared to 42.99 ± 9.88 μg/ml
for non-cancer sera. Because the age of the ovarian can-
cer group was significantly higher than that of the
healthy controls, we further explored the effect of the
age difference between cases and controls and found age
did not affect the significant difference in LRG1 concen-
tration between the cancer and control groups (results
Table 1 LRG1 concentration in sera from serous ovarian
cancer patients and healthy female controls
N Median Age LRG1 μg/ml
Total 114
Control 56 42.00 42.99 +/- 9.88
Cancer 58 64.00 89.33 +/- 77.90
Cancer Stage
1, 2 7 57.00 62.52 +/- 36.53
3, 4 51 65.00 93.01 +/- 81.50
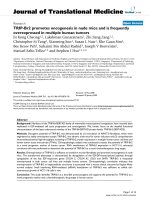
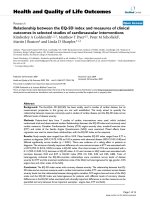
Figure 1 ELISA detection of serum LRG1.A)SerumLRG1
concentrations were determined for 58 ovarian cancer patients and
56 of the control patients. Box plots are presented here; the solid
line indicates the median serum LRG1 for each group. Serum levels
of LRG1 were significantly higher in the ovarian cancer sera than in
control sera, after adjusting for age (p=0.0008). B) LRG1 in serum of
individual patients with benign and malignant gynecological
diseases. Median LRG1 values for each group are indicated by the
solid bars. Dashed line indicates the mean LRG1 concentration from
control serum in panel A. LRG1 concentrations are significantly
higher in serum of women with ovarian cancer (serous and clear
cell subtypes) than in serum of women with other gynecological
diseases (p <0.0001). C) Receiver operator curves (ROC) for CA125
alone (blue line), LRG1 alone (red line) and LRG1 in combination
with CA125 (green line). The area under the curve (AUC) for CA125
alone was 0.88, for LRG1 alone the AUC = 0.77, and the AUC for
CA125 and LRG1 together was 0.89. There was no significant
difference in sensitivity between CA125 alone and CA125 in
combination with LRG1 (p=0.2728).
Andersen et al. Journal of Ovarian Research 2010, 3:21
/>Page 5 of 14
not shown). When the 58 ovarian cancer serum samples
were separated by stage, the mean LRG1 serum level for
the stage I and II cancer patients (n = 7) was 62.52 ±
36.53 μg/ml, compared to 93.01 ± 81.50 μg/ml for the
stage III and IV cancer patients (n = 51, p > 0.05).
ELISAs were then performed on a second set of indi-
vidual serum samples from women taken pre-surgery
for a gynecologic disease (Table 2). Among the eight
diagnosis groups, the 79 serum samples from women
with serous ovarian cancer had the highest mean LRG1
level (135.54 ± 64.16 μg/ml), closely followed by the 8
serum samples from women with clear cell cancer
(134.26 ± 61.18 μg/ml). LRG1 concentrations were sig-
nificantly different across diagnosis groups (p < 0.0001,
Figure 1B). After adjusting for multiple comparisons, the
most notable difference was between serous ovarian
cancer and other benign ovarian mass (p = 0.0007), with
LRG1 concentrations being significantly higher in the
serous ovarian cancer patients. All of these LRG1 levels
were higher than those of the non-cancer healthy con-
trols from the original set of sera tested (Figure 1A).
We found a moderate correlation between CA125 and
LRG1 (r = 0.47, p < 0.0001). In order to examine the
diagnostic value of LRG1 in distin guishing patients with
benign tumors from those with ovarian cancer, we com-
pared receiver operator curves (ROC) for CA125 alone,
LRG1 alone and in combination with CA125 (Figure
1C). The ROC of the combined markers was not signifi-
cantly different from the ROC of CA125 alone; the area
under the curve (AUC) for CA125 alone was 0.88 (95%
CI: 0.82, 0.94) and the AUC for CA125 and LRG1 was
0.89 (95% CI: 0.84, 0.96; p = 0.2728). There was no sig-
nificant improvement in sensitivity when adding LRG1.
Ascites fluid from 29 women with serous ovarian can-
cer was also tested by ELISA for LRG1 prot ein and was
found to be elevated relative to serum levels with a
mean value of 142.28 ± 73.56 μg/ml.
Differential Expression of LRG1 mRNA
To determine whether the ovarian cancer cells may
serve as a potential source of the increased serum LRG1
levels in ovarian cancer patients, we quantified LRG1
mRNA expression in ovarian tumors compared to nor-
mal ovaries by gene microarray analysis (Figure 2A).
LRG1 mRNA expression levels were about 2-fold higher
in benign ovarian tumors and about 3-4 fold higher in
ovarian serous cancers compared to norma l ovaries.
Similarly, LRG1 expression levels were ~2 to 2.5-fold
higher in ovarian tumor metastases than in normal
ovaries (Figure 2A). Interesting ly, although a small sam-
ple size, the highest LRG1 mRNA levels were in tumors
of low malignant potential.
Using RT-PCR, we also detected increased LRG1
mRNA expression in ovarian tumors compared to nor-
mal ovaries (Figure 2B). Eight tissue samples from
patients with stage II or higher serous ovarian cancer
and seven normal ovaries were tested. Six of the eight
ova rian can cers expressed higher levels of LRG1 mRNA
than normal ovaries. As LRG1 is an acute-phase protein,
primarily produced in the liver [29], we used liver
mRNA as a positive control.
To control for the possible influence of stromal,
endothelial, and blood cells present in tissue samples,
we examined LRG1 mRNA expression levels in ovarian
cancer and NOSE cell lines by RT-PCR. LRG1 mRNA
expression was observed in 7 of the 12 ovarian cancer
Table 2 Concentration of LRG1 in sera collected prior to surgery
Diagnosis N Mean
1
[LRG1]
μg/ml
95% CI N Mean
Age
95% CI N Log
(CA125)
95% CI
Serous 79 135.54 121.30,
149.78
79 64.03 61.36,
66.69
74 6.21 5.87,
6.55
Clear Cell 8 134.26 91.59, 176.93 8 58.38 50.00,
66.75
8 4.53 3.49,
5.57
LMP 21 91.11 64.17, 118.05 20 51.40 46.10,
56.70
16 4.62 3.88,
5.35
Mucinous
Cystadenoma
10 94.31 55.63, 132.98 10 45.60 38.11,
53.09
8 3.35 2.31,
4.39
Benign Ovarian Mass 30 71.76 47.18, 96.34 27 52.15 47.59,
56.71
25 2.91 2.32,
3.50
Cystadenoma 16 73.06 42.47, 103.65 16 53.00 47.08,
58.92
14 3.21 2.43,
4.00
Endometriosis 19 87.49 59.06, 115.93 19 43.11 37.67,
48.54
18 4.25 3.56,
4.94
Fibroma 10 88.23 50.28, 126.17 10 63.20 55.71,
70.69
9 3.50 2.52,
4.48
Total 193 189 172
1
Least-squares means from repeated measures general linear model.
Andersen et al. Journal of Ovarian Research 2010, 3:21
/>Page 6 of 14
cell lines tested, but no measurable expression was
detected in the 4 immortalized NOSE cell lines (Figure
2C).
Differential Expression of LRG1 Protein
Western blotting was used to determine if LRG1 protein
was present at higher levels in serous ovarian cancer tis-
sues compared to normal ovaries. All seven ovarian
cancer specimens demonstrated higher levels of LRG1
protein than the five normal ovaries (Figure 3A).
Although several protei n bands were visualized in both
the ovarian cancer tissues and the normal ovary, the
size of the major protein band in the tumors was ~47
kD, while the major protein band in no rmal ovaries was
~ 51 kD. A minor protein band of ~34-36 kD, which
corresponds to the predicted size of unmodified LRG1,
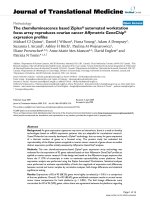
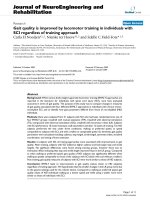
Figure 2 Expression of LRG1 tran scripts in ovarian cancer tissues and cell lines. A) Microarray analysis of LRG1 gene expression in ovarian
cancer tissues was performed on Affymetrix HU_133 gene chips. Mean expression of LRG1 RNA was determined for normal ovary, benign ovary
tumors, and primary and metastatic ovarian cancers. (n) = number of samples per tissue type. B) RT-PCR of LRG1 expression in ovarian cancer
tissue samples (N = 8) relative to normal ovary tissue (N =7). C) LRG1 expression in ovarian cancer cell lines compared to immortalized NOSE cell
lines. b-actin was used as an amplification control.
Andersen et al. Journal of Ovarian Research 2010, 3:21
/>Page 7 of 14
was observed in several of the tumor and normal ovary
samples. A single protein band at ~47 kD was visualized
in normal kidney tissue (Figure 3A) and also in liver tis-
sue (not shown).
Because surface epithelial cells comprise only a minor
fraction of the normal ovary, we also examined the
expression of LRG1 protein i n cell lines derived from
ovarian cancer cells and normal ovarian surface epithe-
lia. In Western blot analysis of cell lines, t he ~47 and
~51 kD forms of LRG1 protein were present in both
ovarian cancer and NOSE cell lines (Figure 3B); the pre-
dominant form detected in all cases was 47 kD. Interest-
ingly, four of the five serous ovarian cancer cell lines,
OVCA433, OVCAR3, A2780-S, and A2780-CP
expressed predominantly the ~47 kD form of L RG1 and
little to none of the ~51 kD protein band. Two other
serous ovarian cancer cell lines, CAOV3 and MA148,
also expressed high levels of the ~47 kD band, but not
the ~51 kD band (data not shown). In addition, the cis-
platin-resistant cancer line A2780-CP expressed higher
levels of the ~47 kD protein band compared to its cis-
platin-sensitive counterpart A2780-S (Figure 3B). No
LRG1 protein was detected in the NOSE cell line 1816-
686.
To establish whether the multiple iosforms of LRG1
observed by Western blot represent different glycosyla-
tion states, we treated purified LRG1 protein and cell-
free extracts with the enzyme PNGase F to remove car-
bohydrate residues from the LRG1 protein backbone. As
shown in Figure 3C (left panel), LRG1 purified from
human plasma has an apparent molecular weight of ~
47 kD prior to PNGase F treatment. After digestion, the
molecular weight of LRG1 is reduced to ~ 34 kD, indi-
cating protein deg lycosylation. Si milar results were
observed in cell-free extracts of the ovarian cancer cell
line SKOV3 and the NOSE cell line 1816-575 (Figure
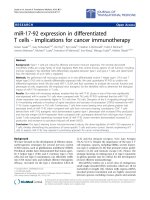
Figure 3 Expression and localization of LRG1 protein in ovarian cancer tissues and cell lines. A) 50 µg of total protein extract from
ovarian cancer tissues (N = 7) and normal ovaries (N =5) were evaluated by Western blot for LRG1 protein expression. Kidney was used as a
positive control tissue, as it contains an abundance of epithelial cells. B) LRG1 protein expression in 20 µg of total protein extract from ovarian
cancer cell lines and immortalized NOSE cells. b-actin was used as the loading control. C) Left panel; silver stained polyacrylamide gel of LRG1
purified from human plasma, PNGase F, and purified LRG1 treated with PNGase F. Right panel; Western blot for LRG1 in protein extracts from
cell lines with and without PNGase F treatment. D) Subcellular localization of LRG1 is shown by immunocytochemistry in ovarian cancer cell
lines (OVCAR5, OVCAR433, OV2008, C-13, and SKOV3) and immortalized NOSE cell line (1816-575); 200X magnification, scale bar = 20 µm. FITC
(green) = LRG1, DAPI (blue) = nucleus.
Andersen et al. Journal of Ovarian Research 2010, 3:21
/>Page 8 of 14
3C, right panel), where multiple higher molecular weight
specie s were reduced to a single lower molecular weight
band upon digestion with PNGase F.
Cellular Localization of LRG1
Using immunocytochemistry, LRG1 protein was
detected in the cytoplasm of all 19 cell lines tested;
representative examples are shown in Figure 3D. LRG1
also localized to the plasma membrane in most of the
ovarian cancer cell lines. Three NOSE cell lines
(HIO135, HIO117, and IMCC3) also had moderate
amounts of LRG1 localized to the plasma membrane.
Punctate cytoplasmic localization was observed in NIH:
OVCAR5, HEY, C-13, OV2008, ES-2, and OVCA429
ovarian cancer cell lines and all six of the NOSE cell
lines. Consistent with the Western blot, the cisplatin-
resistant cancer line A2780-CP demonstrated more
intense staining compared to its cisplatin-sensitive coun-
terpart A2780-S (data not shown).
Identification of LRG1 in NIH:OVCAR5 Conditioned media
To determine whether ovarian cells secrete LRG1 and
thus may directly contribute to the elevated levels of
LRG1 protein observed in the ovarian cancer patients’
sera, we analyzed serum-free conditioned media from
NIH:OVCAR5 cells using mass spectrometry. We have
previously identified twelve LRG1 peptides in serum b y
the mass spectrometry-based proteomic techniques of
iTRAQ® and DI GE (Table 3; [8,9]). Three of these pep-
tides, DLLLPQPDLR, ALGHLDLSGN R, and
YLFLNGNK, were detected in sera in multiple experi-
ments (Table 3; [8,9]). Similarly, using an inclusion list
of all predicted tryptic LRG1 peptides, we used mass
spectrometry to identify the LRG1 peptide
ALGHLDLSGNR at 95% confidence (Scaffold score) in
NIH:OVCAR5 conditioned media; the peptide identity
was confirmed by manual inspection of the mass spec-
trum (Figure 4). The peptide ALGHLDLSGNR is unique
to human LRG1, which supports the idea that LRG1 is
produced and secreted by the NIH:OVCAR5 cells rather
than being introduced from the growth media.
LRG1 was also detected in the conditioned media of
the NIH:OVCAR5 cel ls by Western blotting. We
observed two major LRG1 protein bands of ~47 and
~51 kD, as well as minor protein bands of ~34/36, ~39/
40, and ~65 kD in the NIH:OVCAR5 conditioned media
Table 3 LRG1 peptides identified by mass spectrometry
Depletion
experiment
#of
unique
peptides
Peptide sequence Peptide
sequence
confidence
Sequence coverage m/z
MARS SC† 3 TLDLGENQLETLPPDLLR 99 192-209 2037.29
DLLLPQPDLR 31 230-239 1179.37
VTLSPK N/A 36-41 643.76
IgY-12 SC† 6 LQELHLSSNGLESLSPEFLRPVPQ 99 94-117 2691.03
ALGHLDLSGNR 99 165-175 1152.26
TLDLGENQLETLPPDLLR 99 192-209 2037.29
DLLLPQPDLR 98 230-239 1179.37
LQVLGK 27 224-229 656.81
YLFLNGNK 13 240-247 968.1
IgY-12 LC† 10 ALGHLDLSGNR 99 165-175 1152.26
TLDLGENQLETLPPDLLR 99 192-209 2037.29
VAAGAFQGLR 99 251-260 989.13
GQTLLAVAK 99 337-345 900.07
DLLLPQPDLR 98 230-239 1179.37
LHLEGNKLQVLGK 97 217-229 1448.71
YLFLNGNK 89 240-247 968.1
GPLQLER 81 210 216 811.92
LQVLGK 24 224-229 656.81
VLDLTR 8 120-125 715.84
IgY-12 LC‡ 6 VAAGAFQGLR 95 251-260 989.13
YLFLNGNK 95 240-247 968.1
ALGHLDLSGNR 95 165-175 1152.26
GQTLLAVAK 95 337-345 900.07
DLLLPQPDLR 95 230-239 1179.37
† iTRAQ® labeling; ‡Differential in-gel electrophoresis labeling.
Andersen et al. Journal of Ovarian Research 2010, 3:21
/>Page 9 of 14
(Figure 4C). By comparison, Western blots of the condi-
tioned media from the NOSE cell line 1816-575
detected major LRG1 protein bands of ~47 and ~39/40
kD as well as a minor protein band of <37 kD. Finally,
we used the ELISA to detect LRG1 in the NIH:OVCA5
conditioned media (data not shown). Taken together,
these results demonstrate that, in addition to being
synthesized in the liver, ovarian cancer cells synthesize
and secrete LRG1, and may therefore contribute to the
elevated LRG1 levels observed in the sera of the ovarian
cancer patients.
Discussion
We recently identified leucine-rich alpha-2-glycoprotein-
1 (LRG1) as one of several proteins overexpressed in the
serum of patients with ovarian cancer [8,9]. In this
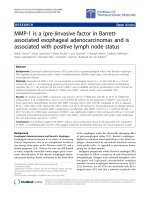
Figure 4 Secretion of LRG1 into conditioned m edia by ovarian cancer cell lin e NIH:OVCAR5. A) MS spectru m for LRG1 peptide,
ALGHLDSGNR, identified in the spent media of NIH:OVCAR5 cells with 95% (peptide) probability. Conditioned media from the ovarian cancer cell
line was concentrated and processed for MSMS analysis. LRG1was identified with low (protein) probability with a single peptide in the complex
mixture. The identity of the peptide was confirmed by manual inspection. Peak assignments are indicated. B) m/z for predicted b- and y- ions
for peptide ALGHLDSGNR. Highlighted peaks were identified in the spectrum shown in A. C) Western immunoblot of conditioned media from
NOSE cell line 1816-575 and ovarian cancer cell line NIH:OVCAR5. 50 µg of concentrated, conditioned media from each cell line was loaded.
Position of molecular weight standards, left.
Andersen et al. Journal of Ovarian Research 2010, 3:21
/>Page 10 of 14
study, we sought to validate this observation and quanti-
tate the levels of LRG1 in a larger cohort of patients’
sera. We have also shown that ovarian cancer cells may
directly contribute to the elevated levels of LRG1
observed in patients’ sera.
The increased serum LRG1 levels in ovarian cancer
patients that we had observed by Western blot in pooled
samples [8], were also evident by ELISA in individual
samples. When the initial 114 serum samples were
tested by ELISA, serum LRG1 was found to be approxi-
mately 2-fold greater in serous ovarian cancer patients’
sera compared to sera from healthy control women;
however, the variance among the ovarian cancer patient
samples resulted in unfavorable estimates of sensitivity
and specificity. This led us to explore the levels of
serum LRG1 among women with different types of
benign and malignant ovarian masses. Using a separate
set of 193 patient serum samples obtained immediately
prior to surgery for a suspicious adnexal mass, LRG1
values were significantly higher (1.7-fold) in patients
with serous and clear cell ovarian cancer compared to
those with b enign gynecological diseases. Although our
gene microa rray data showed that LRG1 mRNA expres-
sion levels were greatest in low malignant potential
tumors, the level of serum LRG1 protein in the LMP
tumors was significantly lower than for both serous and
clear cell ovarian cancer.
Although a biomarker for the early detection of ovar-
ian cancer would have a greater impact, the ability to
distinguish malignant from benign disease prior to su r-
gery could be useful in determining which patients
would benefit from treatment by a gynecological oncolo-
gist. Recently, a panel of biomarkers was approved by
the FDA to aid in the diagnosis of ovarian tumors prior
to surgery (OVA1; [5]). This panel includes CA125 as
well as b eta-2 microglobulin, apolipoprotein A1, tr ans-
thyretin and transferrin, but not LRG1.
Though the mean concentration of serum LRG1 in
sero us ovarian cancer patients differed between samples
in the two data sets, differences in serum preparation
and storage may have affected the quantity of LRG1
detected. For exam ple, Govorukhina et al., [31] recently
reporte d that LRG1 levels were decreased in serum with
clotting time of longer than 1 hr. We maintained a strict
protocol for sample collection and storage for the sam-
ples taken from patients at the University of Minnesota,
in order to minimize these types of vari ations (see
Methods), and this likely explains the higher LRG1
values in the second dataset compared with the first set
of samples obtained from the GOG.
Initially, LRG1 was classified as an “acute-phase pro-
tein” involved in the body’s response to bacterial and
viral infection [32], but has since been identified as ele-
vated in a variety of disease states, both malignant and
benign, including toxic-shock syndrome [13], and during
inflammatory responses of cystic fibrosis [33]. LRG1 is
also increased in serum of patients with hepatocellular
carcinoma following therapeutic ablation treatment [34].
Differential expression techniques employing affinity
depletion of high abundance proteins and 2 D electro-
phoresis have found serum LRG1 to be upregulated in
lung and pancreatic cancer [35-37]. Proteomic research
using 2 D SDS-PAGE to analyze body fluids found
LRG1 to be upregulated in cerebrospinal fluid and
serum of patients with hydrocephalus and silicosis
[19,38].
We conducted a series of experiments exa mining
ovarian cancer tumor cells as a possible source of serum
LRG1. Others have identified LRG1 peptides by mass-
spectrometry in the secreted or cell surface fractions of
CAOV3 and OVCAR3 serous ovarian cancer cell lines,
but not in the clear cell ovarian cancer cell line ES-2
[39]. LRG1 peptides have also been identified in ascites
fluid and cells from ovarian cancer patients [40].
Recently, elevated levels of LRG1 have been identified in
chemoresistant ovarian tumor tissue [41], and in immu-
nodepleted serum, using ICAT quantitative proteomics
[42]. Additionally, LRG1 peptides have been identified
in the conditioned media of prostate cancer [43,44], and
breast cancer cell lines [45] and in the peritoneal fluid
of women with uterine leiomyomas [46]. The produc-
tion and secretion of LRG1 by tumor cells suggests
there may be a more direct relationship between tumor
burden and serum levels of LRG1 than for other acute
phase proteins secreted only by the liver. For example,
although haptoglobin levels are increased in the sera of
ovarian cancer patients, no hapto globin RNA or protein
were detected by Ye et al. [47] in seven ovarian cancer
cell lines.
In a limited number of cases, we have analyzed sera
from patients prior to surgery and following treatment
for ovarian cancer. We have found that serum LRG1
levels appear to be more directly related to tumor bur-
den compared to CA125. For example, in three of six
patients with sub-optimal debulking surgery, CA125
levels dropped substantial ly, while LRG1 levels remained
elevated. In six cases, serum LRG1 dropped dramatically
post chemotherapy. In five cases, LRG1 levels appeared
to rise prior to CA125 levels and the onset of recurrent
disease. However, given the very low n umbers o f
patients that we have analyzed to date, the use of LRG1
as a marker for disease recurrence, while tantalizing, is
purely speculative.
By immunocytochemistry, LRG1 was localized to the
cytoplasm of all of the ovarian cell lines tested, both
cancer and normal, and was observed on the plasma
membrane of most. The serous papillary ovar ian cancer
cell line, NIH:OVCAR5, had the most intense plasma
Andersen et al. Journal of Ovarian Research 2010, 3:21
/>Page 11 of 14
membrane staining for LRG1. In addition, this cell line
expressed high levels of the ~51 kD LRG1 protein band.
The LRG1 sequence contains a predicted transmem-
brane domain [48] which overlaps the signal sequence;
this may allow for the expression of LRG1 at the cell
surface. Alternatively, the localization of LRG1 that we
observed on the surface of the NIH:OVCAR5 cells may
be indicative of cells in the process of secreting LRG1.
Examination of ovarian tumor extracts and cell lines
by Western blot revealed increased expression of LRG1
protein in malignant serous tumors and ovarian cancer
cell lines compared to their respective controls, as well
as the presence of several isoforms of LRG1, though
notably the ~47 kD LRG1 band was most intense in
each of the malignant ovarian tumor protein extracts.
The presence of numerous isoforms for LRG1 has
previously been shown by 2 D SDS-PAGE
[8,11,32,34, 36-38], suggesting the presence of multiple
glycosylated isoforms of LRG1. Indeed, we showed that
glycosidase treatment of LRG1, both purified and in
extracts of ovarian cancer and NOSE cell lines, reduced
the apparent molecular weight of LRG1 indicating the
presence of carbohydrate modifications of the protein
backbone.
The N-glycosylation of LRG1 produced by the ovarian
cancer cells is consistent with its secret ion. The ~51 kD
band was found at very low levels in the ovarian cancer
tumor extracts and was present in the protein extracts
of only a few of the ovarian cancer cell lines. It is possi-
ble that this ~51 kD glycoform of LRG1 is secreted by
the serous ovarian cancer cells, and may contribute to
the elevated levels of LRG1 quantitated by ELISA in the
sera of these patients. This hypothesis is supported by
our Western blot findings that an ~51 kD band was
found in the conditioned media of the NIH:OVCAR5
cells but not the NOSE cells, again suggesting that the
~51kDglycoformofLRG1maybepreferentially
secreted, or aberrantly glycosylated in ovarian cancer.
Glycosylation of serum proteins in cancer states is
well documented, and serum glycoproteins are being
investigated for use as biomarkers in prostate, breast,
lung, ovarian and other gynecologic cancers [49-52].
Glycosylation of surface proteins on ovarian carcinoma
cells has been reported to mediate adhesion, migration,
and invasion through the ECM [53]. G iven that murine
LRG1 has been shown to bind to several extracellular
matrix proteins, and also TGFb [17], a possible role for
LRG1 in ovarian cancer progression is intriguing.
Alternatively, LRG1 may be playing a role in apopto-
sis. We have found that MCF-7 breast cancer cells
transfected with LRG1 are more resistant to apoptosis
induction than non-transfected cells due to cytoplasmic
LRG1 binding cytochrome c and inhibition of Apaf-1
activation (Jemmerson and colleagues, manuscript in
preparation). In addition, transformed granulocytic cells
transfected with LRG1 were reported by Ai et al. [21] to
be more viable than non-transfected cells when trans-
ferred between different media. Likewise, LRG1 may be
a survival factor for ovarian cancer cells, possibly ren-
dering them more resistant to chemotherapy. It is inter-
esting to note that the cisplatin-resistant A2780-CP cells
express higher levels of LRG1 protein than their more
sensitive counterparts A2780-S (Figure 3B); however, no
difference in LRG1 protein expression was found for the
cisplatin resistant cell line C13, compared to the corre-
sponding cisplatin sensitive cell line OV2008.
Conclusions
We have demonstrated the potential for using LRG1 as
a serum biomarker for ovarian cancer. Furthermore, we
showed the expression of LRG1 mRNA and protein in
ovarian cancer tissues and cell lines, signifying that the
tumor cells could be contributing to the increased levels
of LRG1 in sera of ovarian cancer patients. Though
future studies using a larger patient cohort are needed
to determine whether LRG1 may serve as a biomarker
for presurgical diagnosis of ovarian cancer, for the
detection of recurrent disease, and/or as a target
for therapeutic treatment, these initial result s are
encouraging.
Acknowledgements
We would like to thank Dr. Patricia Kruk (University of South Florida, Tampa,
FL), Dr. Barbara Vanderhyden (University of Ottawa, Ottawa, Ontario, Canada),
Dr. Judah Folkman (Department of Vascular Biology, Boston Children’s
Hospital, Boston, MA), Dr. Robert Bast Jr. (University of Texas, Houston, TX),
and Dr. Sundaram Ramakrishnan (University of Minnesota, Minneapolis, MN)
for the cell lines; Sarah Bowell, Diane Rauch, and Marissa Mackey of the
University of Minnesota Tissue Procurement Facility for providing tissue,
blood, and ascites samples; the Gynecologic Oncology Group Tissue Bank
for the serum samples; Robin Bliss of the Masonic Cancer Center’s
Biostatistics Core Facility; the Minnesota Supercomputing Institute; and the
staff of Gene Logic Inc., Gaithersburg, MD, for performing the gene
expression experiments with the human tissue samples. This work was
supported by grants from the Minnesota Ovarian Cancer Alliance (APNS),
National Institutes of Health/National Cancer Institute R01-CA106878 (APNS),
and Cancurables (APNS).
Author details
1
Department of Laboratory Medicine and Pathology, University of Minnesota,
MMC 609, 420 Delaware St. SE Minneapolis, MN, USA.
2
Department of
Microbiology, University of Minnesota, Minneapolis, MN, USA.
3
Department
of Obstetrics and Gynecology, University of Minnesota, Minneapolis, MN,
USA.
4
Department of Biochemistry, Molecular Biology and Biophysics,
University of Minnesota, Minneapolis, MN, USA.
5
Masonic Cancer Center
Biostatistics and Informatics Core, University of Minnesota, Minneapolis, MN,
USA.
Authors’ contributions
JA performed the Western blots, immunocytochemistry, and conditioned
media experiments, participated in the design of the study and data
analysis, and drafted the manuscript. RJ designed and supervised the ELISA
assay, and performed the glycosidase assay. KB participated in the data
analysis and writing of the manuscript. PA and MG participated in the
design of the study, oversaw the collection of patient samples, and edited
the manuscript. BW participated in the design and analysis of the
Andersen et al. Journal of Ovarian Research 2010, 3:21
/>Page 12 of 14
identification of LRG1 in conditioned media, and performed the mass
spectrometry. BM and SW performed the ELISA experiments. KH performed
the RT-PCR analysis. RI performed the data analysis and helped to draft the
manuscript. AS participated in designing, coordination and supervision of
the study, and writing of the manuscript. All authors read and approved the
final manuscript.
Competing interests
R.J. holds U.S. Patent 7,416,850 B2 for the LRG1 ELISA employed in this
study. Although he supervised the assaying, he did not handle the samples
and did not know their identification until the data were tabulated.
Received: 10 May 2010 Accepted: 10 September 2010
Published: 10 September 2010
References
1. Ries L, Harkins D, Krapcho M, Mariotto A, Miller BA, Feuer EJ, Clegg L,
Eisner MP, Horner MJ, Howlader N, Hayat M, Hankey BF, Edwards BK: SEER
Cancer Statistics Review, 1975-2003. Book SEER Cancer Statistics Review,
1975-2003 (Editor ed.^eds.). City 2005.
2. Jemal A, Siegel R, Ward E, Hao Y, Xu J, Murray T, Thun MJ: Cancer statistics,
2008. CA Cancer J Clin 2008, 58:71-96.
3. Badgwell D, Bast RC Jr: Early detection of ovarian cancer. Dis Markers
2007, 23:397-410.
4. Yurkovetsky ZR, Linkov FY, D EM, Lokshin AE: Multiple biomarker panels
for early detection of ovarian cancer. Future Oncol 2006, 2:733-741.
5. Fung ET: A recipe for proteomics diagnostic test development: the OVA1
test, from biomarker discovery to FDA clearance. Clin Chem 56:327-329.
6. Mercado C, Zingmond D, Karlan BY, Sekaris E, Gross J, Maggard-Gibbons M,
Tomlinson JS, Ko CY: Quality of care in advanced ovarian cancer: the
importance of provider specialty. Gynecol Oncol 117:18-22.
7. Anderson NL, Anderson NG: The human plasma proteome: history,
character, and diagnostic prospects. Mol Cell Proteomics 2002, 1:845-867.
8. Andersen JD, Boylan KLM, Xue FS, Anderson LB, Witthuhn BA,
Markowski TW, Higgins L, Skubitz APN: Identification of candidate
biomarkers in ovarian cancer serum by depletion of highly abundant
proteins and differential in-gel electrophoresis. Electrophoresis 2010, 31.
9. Boylan KLM, Andersen JD, Anderson LB, Higgins L, Skubitz APN:
Quantitative proteomic analysis by iTRAQ® for the identification of
candidate biomarkers in ovarian cancer serum. Proteome Sci 2010, 8:31.
10. Schwick HG, Haupt H: Purified human plasma proteins of unknown
function. Jpn J Med Sci Biol 1981, 34:299-327.
11. Hoogland C, Mostaguir K, Sanchez JC, Hochstrasser DF, Appel RD: SWISS-
2DPAGE, ten years later. Proteomics 2004, 4:2352-2356.
12. Haupt H, Baudner S: [Isolation and characterization of an unknown,
leucine-rich 3.1-S-alpha2-glycoprotein from human serum (author’s
transl)]. Hoppe Seylers Z Physiol Chem 1977, 358:639-646.
13. Weivoda S, Andersen JD, Skogen A, Schlievert PM, Fontana D, Schacker T,
Tuite P, Dubinsky JM, Jemmerson R: ELISA for human serum leucine-rich
alpha-2-glycoprotein-1 employing cytochrome c as the capturing ligand.
J Immunol Methods 2008, 336:22-29.
14. Kobe B, Kajava AV: The leucine-rich repeat as a protein recognition motif.
Curr Opin Struct Biol 2001, 11:725-732.
15. Takahashi N, Takahashi Y, Putnam FW: Periodicity of leucine and tandem
repetition of a 24-amino acid segment in the primary structure of
leucine-rich alpha 2-glycoprotein of human serum.
Proc Natl Acad Sci USA
1985, 82:1906-1910.
16. O’Donnell LC, Druhan LJ, Avalos BR: Molecular characterization and
expression analysis of leucine-rich alpha2-glycoprotein, a novel marker
of granulocytic differentiation. J Leukoc Biol 2002, 72:478-485.
17. Saito K, Tanaka T, Kanda H, Ebisuno Y, Izawa D, Kawamoto S, Okubo K,
Miyasaka M: Gene expression profiling of mucosal addressin cell
adhesion molecule-1+ high endothelial venule cells (HEV) and
identification of a leucine-rich HEV glycoprotein as a HEV marker. J
Immunol 2002, 168:1050-1059.
18. Sun D, Kar S, Carr BI: Differentially expressed genes in TGF-beta 1
sensitive and resistant human hepatoma cells. Cancer Lett 1995, 89:73-79.
19. Li X, Miyajima M, Jiang C, Arai H: Expression of TGF-betas and TGF-beta
type II receptor in cerebrospinal fluid of patients with idiopathic normal
pressure hydrocephalus. Neurosci Lett 2007, 413:141-144.
20. Cummings C, Walder J, Treeful A, Jemmerson R: Serum leucine-rich alpha-
2-glycoprotein-1 binds cytochrome c and inhibits antibody detection of
this apoptotic marker in enzyme-linked immunosorbent assay. Apoptosis
2006, 11:1121-1129.
21. Ai J, Druhan LJ, Hunter MG, Loveland MJ, Avalos BR: LRG-accelerated
differentiation defines unique G-CSFR signaling pathways downstream
of PU.1 and C/EBPepsilon that modulate neutrophil activation. J Leukoc
Biol 2008, 83:1277-1285.
22. Hibbs K, Skubitz KM, Pambuccian SE, Casey RC, Burleson KM, Oegema TR Jr,
Thiele JJ, Grindle SM, Bliss RL, Skubitz AP: Differential gene expression in
ovarian carcinoma: identification of potential biomarkers. Am J Pathol
2004, 165:397-414.
23. Skubitz AP, Pambuccian SE, Argenta PA, Skubitz KM: Differential gene
expression identifies subgroups of ovarian carcinoma. Transl Res 2006,
148:223-248.
24. DeRycke MS, Andersen JD, Harrington KM, Pambuccian SE, Kalloger SE,
Boylan KL, Argenta PA, Skubitz AP: S100A1 expression in ovarian and
endometrial endometrioid carcinomas is a prognostic indicator of
relapse-free survival. Am J Clin Pathol 2009, 132:846-856.
25. Subramanian IV, Bui Nguyen TM, Truskinovsky AM, Tolar J, Blazar BR,
Ramakrishnan S: Adeno-associated virus-mediated delivery of a mutant
endostatin in combination with carboplatin treatment inhibits
orthotopic growth of ovarian cancer and improves long-term survival.
Cancer Res 2006, 66:4319-4328.
26. Shaw TJ, Senterman MK, Dawson K, Crane CA, Vanderhyden BC:
Characterization of intraperitoneal, orthotopic, and metastatic xenograft
models of human ovarian cancer. Mol Ther 2004, 10:1032-1042.
27. Kruk PA, Maines-Bandiera SL, Auersperg N: A simplified method to culture
human ovarian surface epithelium. Lab Invest 1990, 63:132-136.
28. Nicosia SV, Wilbanks GD, Saunders B, Mayer J, Cardosi RJ, Kruk PA, Cheng J,
Bai W, Coppola D, Fiorica J: Cytology of human ovarian surface epithelial
brushings. Cancer
2004, 102:1-10.
29. Shirai R, Hirano F, Ohkura N, Ikeda K, Inoue S: Up-regulation of the
expression of leucine-rich alpha(2)-glycoprotein in hepatocytes by the
mediators of acute-phase response. Biochem Biophys Res Commun 2009,
382:776-779.
30. Keller A, Nesvizhskii AI, Kolker E, Aebersold R: Empirical statistical model to
estimate the accuracy of peptide identifications made by MS/MS and
database search. Anal Chem 2002, 74:5383-5392.
31. Govorukhina NI, de Vries M, Reijmers TH, Horvatovich P, van der Zee AG,
Bischoff R: Influence of clotting time on the protein composition of
serum samples based on LC-MS data. J Chromatogr B Analyt Technol
Biomed Life Sci 2009, 877:1281-1291.
32. Bini L, Magi B, Marzocchi B, Cellesi C, Berti B, Raggiaschi R, Rossolini A,
Pallini V: Two-dimensional electrophoretic patterns of acute-phase
human serum proteins in the course of bacterial and viral diseases.
Electrophoresis 1996, 17:612-616.
33. Norkina O, Kaur S, Ziemer D, De Lisle RC: Inflammation of the cystic
fibrosis mouse small intestine. Am J Physiol Gastrointest Liver Physiol 2004,
286:G1032-1041.
34. Kawakami T, Hoshida Y, Kanai F, Tanaka Y, Tateishi K, Ikenoue T, Obi S,
Sato S, Teratani T, Shiina S, et al: Proteomic analysis of sera from
hepatocellular carcinoma patients after radiofrequency ablation
treatment. Proteomics 2005, 5:4287-4295.
35. Yu KH, Rustgi AK, Blair IA: Characterization of proteins in human
pancreatic cancer serum using differential gel electrophoresis and
tandem mass spectrometry. J Proteome Res 2005, 4:1742-1751.
36. Kakisaka T, Kondo T, Okano T, Fujii K, Honda K, Endo M, Tsuchida A, Aoki T,
Itoi T, Moriyasu F, et al: Plasma proteomics of pancreatic cancer patients
by multi-dimensional liquid chromatography and two-dimensional
difference gel electrophoresis (2D-DIGE): up-regulation of leucine-rich
alpha-2-glycoprotein in pancreatic cancer. J Chromatogr B Analyt Technol
Biomed Life Sci 2007, 852:257-267.
37. Okano T, Kondo T, Kakisaka T, Fujii K, Yamada M, Kato H, Nishimura T,
Gemma A, Kudoh S, Hirohashi S: Plasma proteomics of lung cancer by a
linkage of multi-dimensional liquid chromatography and two-
dimensional difference gel electrophoresis. Proteomics 2006, 6:3938-3948.
38. Zeng JW, Wang SX, Zhao XF, Wei MT, Tu ZG: [Utilizing 2-DE and MALDI-
TOF MS/MS to screen differentially expressed serum proteins of
silicosis]. Zhonghua Lao Dong Wei Sheng Zhi Ye Bing Za Zhi 2007,
25:136-141.
Andersen et al. Journal of Ovarian Research 2010, 3:21
/>Page 13 of 14
39. Faca VM, Ventura AP, Fitzgibbon MP, Pereira-Faca SR, Pitteri SJ, Green AE,
Ireton RC, Zhang Q, Wang H, O’Briant KC, et al: Proteomic analysis of
ovarian cancer cells reveals dynamic processes of protein secretion and
shedding of extra-cellular domains. PLoS ONE 2008, 3:e2425.
40. Gortzak-Uzan L, Ignatchenko A, Evangelou AI, Agochiya M, Brown KA, St
Onge P, Kireeva I, Schmitt-Ulms G, Brown TJ, Murphy J, et al: A proteome
resource of ovarian cancer ascites: integrated proteomic and
bioinformatic analyses to identify putative biomarkers. J Proteome Res
2008, 7:339-351.
41. Pan S, Cheng L, White JT, Lu W, Utleg AG, Yan X, Urban ND, Drescher CW,
Hood L, Lin B: Quantitative proteomics analysis integrated with
microarray data reveals that extracellular matrix proteins, catenins, and
p53 binding protein 1 are important for chemotherapy response in
ovarian cancers. Omics 2009, 13:345-354.
42. Lin B, White JT, Wu J, Lele S, Old LJ, Hood L, Odunsi K: Deep depletion of
abundant serum proteins reveals low-abundant proteins as potential
biomarkers for human ovarian cancer. Proteomics Clin Appl 2009,
3:853-861.
43. Sardana G, Jung K, Stephan C, Diamandis EP: Proteomic analysis of
conditioned media from the PC3, LNCaP, and 22Rv1 prostate cancer cell
lines: discovery and validation of candidate prostate cancer biomarkers.
J Proteome Res 2008, 7:3329-3338.
44. Sardana G, Marshall J, Diamandis EP: Discovery of candidate tumor
markers for prostate cancer via proteomic analysis of cell culture-
conditioned medium. Clin Chem 2007, 53:429-437.
45. Kulasingam V, Diamandis EP: Tissue culture-based breast cancer
biomarker discovery platform. Int J Cancer 2008, 123:2007-2012.
46. Ferrero S, Gillott DJ, Remorgida V, Anserini P, Ragni N, Grudzinskas JG:
Increased expression of one isoform of leucine-rich alpha-2-glycoprotein
in peritoneal fluid of women with uterine leiomyomas. Arch Gynecol
Obstet 2009, 279:365-371.
47. Ye B, Cramer DW, Skates SJ, Gygi SP, Pratomo V, Fu L, Horick NK,
Licklider LJ, Schorge JO, Berkowitz RS, Mok SC: Haptoglobin-alpha subunit
as potential serum biomarker in ovarian cancer: identification and
characterization using proteomic profiling and mass spectrometry. Clin
Cancer Res 2003, 9:2904-2911.
48. Hirokawa T, Boon-Chieng S, Mitaku S: SOSUI: classification and secondary
structure prediction system for membrane proteins. Bioinformatics 1998,
14:378-379.
49. An HJ, Lebrilla CB: A glycomics approach to the discovery of potential
cancer biomarkers. Methods Mol Biol 600:199-213.
50. Saldova R, Royle L, Radcliffe CM, Abd Hamid UM, Evans R, Arnold JN,
Banks RE, Hutson R, Harvey DJ, Antrobus R, et al: Ovarian cancer is
associated with changes in glycosylation in both acute-phase proteins
and IgG. Glycobiology 2007, 17:1344-1356.
51. Saldova R, Wormald MR, Dwek RA, Rudd PM: Glycosylation changes on
serum glycoproteins in ovarian cancer may contribute to disease
pathogenesis. Dis Markers 2008, 25:219-232.
52. Fujimura T, Shinohara Y, Tissot B, Pang PC, Kurogochi M, Saito S, Arai Y,
Sadilek M, Murayama K, Dell A, et al: Glycosylation status of haptoglobin
in sera of patients with prostate cancer vs. benign prostate disease or
normal subjects. Int J Cancer 2008, 122:39-49.
53. Casey RC, Oegema TR Jr, Skubitz KM, Pambuccian SE, Grindle SM,
Skubitz AP: Cell membrane glycosylation mediates the adhesion,
migration, and invasion of ovarian carcinoma cells. Clin Exp Metastasis
2003, 20:143-152.
doi:10.1186/1757-2215-3-21
Cite this article as: Andersen et al.: Leucine-rich alpha-2-glyco protein-1
is upregulated in sera and tumors of ovarian cancer patients. Journal of
Ovarian Research 2010 3:21.
Submit your next manuscript to BioMed Central
and take full advantage of:
• Convenient online submission
• Thorough peer review
• No space constraints or color figure charges
• Immediate publication on acceptance
• Inclusion in PubMed, CAS, Scopus and Google Scholar
• Research which is freely available for redistribution
Submit your manuscript at
www.biomedcentral.com/submit
Andersen et al. Journal of Ovarian Research 2010, 3:21
/>Page 14 of 14