United States Government Accountability Office GAO November 2010 Report to the Chairman, United States Securities and Exchange Commission|_part4 potx
Bạn đang xem bản rút gọn của tài liệu. Xem và tải ngay bản đầy đủ của tài liệu tại đây (309.93 KB, 10 trang )
Management’s Discussion and Analysis
Financial Highlights
This section provides key nancial information for FY 2010. It summarizes the SEC’s efforts to manage resources ef ciently and
responsibly while accomplishing the agency’s mission.
$0
$400
$800
$1,200
$1,600
FY 2009
Appropriation X0100
Appropriation 09/10 0100
A
pp
ro
p
riation X5567 Carr
y
-Over
(DOLLARS IN MILLIONS)
CHART 1.2
SPENDING AUTHORITY BY SOURCE
$66 $10
$894
$452
$1,095
General Fund Investor Protection Fund
FY 2010 FY 2009 FY 2010
$24
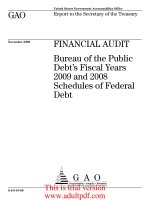
In FY 2010, the SEC’s total budgetary authority equaled
$1,571 million, a 62 percent increase over the FY 2009 level
of $970 million. The largest contributor of the increase is the
establishment of Investor Protection Fund authorized in Dodd-
Frank. The funding authority in FY 2010 included $1,095
million in offsetting collections (X0100), $452 million for the
Investor Protection Fund (X5567), and $24 million in carry-
over of unobligated balances and recoveries from prior-year
obligations. In FY 2009, the funding included $894 million in
offsetting collections (X0100), $10 million in a supplemental
appropriation (09/10 0100) issued by Congress to use for
investigating securities fraud, and $66 million in carry-over of
unobligated balances and recoveries from prior-year obliga-
tions. This is illustrated in Chart 1.2, Spending Authority by
Source.
The SEC employed a total of 3,748 FTE in FY 2010.
This represents an increase of 106 FTE over FY 2009.
The increase in FTE from FY 2009 to FY 2010 is due to the
increase in funding and the agency’s focus on hiring new staff
with the requisite skills and experience to further the SEC’s
mission.
NOTE: The Investor Protection Fund (X5567) was established in FY 2010.
The SEC has steadily reduced the “Unobligated Balance
Brought Forward, October 1” line of the Statement of
Budgetary Resources, as illustrated in Chart 1.3, Unobligated
Balance, Brought Forward. In FY 2010, of the $27 million
brought forward, $7.8 million was related to a $10 million
supplemental appropriation for investigations of securities
fraud.
$0
$50
$100
$150
$200
FY 2007 FY 2008 FY 2009 FY 2010
(DOLLARS IN MILLIONS)
CHART 1.3
UNOBLIGATED BALANCE, BROUGHT FORWARD
$187
$58
$90
$27
$
0
$
400
$800
$1,200
$1,600
FY 2
009
Appropriation X0100
A
ppropriation 09
/
10 0100
A
pp
ro
p
riation X5567
Ca
rr
y
-Ov
e
r
(DOLLARS IN MILLIONS
)
$6
6
$
1
0
$
894
$45
2
$
1,09
5
Ge
n
e
r
a
l F
u
n
d
Inv
es
t
o
r Pr
o
t
ec
t
io
n F
u
n
d
F
Y 2
0
1
0
FY 2
009
F
Y 2
0
1
0
$
2
4
NOTE: The Investor Protection Fund
(
X5567
)
was established in FY 2010
.
$
0
$
50
$100
$
150
$
200
F
Y 2
00
7 FY 2
008
F
Y 2
009
F
Y 2
0
1
0
(
DOLLARS IN MILLIONS
)
C
HA
R
T
1
.
3
UNOBLIGA
TED BALANCE,
A
A
BR
O
U
G
HT F
OR
W
A
R
D
$
187
$
58
$
90
$
2
7
21
FY 2010 PERFORMANCE AND ACCOUNTABILITY REPORT
MANAGEMENT’S DISCUSSION AND ANALYSIS
Page 27 GAO-11-202 SEC's Financial Statements for Fiscal Years 2010 and 2009
This is trial version
www.adultpdf.com
Management’s Discussion and Analysis
CHART 1.4
STATUS OF THE SUPPLEMENTAL FUND
(DOLLARS IN THOUSANDS)
Unobligated Funds
Obligations Undelivered
Obligations Delivered
$1,642
$8,251
$107
Of the $10 million supplemental appropriation, $107 thousand
remains unobligated as of September 30, 2010. This supple-
mental appropriation is also re ected on the “Unexpended
Appropriations – Other Funds” line of the Balance Sheet.
The status of funds for the supplemental appropriation is illus-
trated in Chart 1.4, Status of the Supplemental Fund.
$0.00
$6.00
$12.00
$18.00
$24.00
$30.00
FY 2009
Q1
FY 2009
Q2
FY 2009
Q3
FY 2009
Q4
FY 2010
Q1
FY 2010
Q2
FY 2010
Q3
FY 2010
Q4
(DOLLARS PER MILLION DOLLARS TRANSACTED)
CHART 1.5
SECTION 31 EXCHANGE FEE RATE
$5.60 $5.60
$25.70 $25.70 $25.70
$12.70
$16.90 $16.90
The Commission adjusts the rates (dollars per million
dollars transacted) for Section 31 transaction fees
periodically in accordance with the Investor and Capital
Markets Fee Relief Act of 2002. As shown in Chart 1.5,
Section 31 Exchange Fee Rate, the rst half of FY 2009,
the Section 31 Fee rate was $5.60. It was subsequently
increased to $25.70 for the second half of FY 2009
through the rst quarter of FY 2010. The rate was
then reduced to $12.70 on January 15, 2010, and then
increased to $16.90 on April 1, 2010.
The overall securities transactions volume subject to
Section 31 Fees was nearly unchanged between FY
2009 and FY 2010. However, the monthly volume
uctuations applied to the varying fee rates produced
average weighted fee rates of $14.34 and $18.33 for FY
2009 and FY 2010, respectively. As a result, there was
approximately a 26 percent increase in Section 31 Fee
revenues.
C
HAR
T1.
4
S
TA
TUS OF THE SUPPLEMENT
A
A
AL FUND
T
T
(DOLLARS IN THOUSANDS
)
S
U
nobli
g
ated Fund
s
Obli
g
ations Undelivered
Obli
g
ations Delivere
d
$
1,64
2
$
8,251
$
107
$
0.0
0
$
6.0
0
$
12.0
0
$
18.0
0
$
24.0
0
$
30.0
0
FY 200
9
Q
1
F
Y 200
9
Q
2
FY 200
9
Q3
F
Y 200
9
Q4
F
Y 201
0
Q
1
F
Y 201
0
Q2
F
Y 201
0
Q
3
F
Y 201
0
Q4
(
D
O
LLAR
S
PER MILLI
O
N D
O
LLAR
S
TRAN
S
A
C
TED
)
C
HAR
T1.
5
SECTION 31 EXCHANGE FEE RA
TE
A
A
$
5.60
$
5.6
0
$
25.7
0
$
25.70
$
25.70
$
12.7
0
$
16.9
0
$
16.90
22
FY 2010 PERFORMANCE AND ACCOUNTABILITY REPORT
MANAGEMENT’S DISCUSSION AND ANALYSIS
Page 28 GAO-11-202 SEC's Financial Statements for Fiscal Years 2010 and 2009
This is trial version
www.adultpdf.com
Management’s Discussion and Analysis
$0
$500
$1,000
$1,500
$2,000
Total Actual Offsetting Collections New Budgetary Authority
FY 2002 FY 2003 FY 2004 FY 2005 FY 2006 FY 2007 FY 2008 FY 2009 FY 2010
(DOLLARS IN MILLIONS)
CHART 1.6
OFFSETTING COLLECTIONS VS. NEW BUDGET AUTHORITY
SECTION 31 FEES AND FILING FEES
$
1,013
$
1,077
$
1,392
$
1,665
$
1,903
$
1,538
$
984
$
1,016
$
438
$
716
$
812
$
856
$
863
$
868
$
843
$
894
$
1,443
$
1,095
Chart 1.6, Offsetting Collections vs. New Budgetary
Authority
1
, presents the budget authority and offsetting
collections related to transactions fees and ling fees
from FYs 2002 through 2010. The sum of the offsetting
collections targets for Section 31 Fees and ling fees
in FY 2010 was $1,495 million. The actual offsetting
collections for FY 2010 was $1,443 million.
In FY 2010, there was a $273 million decrease to the
accounts receivable balance. The decrease was primarily
due to a $155 million increase in the Allowance for Loss
on Accounts Receivable for disgorgement and penalties.
Secondly, receivables for Section 31 Fees declined by $60
million, comprised of $48 million due to fee rate changes,
and $12 million due to adjustments from prior year fees
owed in FY 2009 that were paid in FY 2010. Finally, there
was a $58 million decrease in gross disgorgement and
penalties receivables.
1
The above chart only re ects offsetting collections related to fees collected on Section 31 securities transactions and Section 6(b), 13(e),
14(g), and 24f-2 lings and does not include reimbursable type collections and refunds as reported on the “Offsetting Collections” line of the
Statement of Budgetary Resources.
As of September 30, 2010, Total Assets decreased by $401
million compared to the September 30, 2009 balance, as
illustrated in Chart 1.7, Assets, Liabilities, and Net Position.
This decrease is primarily due to a $1,035 million decline in
Investments, stemming from the SEC’s continued efforts to
accelerate distributions to harmed investors. This decline
was offset by a $906 million increase in Fund Balance with
Treasury (FBWT), due largely to $452 million in funding for the
new Investor Protection Fund authorized by Dodd-Frank and
an increase of $348 million in ling fees and Section 31 fees.
The decrease of $1,213 million in Total Liabilities is mostly due
to distributions to harmed investors and a lower accounts
receivable balance.
The SEC does not record on its nancial statements any asset
amounts that another government entity such as a court, or a
non-governmental entity, such as a receiver, has collected or
will collect and will subsequently disburse.
$0
$2,000
$4,000
$6,000
$8,000
$10,000
Total Assets Total Liabilities Net Position
(DOLLARS IN MILLIONS)
CHART 1.7
ASSETS, LIABILITIES, AND NET POSITION
$8,563
$8,162
$6,068
$6,880
$2,495
$1,282
FY 2009 FY 2010
$0
$2,00
0
$4,00
0
$6,00
0
$8,00
0
$
10,00
0
T
otal
TT
A
sse
t
s
T
otal Liabilities
T
T
Ne
t P
osi
t
ion
(DOLLARS IN MILLIONS
)
S
CHART 1.7
ASSETS, LIABILITIES, AND NET POSITION
$
8
,
563
$8,162
$8 162
$
6
,
068
$
6,88
0
$
2
,
49
5
$
1,28
2
FY 2
009
FY 2
0
1
0
$
0
$
500
$1
,
000
$1
,500
$2,000
T
otal
T
T
A
ctual
O
ffsetting
C
ollection
s
N
ew
B
u
d
getar
y
A
ut
h
or
it
y
FY 2
00
2 FY 2
003
FY 2
004
FY 2
005
FY 2
006
FY 2
00
7 FY 2
008
FY 2
009
F
Y 2
0
1
0
(DOLLARS IN MILLIONS
)
S
C
HAR
T1.
6
O
FF
S
ETTIN
G
CO
LLE
C
TI
O
N
S
V
S
.
N
EW B
U
D
G
ET A
U
TH
O
RITY
S
E
C
TI
O
N
3
1 FEE
S
A
ND FILIN
G
FEE
S
$
1
,
013
$
1
,077
77
$
1
,
392
$
1
,66
5
$
1
,
90
3
$
1
,
5
38
$
98
4
$
1
,0
1
6
$
4
38
$
7
1
6
$
8
12
$
856
$
863
$
868
$
8
4
3
$
89
4
$
1
,
443
$
1
,
095
23
FY 2010 PERFORMANCE AND ACCOUNTABILITY REPORT
MANAGEMENT’S DISCUSSION AND ANALYSIS
Page 29 GAO-11-202 SEC's Financial Statements for Fiscal Years 2010 and 2009
This is trial version
www.adultpdf.com
Management’s Discussion and Analysis
Limitations of the Financial Statements
The principal nancial statements included in this report have
been prepared by SEC Management to report the nancial
position and results of operations of the SEC, pursuant to
the requirements of 31 U.S. Code Section 3515(b). While the
statements have been prepared from the books and records of
the SEC in accordance with GAAP for federal entities and the
formats prescribed by the Of ce of Management and Budget
(OMB), the statements are in addition to the nancial reports
used to monitor and control budgetary resources, which are
prepared from the same books and records. The statements
should be read with the understanding that they are for a
component of the U.S. Government, a sovereign entity.
The “Total Program Costs” line on the Statement of Net Cost
and the “Gross Outlays” line on the Statement of Budgetary
Resources increased primarily as a result of increases in salaries
and bene ts. In FY 2010, the SEC incurred costs resulting from
an increase in staf ng levels and cost of living adjustments.
The increase in the SEC’s salary and bene ts related costs is
evidenced in Chart 1.8, Expense Comparison.
$0
$200
$400
$600
$800
Salaries and
Benet Expenses
Other
Expenses
(DOLLARS IN MILLIONS)
CHART 1.8
EXPENSE COMPARISON
$689
$755
$292
$303
FY 2009 FY 2010
$0
$
20
0
$
40
0
$
60
0
$
80
0
S
alaries and
Bene
t Ex
p
enses
O
ther
Ex
p
enses
(
DOLLARS IN MILLIONS
)
C
HAR
T1.
8
EXPENSE COMP
ARISON
P
P
$
689
$
755
$
29
2
$
303
FY 2
009
F
Y 2
0
1
0
24
FY 2010 PERFORMANCE AND ACCOUNTABILITY REPORT
MANAGEMENT’S DISCUSSION AND ANALYSIS
Page 30 GAO-11-202 SEC's Financial Statements for Fiscal Years 2010 and 2009
This is trial version
www.adultpdf.com
Management’s Discussion and Analysis
Performance Highlights
This section provides key performance information for FY 2010. It outlines the SEC’s strategic and performance planning
framework and progress toward reaching planned performance targets. Additionally, this section includes a list of performance
indicators that provide useful information for understanding the agency’s activities.
Strategic and Performance Planning Framework
The FY 2010 strategic and performance planning framework
is based on the SEC’s new strategic plan covering FY 2010 –
FY 2015, available at www.sec.gov/about/secstratplan1015f.
pdf. This updated plan addresses the agency’s mission,
vision, values, and revised strategic goals. The plan further
details the outcomes the agency is seeking to achieve, the
strategies and initiatives that will be undertaken to accomplish
those outcomes, and the performance measures that will be
used to gauge the agency’s progress.
The SEC’s goals and priorities in the Strategic Plan are in u-
enced by a number of external environmental factors, including
the demands of ful lling the agency mission in complex and
global nancial markets and changes in legislation affecting
the agency. During the past two years, this environment has
changed dramatically. While the Strategic Plan attempts to
anticipate various ways in which markets, regulated industries,
and legislative underpinnings may transform over time, no plan
can anticipate all possible scenarios. Because the accompa-
nying performance measures were signi cantly revised in the
FY 2010 – FY 2015 strategic plan, there is limited prior year
performance information provided in this report.
The SEC’s work is structured around four strategic goals and
12 outcomes that gauge the SEC’s performance within each
strategic goal.
TABLE 1.2
Strategic Goals with
Resources Invested
Outcomes
Foster and enforce compliance with the
federal securities laws
Cost: $641.7 million
The SEC fosters compliance with the federal securities laws.
The SEC promptly detects violations of the federal securities laws.
The SEC prosecutes violations of federal securities laws and holds violators accountable.
Establish an effective regulatory
environment
Cost: $106.1 million
The SEC establishes and maintains a regulatory environment that promotes high-quality disclosure,
nancial reporting, and governance, and prevents abusive practices by registrants, nancial
intermediaries, and other market participants.
The U.S. capital markets operate in a fair, ef cient, transparent, and competitive manner, fostering
capital formation and useful innovation.
The SEC adopts and administers rules and regulations that enable market participants to understand
clearly their obligations under the securities laws.
Facilitate access to the information
investors need to make informed
investment decisions
Cost: $183.1 million
Investors have access to high-quality disclosure materials that are useful to investment decision
making.
Agency rulemaking and investor education programs are informed by an understanding of the wide
range of investor needs.
Enhance the Commission’s performance
through effective alignment and
management of human, information,
and nancial capital
Cost: $127.5 million
The SEC maintains a work environment that attracts, engages, and retains a technically pro cient
and diverse workforce that can excel and meet the dynamic challenges of market oversight.
The SEC retains a diverse team of world-class leaders who provide motivation and strategic direction
to the SEC workforce.
Information within and available to the SEC becomes a Commission-wide shared resource,
appropriately protected, that enables a collaborative and knowledge-based working environment.
Resource decisions and operations re ect sound nancial and risk management principles.
25
FY 2010 PERFORMANCE AND ACCOUNTABILITY REPORT
MANAGEMENT’S DISCUSSION AND ANALYSIS
Page 31 GAO-11-202 SEC's Financial Statements for Fiscal Years 2010 and 2009
This is trial version
www.adultpdf.com
Management’s Discussion and Analysis
Performance Measures Overview
To assess the SEC’s performance results against the Strategic
Plan’s established targets, a results rating methodology is
used to assign one of the following three performance ratings
for a given result:
Below Target On Target Above Target
Not Met Met Exceeded
The new strategic plan identi ed 51 performance measures.
Several of these performance measures track multiple
performance targets, and Chart 1.9, Summary of FY 2010
Performance Results shows the performance results for each
of the 70 performance targets. Twenty-seven of these targets
have not yet been established or FY 2010 data is not available
(categorized as not applicable (N/A)). As the agency re nes
its processes for collecting the information, targets will be
established and data will be reported.
Performance indicators, outlined in Table 1.4, Performance
Indicators Results Summary, do not include planned targets
because it would be inappropriate for the agency to conduct
certain activities with an eye towards meeting predetermined
targets. Therefore, results for performance indicators are not
included in Chart 1.9, Summary of FY 2010 Performance
Results.
SUMMARY OF FY 2010
PERFORMANCE RESULTS
10
2327
Exceeded
Met
Not Met
N/A
10
CHART 1.9
SU
MMAR
Y
O
F FY 2010
P
ERF
O
RMAN
C
E RE
SU
L
TS
10
23
2
7
E
x
ceeded
M
et
No
t M
e
t
N/
A
10
26
FY 2010 PERFORMANCE AND ACCOUNTABILITY REPORT
MANAGEMENT’S DISCUSSION AND ANALYSIS
Page 32 GAO-11-202 SEC's Financial Statements for Fiscal Years 2010 and 2009
This is trial version
www.adultpdf.com
Management’s Discussion and Analysis
Performance Results Summary
The SEC has established various performance measures for assessing program performance against strategic goals
and planned outcomes. For each performance measure, one or more performance targets have been established.
Table 1.3, Performance Measures Results Summary provides a summary of actual performance results during FY 2009 and
FY 2010 for each performance measure, and Table 1.4, Performance Indicators Results Summary provides a summary of
indicators by outcome within each strategic goal. A detailed discussion of the agency’s program achievements and performance
results is located in the Performance Section.
TABLE 1.3
PERFORMANCE MEASURES RESULTS SUMMARY
GOAL 1: Foster and Enforce Compliance with the Federal Securities Laws
OUTCOME 1.1: The SEC fosters compliance with the federal securities laws.
FY 2009
Actual
FY 2010
Target
FY 2010
Actual
FY 2010
Results
MEASURE 1: Number of new investor education materials designed speci cally
to help investors protect themselves from fraud
N/A N/A 16 N/A
MEASURE 2: Number of industry outreach and education programs targeted to
areas identi ed as raising particular compliance risks
N/A N/A 6 N/A
MEASURE 3: Percentage of rms receiving de ciency letters that take corrective
action in response to all exam ndings
94% 95% 90% Not Met
MEASURE 4: Percentage of attendees at CCOutreach that rated the program as
“Useful” or “Extremely Useful” in their compliance efforts
84% 92% 77% Not Met
OUTCOME 1.2: The SEC promptly detects violations of the federal securities laws.
FY 2009
Actual
FY 2010
Target
FY 2010
Actual
FY 2010
Results
MEASURE 5: Percentage of cause and special exams (sweeps) conducted as a
result of risk assessment process that includes multi-divisional input
N/A N/A N/A N/A
MEASURE 6:
Percentage of advisers deemed “high risk” examined during the year
22% 33% N/A N/A
MEASURE 7: Percentage of registrant population examined during the year:
Investment advisers 10% 9% 9% Met
Investment companies 29% 15% 10% Not Met
Broker-dealers (exams by SEC and SROs) 54% 55% 44% Not Met
MEASURE 8: Percentage of non-sweep and non-cause exams that are
concluded within 120 days
65% 75% 48% Not Met
OUTCOME 1.3: The SEC prosecutes violation of federal securities laws and holds
violators accountable.
FY 2009
Actual
FY 2010
Target
FY 2010
Actual
FY 2010
Results
MEASURE 9: Percentage of enforcement actions successfully resolved 92% 90% 92% Exceeded
MEASURE 10: Percentage of rst enforcement actions led within two years 70% 65% 67% Exceeded
MEASURE 11:
Percentage of debts where either a payment has been made or a
collection activity has been initiated within six months of the due date of the debt
90% 92% 86% Not Met
MEASURE 12: Percentage of Fair Fund and disgorgement fund plans that
distributed the nal tranche of funds to injured investors within 24 months of the
order appointing the fund administrator
N/A N/A N/A N/A
MEASURE 13: Percentage of Fair Fund and disgorgement fund plans approved
by nal order within the prior scal year which had a rst tranche of funds
distributed under those plans within 12 months of such approval date
N/A 60% N/A N/A
N/A – Signi es data does not currently exist or targets were not established
(Continued on next page)
27
FY 2010 PERFORMANCE AND ACCOUNTABILITY REPORT
MANAGEMENT’S DISCUSSION AND ANALYSIS
Page 33 GAO-11-202 SEC's Financial Statements for Fiscal Years 2010 and 2009
This is trial version
www.adultpdf.com
Management’s Discussion and Analysis
TABLE 1.3
Continued from previous page
PERFORMANCE MEASURES RESULTS SUMMARY (continued)
GOAL 2: Establish an Effective Regulatory Environment
OUTCOME 2.1: The SEC establishes and maintains a regulatory environment that
promotes high-quality disclosure, nancial reporting, and governance, and that
prevents abusive practices by registrants, nancial intermediaries, and other market
participants.
FY 2009
Actual
FY 2010
Target
FY 2010
Actual
FY 2010
Results
MEASURE 1: Survey on quality of disclosure
N/A N/A N/A N/A
MEASURE 2: Number of consultations; joint events, reports, or initiatives; and
joint examinations and other mutual supervisory efforts with SROs and other
federal, state, and non-U.S. regulators
N/A N/A N/A N/A
MEASURE 3: Number of non-U.S. regulators trained N/A 1,905 1,997 Exceeded
OUTCOME 2.2: The U.S. capital markets operate in a fair, ef cient, transparent, and
competitive manner, fostering capital formation and useful innovation.
FY 2009
Actual
FY 2010
Target
FY 2010
Actual
FY 2010
Results
MEASURE 4: Percentage of transaction dollars settled on time each year
99% 99% 99% Met
MEASURE 5: Average institutional transaction costs for exchange listed stocks on
a monthly basis
N/A N/A N/A N/A
MEASURE 6: Percentage of market outages at SROs and electronic
communications networks (ECNs) that are corrected within targeted timeframes:
Within 2 hours 87% 60% 74% Exceeded
Within 4 hours 98% 75% 85% Exceeded
Within 24 hours 98% 96% 100% Exceeded
OUTCOME 2.3: The SEC adopts and administers rules and regulations that enable
market participants to understand clearly their obligations under the securities laws.
FY 2009
Actual
FY 2010
Target
FY 2010
Actual
FY 2010
Results
MEASURE 7: Length of time to respond to written requests for no-action letters,
exemptive applications, and written interpretive requests
Trading and Markets – No-action letters, exemptive applications, and
written interpretive requests (combined gure)
70% 85% 91% Exceeded
Investment Management – No-action letters and interpretive requests 100% 75% 100% Exceeded
Investment Management – Exemptive applications 95% 80% 100% Exceeded
Corporation Finance – No-action letters and interpretive requests 85% 90% 97% Exceeded
Corporation Finance – Shareholder proposals 100% 100% 100% Met
MEASURE 8: Survey on whether SEC rules and regulations are clearly
understandable
N/A N/A N/A N/A
MEASURE 9: Time to complete SEC review of SRO rules that are subject
to SEC approval
Within 35 days N/A 40% 73% Exceeded
Within 45 days N/A 80% 99% Exceeded
N/A – Signi es data does not currently exist or targets were not established
(Continued on next page)
28
FY 2010 PERFORMANCE AND ACCOUNTABILITY REPORT
MANAGEMENT’S DISCUSSION AND ANALYSIS
Page 34 GAO-11-202 SEC's Financial Statements for Fiscal Years 2010 and 2009
This is trial version
www.adultpdf.com
Management’s Discussion and Analysis
TABLE 1.3
Continued from previous page
PERFORMANCE MEASURES RESULTS SUMMARY (continued)
GOAL 3: Facilitate Access to the Information Investors Need to Make Informed Investment Decisions
OUTCOME 3.1: Investors have access to high-quality disclosure materials that are
useful to investment decision making.
FY 2009
Actual
FY 2010
Target
FY 2010
Actual
FY 2010
Results
MEASURE 1: Percentage of public companies and investment companies with
disclosures reviewed each year
Corporations 40% 34% 44% Exceeded
Investment company portfolios 35% 33% 35% Exceeded
MEASURE 2: Time to issue initial comments on Securities Act lings
25.3 days <30 days 24.1 days Met
MEASURE 3: Percentage of investment company disclosure reviews for which
initial comments are completed within timeliness goals
Initial registration statements 95% 85% 93% Exceeded
Post-effective amendments 97% 90% 94% Exceeded
Preliminary proxy statements 99% 99% 99% Met
MEASURE 4: Point of sale “click-through rate” N/A N/A N/A N/A
MEASURE 5:
Access to broker-dealer and investment adviser background checks
BrokerCheck System N/A N/A N/A N/A
IAPD System N/A N/A N/A N/A
MEASURE 6: Investor demand for disclosures on municipal securities N/A N/A N/A N/A
MEASURE 7: Satisfaction index for disclosure process N/A N/A N/A N/A
OUTCOME 3.2: Agency rulemaking and investor education programs are informed by
an understanding of the wide range of investor needs.
FY 2009
Actual
FY 2010
Target
FY 2010
Actual
FY 2010
Results
MEASURE 8:
Number of investors reached, and number of in-person events with
speci cally targeted communities and organizations
Number of investors reached (in millions) N/A 17.3 17.8 Exceeded
Number of in-person events N/A 25 42 Exceeded
MEASURE 9: Number of investor educational initiatives organized and produced N/A 8 9 Exceeded
MEASURE 10:
Timeliness of responses to investor contacts
Closed within 7 days 70% 80% 72% Not Met
Closed within 30 days 90% 90% 93% Exceeded
MEASURE 11: Percentage of rules impacting investors that are presented in
alternate user-friendly formats
N/A 100% 100% Met
MEASURE 12: Customer satisfaction with usefulness of investor educational
programs and materials
N/A N/A N/A N/A
N/A – Signi es data does not currently exist or targets were not established
(Continued on next page)
29
FY 2010 PERFORMANCE AND ACCOUNTABILITY REPORT
MANAGEMENT’S DISCUSSION AND ANALYSIS
Page 35 GAO-11-202 SEC's Financial Statements for Fiscal Years 2010 and 2009
This is trial version
www.adultpdf.com
Management’s Discussion and Analysis
TABLE 1.3
Continued from previous page
PERFORMANCE MEASURES RESULTS SUMMARY (continued)
GOAL 4: Enhance the Commission’s Performance Through Effective Alignment and
Management of Human, Information, and Financial Capital
OUTCOME 4.1: The SEC maintains a work environment that attracts, engages, and
retains a technically pro cient and diverse workforce that can excel and meet the
dynamic challenges of market oversight.
FY 2009
Actual
FY 2010
Target
FY 2010
Actual
FY 2010
Results
MEASURE 1: Survey of employee engagement
N/A 65% 58% Not Met
MEASURE 2: Best Places to Work ranking
Ranked #11 Ranked #5 Ranked #24 Not Met
MEASURE 3: Turnover 3.70% <8% 5% Met
MEASURE 4: Expanding staff expertise N/A N/A N/A N/A
MEASURE 5: Size of competency gaps N/A 10% N/A N/A
MEASURE 6: Number of diversity-related partnerships/alliances N/A 1 2 Exceeded
MEASURE 7: Survey feedback on the quality of the SEC’s performance
management program
N/A 65% N/A N/A
OUTCOME 4.2: The SEC retains a diverse team of world-class leaders who provide
motivation and strategic direction to the SEC workforce.
FY 2009
Actual
FY 2010
Target
FY 2010
Actual
FY 2010
Results
MEASURE 8: Quality of hire
N/A 75% N/A N/A
MEASURE 9: Leadership competency gaps N/A 10% N/A N/A
MEASURE 10: Satisfaction with Leadership Development Program (5-point scale) N/A 4 4.46 Exceeded
OUTCOME 4.3: Information within and available to the SEC becomes a Commission-
wide shared resource, appropriately protected, that enables a collaborative and
knowledge-based working environment.
FY 2009
Actual
FY 2010
Target
FY 2010
Actual
FY 2010
Results
MEASURE 11: Percentage of SEC data sources accessible through a virtual
data warehouse, and milestones achieved towards the creation of a robust
information management program
N/A N/A N/A N/A
MEASURE 12: Deployment of document management and work ow tools
N/A
Enforcement
and
Examinations
Enforcement
and
Examinations
Met
MEASURE 13: Time to process evidentiary material for enforcement investigations N/A N/A N/A N/A
MEASURE 14: System availability
Systems availability N/A 99% 99.97% Exceeded
Percentage fail over within 4 hours N/A 100% N/A N/A
Systems virtualized N/A N/A 22% N/A
OUTCOME 4.4: Resource decisions and operations re ect sound nancial and risk
management principles.
FY 2009
Actual
FY 2010
Target
FY 2010
Actual
FY 2010
Results
MEASURE 15: Milestones achieved towards establishment of a robust data
management program
N/A
Administrative
data and
reporting
requirements
identi ed
N/A N/A
MEASURE 16: Financial Systems Integration
N/A 17% N/A N/A
MEASURE 17: Financial Audit Results
Unquali ed opinion Yes Yes Yes Met
Material weaknesses 1 0 2 Not Met
Signi cant de ciency 6 0 0 Met
N/A – Signi es data does not currently exist or targets were not established
30
FY 2010 PERFORMANCE AND ACCOUNTABILITY REPORT
MANAGEMENT’S DISCUSSION AND ANALYSIS
Page 36 GAO-11-202 SEC's Financial Statements for Fiscal Years 2010 and 2009
This is trial version
www.adultpdf.com