báo cáo hóa học:" The net cost of incorporating resistance testing into HIV/AIDS treatment in South Africa: a Markov model with primary data" pot
Bạn đang xem bản rút gọn của tài liệu. Xem và tải ngay bản đầy đủ của tài liệu tại đây (277.04 KB, 6 trang )
RESEARCH Open Access
The net cost of incorporating resistance testing
into HIV/AIDS treatment in South Africa: a Markov
model with primary data
Sydney Rosen
1,2,3*
, Lawrence Long
2,3
, Ian Sanne
2,3
, Wendy S Stevens
4,5
and Matthew P Fox
1,2,3,6
Abstract
Background: Current guidelines for providing antiretroviral therapy (ART) in South Africa’s public sector
programme call for switching patients from first-line to second-line treatment upon virologic failure as indicated by
two consecutive viral loads above 5000 copies/ml, but without laboratory evidence of viral resistance. We modelled
the net cost of adding resistance testing for patients with virological failure and retaining patients without
resistance on first-line therapy, rather than switching all failures to second-line therapy.
Methods: Costs were estimated for three scenarios: routine maintenance (standard care without resistance testing,
switch all failures to second line); resistance testing (resistance test for patients with failure, switch those with
resistance); and limited testing (resistance test for patients with failure in the first three years, switch those with
resistance). A Markov model was used to estimate the cost of each arm over five years after first line initiation.
Rates of treatment failure, viral resistance and treatment costs were estimated with primary data from a large HIV
treatment cohort at a public facility in Johannesburg. Futu re costs were discounted at 3%.
Results: Virological failure rates over five years were 19.8% in routine maintenance and 20.2% in resistance testing
and limited testing; 16.8% and 11.4% of failures in routine and limited testing, respectively, did not have any
resistance mutations, resulting in 3.1% and 2.0% fewer patients switching to second-line ART by the end of five
years. Treatment costs were estimated at US$526 and $1268 per patient per year on first-line and second-line
therapy, respectively; a resistance test cost $242. The total average cost per patient over five years was $2780 in
routine maintenance; $2775 in resistance testing; and $2763 in limited testing.
Conclusions: Incorporating resistance testing into treatment guidelines in South Africa is potentially cost-neutral
and can identify other reasons for failure, conserve treatment options, and generate information about emerging
resistance patterns.
Background
Research in South Africa suggests that a sizable minority
of HIV/AIDS patients on antiretroviral therapy (ART)
with detectable viral loads remain susceptible to first-
line antiretroviral drugs , and are thus apparently failing
treatment without evidence of drug resistance. In three
cohort studies of adult patients receiving standard ART
in KwaZulu-Natal and Gauteng provinces [1-3], 16.5%,
16.8% and 21.7% of patients with virological failure had
no major resistance mutations, respectively.
South Africa’ s guidelines for adult ART call for
patients to be swit ched from first-line to second-line
therapy following virological failure [4]. Resistance test-
ing is not mentioned in the guidelines and is not done
in routine public sector care. Switching patients to sec-
ond-line therapy when they are failing virologically but
are not resistant to first-line drugs, however, is not likely
to improve these patients’ outcomes. It also prematurely
restricts their future treatment options, while incurring
the unnecessary cost of expensive second-line drugs. A
recent analysis of the cost of second-line therapy in
South Af rica estimated that it is 2.4 times more expen-
sive than first-line therapy per year in care [5].
* Correspondence:
1
Center for Global Health & Development, Boston University, Boston, MA,
USA
Full list of author information is available at the end of the article
Rosen et al. Journal of the International AIDS Society 2011, 14:24
/>© 2011 Rosen et al; licensee BioMed Central Ltd. This is an Open Acces s article distribu ted under the terms of the Creative Common s
Attribution License ( which permits unrestricted use, distribution, and reproduction in
any medium, provided the original work is properly cited.
We hypothesized that despite the relatively high cost
of performing resistance assays, resistance testing for
patients with detectab le viral loads could prove t o be
cost-neutral or even cost-saving for the South African
treatment programme if patients who do not have resis-
tance are maintained on first-line drugs, rather than
being switched to the more expensive second-line regi-
men. The objective of this analysis was to model the
net cost of such a strategy, using data from a large pub-
lic sector treatment facility in Johannesburg.
Methods
Model
We developed a state-transition decision (Markov)
model to estimate the costs of three strategies for
switching patients from first- to second-line ART over
the first five years a fter ART initiation under the
national treatment guidelines in effect from 2004 to
2010 [4]. These guidelines were used because all model
parameters are based on patient data accrued prior to
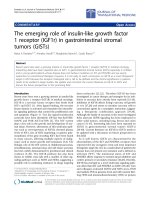
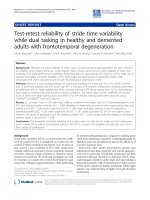
2010. The decision model, which was programmed in
TreeAge Pro 2009 (TreeAge Software Inc., Williams-
town, MA), is illustrated in Figure 1.
A hypothetical cohort of patients move through the
model in six-month cycles, beginning with first-line
ART initiation and continuing for a total of five years of
follow up. A cycle length of six months was selected
because routine viral load testing was performed every
six months under the prevailing treatment guidelines. At
the end of each cycle, a viral load test is done for all
patients and a second confirmatory test for those whose
first result is detectable (>1000 copie s/ml). In the rou-
tine monitoring (RM) strategy, which reflects standard
practice at the study site, all confirmed virologic failures
are automatically switched to second-line therapy. In the
resistance testing (RT) strategy, resistance testing is con-
ducted at the end of the cycle for virological failures,
and only patients with resistance to first-line drugs are
switched to second-line therapy.
Fin ally, we hypothesized that the probability of failing
virologically but not having resistance is greater during
apatient’ s earlier years on ART and declines in later
years. We therefore estimated the costs of a limited test-
ing (LT) strategy, in which those with confirmed virolo-
gical failure any time in their first three years on ART
have a resistance test at the end of the cycle in which
their second consecutive detectable viral load occurs
andaremanagedasintheRTstrategy,whilethoseon
ART longer than three years at the time of confirmed
failure are managed as in the RM strategy.
In all scenarios, patients switched to second line
remain on second line for the rest of the study period;
patients still on first line at t he end of each c ycle con-
tinue to face cycle-specific probabilities of virologic fail-
ure in each remaining cycle. All patients remain alive
and on either first- or second-line treatment at the end
of the five-year modelling period.
Study site
Modelling parameters for the study were estimated from
the Themba Lethu Clinical Cohort, a population of
approxim ately 10,000 adult ART patients at a previously
described [6] public sector clinic in Johannesburg. Stan-
dard first-line therapy under the national treatment
guidelines in effect until 2010 included stavudine or
zidovudine (AZT), lamivudine, and efavirenz or
R
es
i
stant
Second lin
e
Not resistant
First line
Detectable
Undetectable
First line
Routine viral load testFirst line
Second line
RT strategy
Detectable
Second line
Undetectable
First line
Routine viral load testFirst line
Second line
RM strategy
No resistance test years 4-5
Second lin
e
Resistant
Second lin
e
Not resistant
First line
Detectable
Undetectable
First line
Routine viral load testFirst line
Second line
LT strategy
Initiate ART
Figure 1 Structure of decision model used in analysis.
Rosen et al. Journal of the International AIDS Society 2011, 14:24
/>Page 2 of 6
nevirapine. Standard second-line therapy was AZT,
didanosine, and lopinavir/ritonavir (LPV/r) [4]. Unlike
in many other resource-constrained countries, monitor-
ing of viral load is routine in South Africa and was
called for every six months. Patients were switched to
second-line t herapy if viral load remained detectable in
a consecutive, confirmatory test.
Data
Rates of virological failure and non-resistance were esti-
mated from the study site. Using the site’ selectronic
medical record database (Therapy Edge™), the probabil-
ity of virological failure per six-month interval on treat-
ment was calculated for the first six intervals (three
years) after first-line ART initiation, conditional on
remaining alive and on ART at the site. The rate of vir-
ological failure in the last interval (months 25-36 on
ART) was also applied to each six-month interval in
years four and five of the model, as there were too few
patients with this duration of follow up in the dataset to
allow these values to be estimate d from the treatment
cohort. At this site, a threshold of 1000 copies/ml was
used to define failure, and confirmatory viral load tests
were done at intervals ranging from two weeks to sev-
eral months after the first detectable result.
In a previously published study presenting pooled data
from our stu dy site and another la rge public sector
treatment facility in Johannesburg, 16.8% of patients
with two consecutive detectable viral loads were found
to have no known mutation s [2]. Time on ART prior to
virological failure was not reported. We obtained m ost
of the original data from our study site and re-estimated
the rate of non-resistance over the first five years on
ART. Our re-estimation generated a cumulative non-
resistance proportion for the patients in our sample of
17.4%, close to the 16.8% value published for the two
Johannesburg sites together. Because of very small sam-
ple sizes within each six-month interval on ART, we
applied the cumulative rate to each interval, rather than
varying it by interval. For the LT s cenario, we used the
same method to estimate the proportion non-resistant
over the first three years on ART only.
Estimates of the annual unit costs of first- and second-
linetherapyweredrawnfromapublishedstudycon-
ducted at the same site [5]. These estimates include
ARVs, other drugs, laboratory tests, outpatient visits, and
outpatient clinic fixed costs and infrastructure. Inpatient
care is excluded. The cost of a resistance assay and viral
load test was provided by the National Health Laboratory
Service (authors’ data). All costs are shown in US dollars
after applying the 2008 average exchange rate of 8.28
South African rands to one US dollar [5]. An annual dis-
count rate of 3.0% was applied to future costs.
Sensitivity analysis
To examine the sensitivity of our results to uncertainty in
the model transition probabilities (rates of virological fail-
ure and non-resistance among failures), we conducted a
probabilistic sensitivity analysis (Monte Carlo simulation)
using beta distributions for the cycle-specific virologi cal
failure rates and the cumulative non-resistance rate. Beta
distributions were created with the alpha parameter equal
to the total sample size minus the number of events
observed and the beta parameter equal to the number of
events. We then used the 2.5
th
and 97.5
th
percentile of
the simulated distributionstocreate95%simulation
(uncertainty) intervals (SIs) for our point estimates.
In addition, we conducted a series of one-way sensitiv-
ity analyses for the three main cost inputs to the model:
the cost of a year of first-line treatment; the cost of a
year of se cond-line treatment; an d the cost of a resis-
tance assay. For the treatment costs, we considered the
impact of increasing or decreasing the cost per year by
20%. For the cost of a resistance test, which may vary
more widely from setting to setting, we considered a
cost increase or decrease of 50%.
Access to anonymized patient-level data was approved
by the Institutional Review Boards of Boston University
and the University of the Witwatersrand.
Results
Parameter values
Data for 8500 patients from the Themba Lethu Clinical
Cohort were included in the analysis of virological fail-
ure rates. Overall, 8.4% of patients in the sample had
two consecutive detectable viral loads. The proportions
of first-line patients with virological failure per six-
month interval on ART are shown in Table 1. After the
first six months on treatment, failure rates averaged 2%
to 3% per cycle.
Table 1 Virological failure and non-resistance rates used
in the analysis
Parameter n Value (95% CI)
Virological failure rates
(2 consecutive tests >1000
copies/ml)
6 months 8500 0.92% (0.71%-1.12%)
12 months 6979 2.99% (2.59%-3.39%)
18 months 5782 2.77% (2.34%-3.19%)
24 months 4672 2.35% (1.92%-2.79%)
30 months 5094 2.00% (1.62%-2.39%)
36 months and
remaining six-month
intervals
3569 2.16% (1.68%-2.63%)
Non-resistance rate among
virological failures
109 17.4% (10.31-24.55%)
Rosen et al. Journal of the International AIDS Society 2011, 14:24
/>Page 3 of 6
Resistance test results, as defined by Wallis et al [2],
and time on ART were available for 109 patients with
virological failure. Most (n = 98, 90%) had been on ART
for six to 3 6 months at t he time of testing, but a few
(n = 2, 2%) were in their first six months of therapy and
the rest (n = 9, 8%) had initiated treatment 36 to 60
months before. Of the 109 with virological failure, a
total of 19 (17.4%) did not have any major resistance
mutations. Most of these (74%) experienced virological
failure between 18 and 36 months on ART. No
instances of non-resistance were found among patients
on ART for more than 42 months, though the sample
size for this duration on treatment was very small.
Table 2 indicates the cost and other input parameters
used in the analysis. Second-line therapy costs nearly
two-and-a-half times that of first-line therapy, as men-
tioned, while a resistance test costs the equivalent of
nearly half a year of first-line therapy.
Model output
Table 3 reports the cumulative proportions of virological
failure, non-resistance and second-line t reatment at the
end of the five-year modelling period for each scenario.
In the routine monitoring (RM) scenario, 19.8% of
patients on first-line therapy fail virologically during
their first five years and are switched to second-line
therapy. In the resistance testing (RT) and limited test-
ing (LT) scenarios, slightly more (20.2%) patients fail
virologically, with the extra 0.4% failures reflecting that
fewer patients are switched to second-line therapy each
cycle. These patients are still on first-line therapy at the
end of the cycle and thus r emain in the exposure pool
for first-line failure in the following cycle. The cumula-
tive number failing by the end of five years is thus
slightly higher.
In the RT scenario, 16.8% of the failures do not have
any mutations and are kept on first-line treatment,
resulting in a somewhat smaller proportion (16.7%) of
the original cohort ending up on second-line therapy by
the end of five years. In the LT strategy, in which resis-
tance testing is done only if the patient with virological
failure started ART three years or less before, 17.8% of
patients are switched to second line.
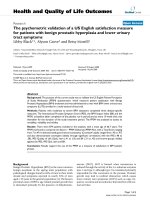
Cost estimates from the baseline analysis and sensitiv-
ity analyses are shown in Figure 2. In the RM scenario,
the total average cost per patient over the fiv e-year per-
iod is $2780 ($556/year) (95% SI $2761-2800). The total
average cost per patient for the RT scenario is $2775
($555/year) (95% SI $2755-2795), almost identic al to
that of the RM scenario. In the LT scenario, the to tal
average cost per patient over five years is $2763 ($553/
year) (95% SI $2743-2783), slightly less than the cost of
the other scenarios.
Using the baseline cost v alues, the total costs of all
three scenarios are almost the same. The sensitivity ana-
lysis illustrated in Figure 2 shows that the baseline
findings change little in response to the modelled
changes in unit costs. The LT strategy remains very
slightly less expensive than the other strategies across
all changes in cost parameters. The cost of the LT
strategy is nearly identical to that of the RM strategy i f
the cost of second-line therapy falls or the cost of a
resistance test increases, however. The ranking of the
full RT strategy and the RM strategy is sensitive to the
cost parameter values, but the differences between
them remain modest in magnitude.
Discussion
Using recent parameter estimates from a large South
African public sector treatment site, a strategy that
incorporates resistance testing into decisions on whether
to switch patients with first-line virologic failure to sec-
ond-line therapy is potentially cost neutral. It helps
identify patients failing for reasons other than viral resis-
tance; it conserves future treatment options for these
patients and spares them the additional toxicity burden
of second-line drugs; and it generates better information
about emerging drug-resistance patterns.
The analysis presented here has a number of limita-
tions. It is based on patient-level data from a single
treatment site, which may not be representative of all
sites in South Africa, and estimates parameters under
treatment guidelines that have since been revised. Rates
of non-resistance among virological failures by duration
on ART are based on very small patient numbers and
drawn from a single-site sample that may or may not be
representative of all patients failing virologically. Due to
data limitations, we were not able to take into account
variation in t he timing of viral load tests relative to the
Table 2 Cost parameters used in the analysis
Parameter Value Lower value for
sensitivity
analysis
Upper value for
sensitivity
analysis
Unit costs (2008) USD
First-line ART per
patient per year
$526* $421 $631
Second-line ART
per patient per
year
$1268* $1014 $1522
Resistance test $241.55
†
$120.78 $362.33
Viral load test $36.23
†
n.a. n.a.
Discount rate applied
to future costs
(annual)
3.0%
Exchange rate
(Rand/$)
8.28
‡
*Long et al, 2010 [5]
†
Authors’ data from National Health Laboratory Service, South Africa
‡
Exchange rate taken from source [5]; average daily exchange rate in 2008
Rosen et al. Journal of the International AIDS Society 2011, 14:24
/>Page 4 of 6
emergence of resistance or the possibility that the per-
centage of virologic failures that occur without resis-
tance may vary by sub-population.
Mortality and loss to follow up are also not taken
into account. Treatment cost estimates reflect drug
choices and prices in eff ect at the time of the analysis;
drug prices vary widely and change frequently; and a
substantial alteration in the relative costs of first- and
second-line therapy could have a large impact on
model results. The cost of performing a resistance test
may also change with technological advances and
laboratory s cale.
Conclusions
Despite its limitations, this analysis suggests that the net
cost of incorporating resistance testing into treatment
guidelines would not be prohibitive, and it provides a
model for examining this cost under different input
assumptions and treatment strategies. In countries that
use viral loads to guide treatment decisions and have
the capacity to conduct resistance testing at a cost simi-
lar to that cited here, incorporating it into treatment
guidelines should be considered, and a follow-on analy-
sis assessing the net benefits of this strategy, as well as
its net costs, should be undertaken.
ΨϮϰϬϬ
ΨϮϲϬϬ
ΨϮϴϬϬ
ΨϯϬϬϬ
ΨϯϮϬϬ
ΨϯϰϬϬ
Ğ
ƌƉĂƚŝĞŶƚŽǀĞƌĨŝǀĞLJĞĂƌƐĂĨƚĞƌƚƌĞĂƚŵĞŶƚŝŶŝƚŝĂƚŝŽŶ
ĂƐĞůŝŶĞĐŽƐƚƐ
&ŝƌƐƚͲůŝŶĞ
ƚƌĞĂƚŵĞŶƚϮϬй
ůŽǁĞƌ
&ŝƌƐƚͲůŝŶĞ
ƚƌĞĂƚŵĞŶƚϮϬй
ŚŝŐŚĞƌ
^ĞĐŽŶĚͲůŝŶĞ
ƚƌĞĂƚŵĞŶƚϮϬй
ůŽǁĞƌ
^ĞĐŽŶĚͲůŝŶĞ
ƚƌĞĂƚŵĞŶƚϮϬй
ŚŝŐŚĞƌ
ZĞƐŝƐƚĂŶĐĞĂƐƐĂLJ
ϱϬйůŽǁĞƌ
ZĞƐŝƐƚĂŶĐĞĂƐƐĂLJ
ϱϬйŚŝŐŚĞƌ
ZŽƵƚŝŶĞŵŽŶŝƚŽƌŝŶŐ;ZDͿ
ϮϳϴϬ ϮϯϯϮ ϯϮϮϴ Ϯϲϳϰ Ϯϴϴϲ ϮϳϴϬ ϮϳϴϬ
ZĞƐŝƐƚĂŶĐĞƚĞƐƚŝŶŐ;ZdͿ
Ϯϳϳϱ ϮϯϮϬ ϯϮϯϬ Ϯϲϴϲ Ϯϴϲϯ ϮϳϱϮ Ϯϳϵϴ
>ŝŵŝƚĞĚƚĞƐƚŝŶŐ;>dͿ
Ϯϳϲϯ ϮϯϬϵ ϯϮϭϳ Ϯϲϳϯ Ϯϴϱϯ Ϯϳϰϴ Ϯϳϳϴ
ΨϮϬϬϬ
ΨϮϮϬϬ
ŽƐƚƉ
Ğ
ZŽƵƚŝŶĞŵŽŶŝƚŽƌŝŶŐ;ZDͿ ZĞƐŝƐƚĂŶĐĞƚĞƐƚŝŶŐ;ZdͿ >ŝŵŝƚĞĚƚĞƐƚŝŶŐ;>dͿ
Figure 2 Results of baseline and sensitivity cost analyses.
Table 3 Proportions with virological failure, non-resistance, and second line switch, by strategy (1000-patient Markov
cohort analysis)
Strategy Proportion of cohort with
virological failure
Proportion of virological failures
identified as non-resistant
Proportion of cohort switched to
second-line therapy
Routine monitoring (RM) 19.8% 0.0% 19.8%
Resistance testing (RT) 20.2% 16.8% 16.7%
Limited testing (LT) 20.2% 11.4% 17.8%
Rosen et al. Journal of the International AIDS Society 2011, 14:24
/>Page 5 of 6
Acknowledgements
Funding for this paper was provided by the U.S. Agency for International
Development (USAID) under the terms of Associate Cooperative Agreement
No. 674-A-00-09-00018-00 under Country Research Activity Leader Award
No. GHS-A-00-03-00020 and by Award K01AI083097 from the National
Institute of Allergy and Infectious Diseases of the U.S. National Institutes of
Health. We thank Carole Wallis for analysis of the resistance samples at
Themba Lethu Clinic and Ziad El-Khatib for his helpful comments on the
manuscript. The content and views expressed here are solely the
responsibility of the authors and do not necessarily represent the official
views of the National Institute of Allergy and Infectious Diseases, USAID or
other parties.
Author details
1
Center for Global Health & Development, Boston University, Boston, MA,
USA.
2
Health Economics and Epidemiology Research Office, Wits Health
Consortium, Johannesburg, South Africa.
3
Faculty of Health Sciences,
University of the Witwatersrand, Johannesburg, South Africa.
4
Department of
Molecular Medicine and Haematology, University of the Witwatersrand,
Johannesburg, South Africa.
5
National Health Laboratory Services,
Johannesburg, South Africa.
6
Department of Epidemiology, Boston University
School of Public Health, Boston, MA, USA.
Authors’ contributions
SR, MF, IS and WS conceived of the analysis. SR designed the model,
performed the analysis, and drafted the manuscript. LL and MF estimated
the parameters. IS provided the data. All authors read, commented on and
approved the final manuscript.
Competing interests
The authors declare that they have no competing interests.
Received: 16 August 2010 Accepted: 15 May 2011
Published: 15 May 2011
References
1. Marconi VC, Sunpath H, Lu Z, Gordon M, Koranteng-Apeagyei K,
Hampton J, Carpenter S, Giddy J, Ross D, Holst H, Losina E, Walker BD,
Kuritzkes DR, South Africa Resistance Cohort Study Team: Prevalence of
HIV-1 drug resistance after failure of a first highly active antiretroviral
therapy regimen in KwaZulu Natal, South Africa. Clin Infect Dis 2008,
46:1589-1597.
2. Wallis CL, Mellors JW, Venter WD, Sanne I, Stevens W: Varied patterns of
HIV-1 drug resistance on failing first-line antiretroviral therapy in South
Africa. J Acquir Immune Defic Syndr 2010, 53:480-484.
3. El Khatib Z, Ekstrom AM, Ledwaba J, Mohapi L, Laher F, Karstaedt A,
Charalambous S, Petzold M, Katzenstein D, Morris L: Viremia and drug
resistance among HIV-1 patients on antiretroviral treatment: a cross-
sectional study in Soweto, South Africa. AIDS 2010, 24:1679-1687.
4. South Africa Department of Health: National Antiretroviral Treatment
Guidelines Pretoria, National Department of Health; 2004.
5. Long L, Fox M, Sanne I, Rosen S: The high cost of second-line
antiretroviral therapy for HIV/AIDS in South Africa. AIDS 2010, 24:915-919.
6. Fox MP, Brennan A, Maskew M, MacPhail P, Sanne I: Using vital
registration data to update mortality among patients lost to follow-up
from ART programmes: evidence from the Themba Lethu Clinic, South
Africa. Trop Med Int Health 2010, 15:405-413.
doi:10.1186/1758-2652-14-24
Cite this article as: Rosen et al.: The net cost of incorporating resistance
testing into HIV/AIDS treatment in South Africa: a Markov model with
primary data. Journal of the International AIDS Society 2011 14:24.
Submit your next manuscript to BioMed Central
and take full advantage of:
• Convenient online submission
• Thorough peer review
• No space constraints or color figure charges
• Immediate publication on acceptance
• Inclusion in PubMed, CAS, Scopus and Google Scholar
• Research which is freely available for redistribution
Submit your manuscript at
www.biomedcentral.com/submit
Rosen et al. Journal of the International AIDS Society 2011, 14:24
/>Page 6 of 6