báo cáo hóa học:" The reliability, validity and responsiveness of the Restless Legs Syndrome Quality of Life questionnaire (RLSQoL) in a trial population" potx
Bạn đang xem bản rút gọn của tài liệu. Xem và tải ngay bản đầy đủ của tài liệu tại đây (310.42 KB, 11 trang )
BioMed Central
Page 1 of 11
(page number not for citation purposes)
Health and Quality of Life Outcomes
Open Access
Research
The reliability, validity and responsiveness of the Restless Legs
Syndrome Quality of Life questionnaire (RLSQoL) in a trial
population
Linda Abetz*
1
, Robert Arbuckle
1
, Richard P Allen
2
, Elena Mavraki
3
and
Jeffrey Kirsch
3
Address:
1
Mapi Values, Adelphi Mill, Bollington, Macclesfield, SK10 5JB, UK,
2
Johns Hopkins Bayview Medical Center, Neurology and Sleep
Medicine, Asthma and Allergy Building 1B46b, 5501 Hopkins Bayview Circle, Baltimore, MD 21224, USA and
3
GlaxoSmithKline, Greenford Road,
Greenford, Middlesex, UB6 0HE, UK
Email: Linda Abetz* - ; Robert Arbuckle - ; Richard P Allen - ;
Elena Mavraki - ; Jeffrey Kirsch -
* Corresponding author
Abstract
Background: The aim of this study was to determine the reliability, validity and responsiveness of
the Restless Legs Syndrome Quality of Life questionnaire (RLSQoL) in a clinical trial setting.
Methods: Two matching, placebo-controlled, multinational studies assessing the effectiveness and
safety of ropinirole for treating moderate-to-severe Restless Legs Syndrome (RLS) formed the
basis of this psychometric assessment. Validity and reliability were assessed using baseline data.
Responsiveness was determined using longitudinal data collected at baseline and 12 weeks.
Results: A total of 547 subjects formed the baseline validation population; 519 were used for
assessing responsiveness (n = 284/263 and 271/248 for both studies, respectively). Construct
validity assessment confirmed that an overall life impact score could be calculated. All item-scale
correlations were = 0.4, except items 1 (r = 0.36) and 5 (r = 0.35) in one study. Floor and ceiling
effects were minimal. Cronbach's alpha values were 0.82 and 0.87, respectively, confirming internal
consistency reliability. Correlations with the International Restless Legs Syndrome Study Group's
severity rating scale (International Restless Legs Scale; IRLS) were moderate (r = -0.68 and -0.67,
respectively; p < 0.0001). The RLSQoL was able to discriminate between levels of sleep problems
(p < 0.0001) and between levels of global health status determined by a Clinical Global Impression
of severity (CGI-S) (p < 0.0001). Responsiveness was demonstrated by significant differences in
overall life impact change scores between CGI improvement levels after 12 weeks (p < 0.0001).
Conclusion: The RLSQoL is a valid, reliable and responsive measure of quality of life for patients
with RLS, in a clinical trial setting where group comparisons are anticipated.
Background
Restless Legs Syndrome (RLS) is a debilitating neurologi-
cal disorder characterized by a strong urge to move the
limbs, usually accompanied by unpleasant sensations,
such as creeping, crawling, tingling or pain, particularly
when the person lies down or sits for prolonged periods.
Published: 05 December 2005
Health and Quality of Life Outcomes 2005, 3:79 doi:10.1186/1477-7525-3-79
Received: 24 June 2005
Accepted: 05 December 2005
This article is available from: />© 2005 Abetz et al; licensee BioMed Central Ltd.
This is an Open Access article distributed under the terms of the Creative Commons Attribution License ( />),
which permits unrestricted use, distribution, and reproduction in any medium, provided the original work is properly cited.
Health and Quality of Life Outcomes 2005, 3:79 />Page 2 of 11
(page number not for citation purposes)
In most patients, these sensations are felt in the legs, but
they may also occur in the arms or trunk [1]. Both the urge
to move and these sensations represent the primary symp-
toms of RLS. Movement brings almost immediate but var-
iable relief from the symptoms, and this relief is
maintained as long as the movement continues. If
patients ignore the urge to move their legs, there may be
intensification of the symptoms until the urge is satisfied,
either voluntarily or involuntarily [2]. As a result, RLS can
have serious adverse effects on sleep, leaving patients with
reduced sleep time and daytime fatigue, reduced concen-
tration and decreased motivation, which in some cases
can lead to depression and anxiety [3,4].
The prevalence of RLS in the general population has been
reported to range from 5% to 10% [5] with an increasing
prevalence with age, and a somewhat higher rate in
women than in men [2,6]. There is often a family history
of RLS, particularly among patients who present with RLS
before 45 years of age [7]. However, primary RLS is a rec-
ognized condition that tends to co-occur in the same fam-
ily. Recently, possible genetic linkages have been
established [8-10]. Secondary RLS has been reported to
occur in association with a number of conditions, includ-
ing pregnancy, end-stage renal failure and iron-deficiency
anemia [2]. There are also a number of differential diag-
noses to be excluded, including leg cramps or paraesthe-
sias, and hypotensive akathisia.
A number of agents are used for the treatment of patients
with RLS, including dopaminergic agents and opiates, and
treatment varies according to symptom severity and fre-
quency, and the presence or absence of painful symp-
toms. Although treatments may relieve some or all of the
symptoms of RLS, Trenkwalder and colleagues [11]
reported that they can also be associated with side effects,
including increased symptom severity (augmentation) in
the long term. Both the disorder and its treatment may,
therefore, have an impact on patients' quality of life. For
this reason, the Restless Legs Syndrome Quality of Life
questionnaire (RLSQoL), a patient-reported measure of
quality of life specific to patients with RLS, was developed.
The RLSQoL has been previously validated in an inde-
pendent study [12]. Results from that study indicated the
reliability and validity of the RLSQoL. However, the study
was limited by its relatively small sample size and by the
lack of a full assessment of the responsiveness of the
RLSQoL to change over time (all subjects maintained their
normal treatment regimen throughout the 2-week study,
yielding few changes). The aim of the present study, there-
fore, was to assess the reliability, validity and responsive-
ness of the RLSQoL in a larger sample size, over a longer
period of time (12 weeks) and with treatment interven-
tion. Thus, this study is based on the patient populations
of two recently completed, matching, phase-III, multicen-
tre, randomized, double-blind, placebo-controlled stud-
ies assessing the efficacy and tolerability of ropinirole, a
dopamine agonist, for the treatment of patients with RLS
(Therapy with Ropinirole: Efficacy And Tolerability in RLS
[TREAT RLS] 1 and 2). Findings from both studies have
been published in full elsewhere [11,13].
The primary endpoint in both studies was change in total
score of the International Restless Legs Syndrome Study
Group's severity rating scale (International Restless Legs
Scale, IRLS) [14,15], a clinician-administered report of
patient symptom severity. However, the RLSQoL was
included as a secondary endpoint. Although the findings
of the two separate trials are being presented together in
this paper, it should be noted that the analysis for each
study was conducted separately.
Methods
Patient populations
Patients were eligible for inclusion in TREAT RLS 1 and 2
if they were at least 18 years of age, had a baseline IRLS
total score of ≥ 15 (on a scale of 0 to 40, indicating mod-
erate-to-severe RLS) and had moderate-to-severe fre-
quency of RLS (experienced at least 15 nights with
symptoms of RLS in the previous month or, if receiving
treatment, had symptoms of this frequency prior to treat-
ment). Patients were excluded from the study if they had
any other movement or primary sleep disorder, if they
required daytime treatment for RLS, if they were experi-
encing augmentation or end-of-dose rebound, or if they
had secondary RLS associated with end-stage renal dis-
ease, iron-deficiency anemia or pregnancy. Patients were
also excluded if they had a history of alcohol or drug
abuse, previous intolerance to dopamine agonists, or were
suffering from other clinically relevant conditions affect-
ing assessments.
All patients gave written, informed consent before enter-
ing the studies, which was done according to the princi-
ples of the 1996 amendment of the Declaration of
Helsinki and approved by local ethics committees.
Study design
Both studies were conducted in a matching double-blind,
randomized, placebo-controlled fashion. Patients were
recruited from hospitals, sleep centres and neurology clin-
ics in 10 European countries in TREAT RLS 1 (Austria, Bel-
gium, France, Germany, Italy, Netherlands, Norway,
Spain, Sweden and the UK) and in six countries around
the world in TREAT RLS 2 (Australia, Canada, Germany,
Norway, the UK and the USA). After a wash-out phase of
generally 5 half-lives or 7 consecutive nights medication-
free, whichever was the longer period, patients were rand-
omized to receive once-daily treatment with either rop-
Health and Quality of Life Outcomes 2005, 3:79 />Page 3 of 11
(page number not for citation purposes)
inirole or placebo for 12 weeks. Other published articles
report the study design in greater detail [11,13].
The primary endpoint in both studies was the change in
the IRLS total score; secondary endpoints included the
RLSQoL overall life impact score, the Medical Outcomes
Study Sleep Problems Index II (MOS Sleep Scale) score
and Clinical Global Impression (CGI) 'Improvement'
(CGI-I) and 'Severity of Illness' (CGI-S) scores.
Outcome measures used in psychometric analysis
RLSQoL
The RLSQoL is a validated questionnaire consisting of 18
items, 13 of which are scored on a 5-point scale, the
remainder being recorded as either a numerical value or a
dichotomous response [12]. Ten of the items contribute
to a single summary score, the overall life impact score,
while the remaining eight items concern employment
(one question), sexual interest (two questions) and work
(five questions), and are summarized individually.
Details of the questionnaire and scoring can be found in
the appendix (see additional file 1). Higher scores on the
RLSQoL overall life impact score indicate a better quality
of life. Patients were asked to complete the RLSQoL at
baseline and at weeks 8 and 12 of the treatment phase, or
at time of withdrawal for patients who discontinued the
studies prematurely. A full listing of the items of the
RLSQoL is provided elsewhere [12]. The RLSQoL is avail-
able on request from Mapi Values.
MOS Sleep Scale
The MOS Sleep Scale is a self-administered scale measur-
ing specific aspects of sleep (problems with sleep distur-
bance [initiation and maintenance], adequacy,
somnolence, quantity, respiratory impairments and snor-
ing) and is reliable and valid in the general US population
[16]. It was designed for use in patients who may have var-
ying co-morbidities, and hence is appropriate for a medi-
cally diverse patient population. The frequency with
which each problem has been experienced during the pre-
vious 4 weeks is rated on a 6-point scale ranging from
'none of the time' to 'all of the time', except sleep quantity,
which is reported in hours. All scores are transformed lin-
early to range from 0 to 100, again with the exception of
the sleep quantity subscale, which is scored in hours.
Higher scores indicate more of the attribute implied by
the scale name (e.g. more sleep disturbance, more ade-
quate sleep, greater sleep quantity). Patients were asked to
complete the MOS Sleep Scale at baseline and at weeks 8
and 12 of the treatment phase, or at the time of with-
drawal for patients who discontinued the study prema-
turely. The psychometric properties of the MOS Sleep
Scale have been found to be satisfactory, both by Hayes
and colleagues [17], and within each of the two clinical
trial populations used in this study, as recently reported at
the 16th Annual Scientific Meeting of the British Sleep
Society, Cambridge, UK, 19–21 September 2004.
CGI
The CGI consists of three modules, the CGI 'Improve-
ment' (CGI-I), the CGI 'Severity of Illness' (CGI-S), and
the CGI 'Efficacy Index', and has been in use for nearly 3
decades [18]. In the present two studies, only the first two
modules were used as outcome measures, although the
CGI 'Efficacy Index' was used by the investigators to guide
titration of the study medication. The CGI-I and CGI-S
modules were assessed by the investigator, based on all
information available at the time of rating. Both modules
were rated on a scale of 0–7, where 0 refers to patients
who were not assessed, 1 indicates 'very much improved'
and 7 indicates 'very much worse'. Changes in the propor-
tions of patients with scores of 'much improved' or 'very
much improved' were identified as two key secondary
endpoints. Both the CGI-I and CGI-S were assessed by the
investigators at day 2 and weeks 1, 2, 3, 4, 5, 6, 7, 8 and
12 of the treatment phase, or at the time of withdrawal in
patients who discontinued the study prematurely. The
CGI-S was also assessed at baseline.
IRLS
The IRLS was developed and validated by the Interna-
tional Restless Legs Syndrome Study Group [14,15]. Sub-
sequent validation studies were conducted for the IRLS
using TREAT RLS 1 and TREAT RLS 2 data, and results con-
firmed the reliability, validity and responsiveness of the
IRLS [19]. The IRLS consists of 10 questions concerning
the patient's symptoms and the impact of these symptoms
on daily activities and mood. Responses range from 0 to
4, with 0 representing the absence of a problem and 4 rep-
resenting a very severe problem.
The IRLS was completed at the baseline visit, at day 2 and
weeks 1, 2, 3, 4, 5, 6, 7, 8 and 12 of the treatment phase
and at the follow-up assessment, or at the time of with-
drawal for patients who withdrew prematurely.
Analysis
Study populations
In both studies, the intention-to-treat (ITT) population
included all randomized patients who received at least
one dose of study medication and who had at least one
post-baseline efficacy measurement. Patients from the ITT
population who had an evaluable RLSQoL (i.e. at least
eight non-missing items among items 1–5, 7–10 and 13,
as specified by the developer of the questionnaire) were
included in the RLSQoL baseline validation population,
which was used for all psychometric analyses of the ques-
tionnaire, except responsiveness. Patients included in the
baseline validation population who also had an evaluable
RLSQoL at the 12-week post-baseline visit were included
Health and Quality of Life Outcomes 2005, 3:79 />Page 4 of 11
(page number not for citation purposes)
in the longitudinal validation population, which was used
for analysis of the responsiveness to change over time of
the RLSQoL. All tests were performed on the total popula-
tion samples, blinded to treatment status.
Psychometric validation analyses
The RLSQoL was assessed for the following psychometric
properties: item convergent validity (item-scale correla-
tions of ≥ 0.4) [20], floor and ceiling effects (the percent-
age scoring the lowest and highest possible scores),
internal consistency reliability (Cronbach's alpha ≥ 0.7),
concurrent validity, known groups validity, clinical valid-
ity and responsiveness.
Assessment of concurrent validity consists of examining
the association between the measure being validated, and
other well-validated measures, assessing similar con-
structs. In this instance, concurrent validity was evaluated
by assessing correlations between the RLSQoL overall life
impact score and the IRLS total score, a clinician-adminis-
tered patient report of RLS symptom severity. As the
RLSQoL has some items related to sleep and somnolence,
the correlations of the RLSQoL overall life impact score
with the MOS Sleep Scale Sleep Problems Index II was
also assessed. Correlations of ≥ 0.40 were considered suf-
ficient evidence of concurrent validity.
The known groups validity of the RLSQoL was assessed by
describing and comparing RLSQoL overall life impact
scores at baseline among groups of patients with mild,
moderate and severe sleep problems, as defined by taking
tertile scores for the Sleep Problems Index II of the MOS
Sleep Scale. Tertile scores were used because no clinical
cut-offs are available for the MOS Sleep Scale. Taking ter-
tile scores involves dividing a normally distributed popu-
lation into three groups of as close as possible to 33% of
patients in each group [21]. Scores of 0–41, 42–56 and
57–100 were considered mild, moderate and severe,
respectively. The hypothesis was that patients with more
severe sleep problems would have worse quality of life,
indicated by lower RLSQoL overall life impact scores.
The clinical validity of the RLSQoL was assessed in two
ways. First, the correlation between the RLSQoL overall
life impact score and the CGI-S score at baseline was
assessed, with a correlation of ≥ 0.40 considered sufficient
to confirm validity. Second, RLSQoL overall life impact
scores at baseline were compared between severity sub-
groups defined by dividing the patients into three groups
on the basis of their CGI-S scores. The groups were com-
prised as follows: (1) normal, not at all ill or borderline ill
(CGI-S scores 1–2); (2) mild, moderately or markedly ill
(CGI-S scores 3–5); (3) severely ill, or among the most
extremely ill patients (CGI-S scores 6–7). Patients with a
CGI-S score of 0 ('not assessed') were excluded from this
analysis. The hypothesis was that for worse clinician-rated
overall health status, RLSQoL overall life impact scores
would also be worse.
The responsiveness of the RLSQoL to change over time
was assessed in two ways. First by examining the correla-
tions between the change in RLSQoL overall life impact
scores (between baseline and weeks 8 and 12) and CGI-I
scores (1–7) at weeks 8 and 12. Patients with a CGI-I score
of 0 ('not assessed') were excluded from the analysis. Sec-
ond, RLSQoL overall life impact change scores (subtract-
ing baseline from week 12 assessments) were compared
among patients defined as improved, unchanged and
worsened at week 12, on the basis of their CGI-I scores.
Patients with a CGI-I score of 0 ('not assessed') were
excluded from the analysis. The effect size (ES) was used
as a measure of the change in RLSQoL scores within each
CGI-I group. ESs were calculated by dividing the change in
mean RLSQoL overall life impact scores (from baseline to
week 12) by the standard deviation of mean scores at
baseline. The ES has been recommended in the literature
as an appropriate benchmark for evaluating the magni-
tude and meaning of change in health status measures
[22].
Cohen and colleagues defined effect sizes of 0.2, 0.5 and
0.8 as small, moderate and large, respectively [23]. We
adopted Guyatt et al's guidance that size effects can be
described as small, moderate or large when results are in
the range of these parameters [24].
Statistics
No adjustments for multiplicity were performed. The Type
1 criterion was 0.05, and all hypothesis tests were two-
sided. As tests of homeoscedasticity (equality of disper-
sion) and normality did not find the analysis data to be
normally distributed, non-parametric tests were used for
all comparisons. Therefore, Pearson's correlation coeffi-
cient was used for all correlations evaluated, the Kruskall-
Wallis test was used for comparisons between more than
two groups, the Mann-Whitney-Wilcoxon test was used
for comparisons between pairs of groups and the Wil-
coxon signed rank test was used for comparing two points
in time within groups.
Results
Patient populations
TREAT RLS 1 included 284 patients in the baseline valida-
tion population, and 229 patients in the week 12 longitu-
dinal validation (responsiveness) population. TREAT RLS
2 included 263 patients in the baseline population and
207 patients in the week 12 longitudinal validation pop-
ulation. Baseline patient characteristics for each study are
shown in Table 1. In both studies, the majority of patients
were categorized as moderately, markedly or severely ill.
Health and Quality of Life Outcomes 2005, 3:79 />Page 5 of 11
(page number not for citation purposes)
The mean age of patients in each study was 55 years and
approximately two-thirds of patients in each study were
women (63.0% and 59.7%, respectively). There was a
slight difference in the mean age of onset in TREAT RLS 1
and TREAT RLS 2: 38 and 35 years, respectively.
Psychometric validation
Missing data
Missing data for TREAT RLS 1 and 2 are summarized in
Table 2. In TREAT RLS 1, missing data for each of the items
of the RLSQoL ranged from 0% missing data for items 1,
2, 4, 7, 8 and 10 to 3.52% (n = 10) for item 5 ('In the past
4 weeks how often were you late for work or your first
appointment due to RLS?'). In TREAT RLS 2, missing data
levels ranged from 0% missing data for items 1, 4, 7, 8, 9
and 13 to 1.52% for item 5. Therefore, missing data at the
item level were not problematic in either study.
Factor analysis
The current scoring of the RLSQoL, devised by the devel-
opers of the questionnaire, suggests calculating a sum-
mary score, i.e. the overall life impact score.
A commonly used criterion for calculating a summary
score is that the cumulative variance of the first factor in a
principal component analysis of ≥ 0.40, although lower
values are sometimes also used (e.g. 0.3). In the present
two studies, principal component analysis resulted in a
Table 1: Patient characteristics at baseline for TREAT RLS 1 (n = 284) and TREAT RLS 2 (n = 263)
TREAT RLS 1 TREAT RLS 2
Age, years
Mean (SD) 55.1 (11.2) 55.4 (11.1)
Range 28.0–78.0 29.0–79.0
Sex, % (n)
Men 37.0 (105) 40.3 (106)
Women 63.0 (179) 59.7 (157)
Work status, % (n)
Full-time employment 36.3 (103) 43.4 (114)
Part-time employment 15.1 (43) 12.6 (33)
Volunteer/unpaid work 2.5 (7) 1.9 (5)
Unemployed due to RLS 1.1 (3) 0.8 (2)
Unemployed due to other (non-RLS) symptoms 3.2 (9) 0.4 (1)
Unemployed for other reasons 8.5 (24) 4.2 (11)
Retired 22.2 (63) 29.3 (77)
Homemaker 11.3 (32) 7.6 (20)
CGI severity of illness, % (n)
Missing data 0 (0) 0.4 (1)
Normal, not at all ill 2.1 (6) 0.4 (1)
Borderline ill 1.1 (3) 1.5 (4)
Mildly ill 9.2 (26) 7.2 (19)
Moderately ill 34.9 (99) 36.5 (96)
Markedly ill 32.0 (91) 31.2 (82)
Severely ill 19.0 (54) 20.2 (53)
Among the most extremely ill patients 1.8 (5) 2.7 (7)
Item 6 of the IRLS: 'How severe was your RLS as a whole?', % (n)
None 0 (0) 0 (0)
Mild 2.1 (6) 2.3 (6)
Moderate 34.9 (99) 36.9 (97)
Severe 43.7 (124) 44.9 (118)
Very severe 19.4 (55) 16.0 (42)
Item 7 of the IRLS: 'How often did you get RLS symptoms?', % (n)
Rarely (< 1 day a week) 0 (0) 0 (0)
Occasionally (1 day a week) 1.4 (4) 0.4 (1)
Sometimes (2–3 days a week) 10.6(30) 9.1 (24)
Often (4–5 days a week) 25.4 (72) 32.7 (86)
Very often (6–7 days a week) 62.7 (178) 57.8 (152)
Age of onset of symptoms, years Mean (SD) 38.2 (16.8) 34.6 (17.3)
CGI = Clinical Global Impression. IRLS = International Restless Legs Scale. SD = standard deviation.
Health and Quality of Life Outcomes 2005, 3:79 />Page 6 of 11
(page number not for citation purposes)
cumulative variance of 0.39 in TREAT RLS 1, and 0.46 in
TREAT RLS 2. Given that the criterion was surpassed in
TREAT RLS 2, and very narrowly missed in TREAT RLS 1,
it was considered acceptable for the overall life impact
score to be calculated.
The results of the construct validity analysis demonstrated
excellent reliability and construct validity for the RLSQoL,
as summarized in Table 3.
Item convergent validity
The criterion for item convergent validity (item-scale cor-
relations ≥ 0.40) was satisfied by all items in TREAT RLS
2. In TREAT RLS 1, all except two items met the criterion
for item convergent validity. However, both items only
narrowly missed the 0.40 threshold with correlations of
0.36 (item 1: 'In the past 4 weeks how distressing to you
were your restless legs?') and 0.35 (item 5: 'In the past 4
weeks how often were you late for work or your first
appointments of the day due to restless legs?'), respec-
tively.
Internal consistency reliability
Cronbach's alpha coefficients for the RLSQoL overall life
impact score were 0.82 and 0.87 in TREAT RLS 1 and 2,
respectively, indicating satisfactory internal consistency
reliability for the RLSQoL in both trials.
Floor and ceiling effects for the RLSQoL overall life impact score
For the RLSQoL overall life impact score, in TREAT RLS 1,
0.35% (n = 1) of patients scored at floor, 0% scored at ceil-
ing. In TREAT RLS 2, 0% of patients scored at floor and
0.38% (n = 1) scored at ceiling. Therefore, there were no
significant floor or ceiling effects for the RLSQoL overall
impact score in either study.
Concurrent validity
Correlations of the RLSQoL overall life impact score with
the concurrent measures are provided in Table 4. All cor-
relations were above the 0.40 standard set for concurrent
validity. In both TREAT RLS 1 and 2, the RLSQoL overall
life impact score was moderately correlated at a statisti-
cally significant level with both the IRLS total score (r = -
0.68 and r = -0.67, respectively) and the Sleep Problems
Index II (r = 0.59 and r = 0.60, respectively). These results
confirm the concurrent validity of the RLSQoL.
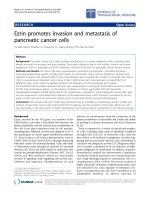
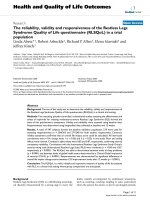
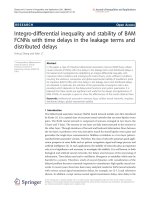
Known groups validity
In both TREAT RLS 1 and 2, the results indicate that the
RLSQoL overall life impact scores distinguished between
groups of mild, moderate and severe sleep problems at a
statistically significant level (p < 0.0001); patients with
more severe sleep problems had lower RLSQoL overall life
impact scores (poorer quality of life) (Figure 1). Mean
overall life impact scores for mild, moderate and severe
Table 2: Missing data for the RLSQoL items in TREAT RLS 1 and 2
RLSQoL item TREAT RLS
1 % (n)
TREAT RLS
2 % (n)
1 In the past 4 weeks how distressing to you were your restless legs? 0 (0) 0 (0)
2 How often in the past 4 weeks did RLS disrupt your routine evening activities? 0 (0) 0.38 (1)
3 How often in the past 4 weeks did RLS keep you from attending your evening social activities? 1.06 (3) 0.76 (2)
4 In the past 4 weeks how much trouble did you have getting up in the morning due to restless legs? 0 (0) 0 (0)
5 In the past 4 weeks how often were you late for work or your first appointments of the day due to RLS? 3.52 (10) 1.52 (4)
7 How often in the past 4 weeks did you have trouble concentrating in the afternoon? 0 (0) 0 (0)
8 How often in the past 4 weeks did you have trouble concentrating in the evening? 0 (0) 0 (0)
9 In the past 4 weeks how much was your ability to make good decisions affected by sleep problems? 0.35 (1) 0 (0)
10 How often in the past 4 weeks would you have avoided travelling when the trip would have lasted more
than 2 hours?
0 (0) 0.38 (1)
13 In the past 4 weeks how much did your restless legs disturb your ability to carry out daily activities, for
example carrying out a satisfactory family, home, social, school or work life?
0.35 (1) 0 (0)
Table 3: Construct validity and reliability of the RLSQoL overall life impact score
TREAT RLS 1 TREAT RLS 2
Item-convergent validity, % items with item-scale correlation ≥ 0.40 (coefficient range) 85% (0.35–0.66) 100% (0.46–0.70)
Floor/ceiling effects (% of respondents with minimum/maximum scale scores) 0.35%/0.00% 0.00%/0.38%
Internal consistency reliability, Cronbach's alpha coefficient (satisfactory if ≥ 0.70) 0.82 0.87
RLSQoL = Restless Legs Syndrome Quality of Life questionnaire.
Health and Quality of Life Outcomes 2005, 3:79 />Page 7 of 11
(page number not for citation purposes)
groups were 73.04, 63.68 and 49.26, respectively, in
TREAT RLS 1, and 74.93, 67.44, and 50.54, respectively, in
TREAT RLS 2. These results indicate the 'known groups' or
discriminative validity of the RLSQoL.
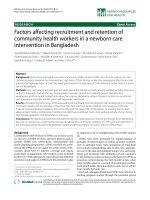
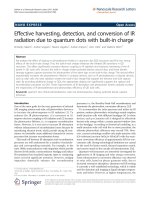
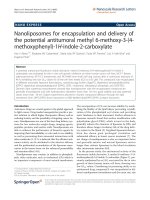
Clinical validity
First, clinical validity was assessed by examining the corre-
lation between RLSQoL overall life impact scores and
CGI-S scores. The correlation between RLSQoL overall life
impact scores and CGI-S scores was moderate (r = -0.42, p
< 0.0001) in TREAT RLS 1, and low but statistically signif-
icant (r = -0.33, p < 0.0001) in TREAT RLS 2. In addition,
statistically significant differences in RLSQoL overall life
impact scores were observed between the three CGI-S sub-
groups (p < 0.0003) in both TREAT RLS 1 and 2 (Figure
2). Impairment in quality of life due to RLS was greater for
groups with worse clinician-rated RLS severity. The differ-
ences between pairs of adjacent groups were assessed fur-
ther using the Mann-Whitney-Wilcoxon test. However, in
both studies, the subgroup of patients with CGI-S scores
of 1–2 (very mild) was very small, most likely as a conse-
quence of the inclusion criteria for the studies (moderate/
severe). Comparisons with this mild group should, there-
fore, be interpreted with caution. Nevertheless, statisti-
cally significant differences in RLSQoL overall life impact
scores between the two larger CGI-S subgroups, 3–5 and
6–7, were observed in both studies (p < 0.0001 in both).
These findings provide evidence that the RLSQoL is clini-
cally valid in this clinical trial population.
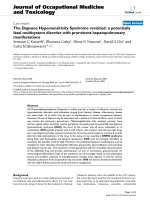
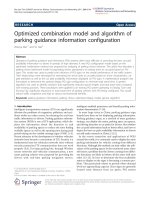
Responsiveness to change over time
When assessing responsiveness, trends for the correla-
tions, change scores and effect sizes were similar at week 8
and week 12. (For brevity, only week 12 results are
reported here; week 8 results are available on request.)
First, the responsiveness of the RLSQoL to change over
time was suggested by moderate and statistically signifi-
cant correlations of RLSQoL overall life impact change
scores with CGI-I scores (r = -0.51, p < 0.0001 in both
studies). Investigating this relationship further, statisti-
cally significant differences in RLSQoL overall life impact
change scores (from baseline to week 12) were observed
between groups stratified according to CGI-I scores, in
both studies (Tables 5 and 6; p < 0.0001). In both studies,
there was a step-wise increase in effect sizes for the no
change, and minimally, much and very much improved
groups, indicating greater improvements in RLSQoL
scores for the more improved CGI-I groups compared
with the less improved and no change groups. Effect sizes
indicated large improvements in overall life impact scores
in the 'very much improved' (ES = 1.51, in both studies),
and 'much improved' groups (ES = 1.15 and 1.00 in
TREAT RLS 1 and 2, respectively), large and moderate
improvements in the 'minimally improved' groups (ES =
0.74 and 0.54, respectively) and moderate or small
improvements in the 'no change' group (ES = 0.37 and
Known groups validityFigure 1
Known groups validity. RLSQoL overall life impact scores
by mild, moderate and severe sleep problems. p < 0.0001 for
comparisons of RLSQoL overall life impact scores among
sleep problems severity groups defined by taking tertile
scores for the Sleep Problems Index II in TREAT RLS 1 and 2
(Kruskall-Wallis test). RLSQoL = RLS Quality of Life ques-
tionnaire.
%
'%
&%
)%
(%
+%
*%
,%
-%
.%
BZVchXdgZh
IG:6IGAH& IG:6IGAH'
B^aY
BdYZgViZ
HZkZgZ
c2-'
c2.,
c2&%*
c2,.
c2-)
c2&%%
Table 4: Concurrent validity: correlations between the RLSQoL overall life impact score and the scores for the IRLS total score and
the MOS Sleep Problems Index II (TREAT RLS 1 and 2)
a
RLSQoL overall life impact score IRLS total score MOS Sleep Scale Sleep Problems Index II
TREAT RLS 1 Spearman correlation coefficient -0.68 -0.59
p value < 0.0001 < 0.0001
Number of patients 284 284
TREAT RLS 2 Spearman correlation coefficient -0.67 -0.60
p value < 0.0001 < 0.0001
Number of patients 263 263
IRLS = International Restless Legs Scale. RLSQoL = Restless Legs Syndrome Quality of Life questionnaire. MOS = Medical Outcomes Study.
a
Satisfactory if correlation ≥ 0.40.
Health and Quality of Life Outcomes 2005, 3:79 />Page 8 of 11
(page number not for citation purposes)
0.31, respectively). In TREAT RLS 1 and 2, patient num-
bers were very small in the 'minimally worse' (5 and 6,
respectively), 'much worse' (9 and 0, respectively) and
'very much worse' (0 and 1, respectively) CGI-I groups;
therefore, comparisons with these groups cannot be eval-
uated.
These findings indicate that the RLSQoL is responsive to
clinician-rated changes in health status.
Discussion
Based on the results of this psychometric evaluation, the
RLSQoL has been found to be reliable, valid and respon-
sive to change in both TREAT RLS 1 and 2. Although the
psychometric validity of the RLSQoL has been demon-
strated previously [12], due to the evolutionary nature of
validation it is important to confirm the psychometrics of
a questionnaire when used in different settings and with
different populations. The results provide evidence of the
psychometric integrity of the RLSQoL within the RLS pop-
ulations studied, and support its use in patients with RLS,
particularly in a clinical trial setting.
The factor analysis results support the calculation of a
summary score, the overall life impact score, based on 10
of the 18 items. Although the factor analysis results in
TREAT RLS 1 gave a cumulative variance of only 0.39, nar-
rowly missing the 0.40 criterion for calculating a summary
score, published research suggests that the cut-off point of
0.40 is 'arbitrary' [25]. Therefore, given that the criterion
was surpassed in TREAT RLS 2 (with cumulative variance
of 0.46), and only narrowly missed in TREAT RLS 1, it is
still considered appropriate to calculate a summary score.
This position is further supported by the satisfactory psy-
chometric validation results, and evidence from a previ-
ous independent validation study which also concluded
that calculating the overall life impact score was valid and
appropriate [12].
Both the original validation study and the present
research have focused on evaluating the psychometric
validity of the overall life impact score: the validity of
potential subscales could be investigated in future studies
[12]. In addition, sample sizes did not permit factor anal-
yses to be conducted for each country separately; further
research could examine differences in scale structure by
country or within different age groups.
Taking the findings of both studies together, item conver-
gent validity results were satisfactory. Two items did nar-
rowly miss the criterion (item-scale correlations ≥ 0.40) in
TREAT RLS 1. However, given that they were only slightly
below the threshold in TREAT RLS 1, and met the criterion
in TREAT RLS 2, this was of little concern. The internal
consistency reliability of items in the RLSQoL overall life
impact score was acceptable in both studies, with Cron-
bach's coefficients exceeding the accepted standard (≥
0.70). There were no significant floor or ceiling effects in
either study.
In the assessment of concurrent validity, the moderate
correlations between the RLSQoL overall life impact score
and the IRLS total score indicate that there is some overlap
between the RLSQoL and the IRLS, but not so much over-
lap as to suggest redundancy (> 0.9). The IRLS and
RLSQoL assess different concepts (severity and quality of
life, respectively) and therefore it is not surprising that the
overlap is not greater.
Correlation between the RLSQoL overall life impact scale
and the MOS Sleep Scale Sleep Problems Index II was also
moderate in both studies, providing evidence that sleep
problems do have an impact on quality of life. These
results confirm the concurrent validity of the RLSQoL.
In both studies, the RLSQoL overall life impact score was
able to distinguish between patients with mild, moderate
and severe sleep problems. The results indicate that
Clinical validityFigure 2
Clinical validity. Comparison of RLSQoL overall life impact
scores at baseline among CGI-S groups. CGI-S subgroups 1–
2 include normal, not at all ill and borderline ill patients; sub-
groups 3–5 include mild, moderate, and markedly ill patients;
and subgroups 6–7 include severely ill, and the most
extremely ill patients. p < 0.0003 (Kruskall-Wallis test com-
paring all three subgroups) and p < 0.000.1 (Mann-Whitney-
Wilcoxon test comparing subgroups 3–5 with 6–7) for com-
parisons of RLSQoL overall life impact scores among col-
lapsed CGI-S subgroups in both TREAT RLS 1 and 2; p = not
significant (Mann-Whitney-Wilcoxon test comparing sub-
groups 1–2 with 3–5). RLSQoL = RLS Quality of Life ques-
tionnaire. CGI-S = Clinical Global Impression 'Severity of
Illness'.
%
'%
&%
)%
(%
+%
*%
,%
-%
&%%
.%
BZVchXdgZ
IG:6IGAH& IG:6IGAH'
&¶'
(¶*
+¶,
c2.
c2'&+
c2*.
c2*
c2&.,
c2+%
Health and Quality of Life Outcomes 2005, 3:79 />Page 9 of 11
(page number not for citation purposes)
patients with more severe sleep problems also had lower
RLSQoL overall life impact scores (poorer quality of life),
thus demonstrating the known groups validity of the
RLSQoL overall life impact score.
The findings indicated that as the CGI-S scores increased,
RLSQoL overall life impact scores worsened. The fact that
the correlation between CGI-S and the RLSQoL overall life
impact scores was only low to moderate is unsurprising,
given that correlations between doctors' ratings of severity
and patient reports of severity are often low to moderate
[26,27].
In addition, the RLSQoL overall impact scores were able
to distinguish between the three clinician-rated severity
groups. The sample sizes in the 'mild' groups were very
small, and the results for these groups should, therefore,
be interpreted with caution. However, RLSQoL overall life
impact scores for the 'moderate' CGI-S groups were statis-
tically significantly different from those for the 'severe'
CGI-S groups in both studies. Of note, although these
studies did not assess 'mild' RLS patients, the original val-
idation did assess this group (in addition to patients with
moderate and severe RLS). The combination of these
results indicates the clinical validity of the RLSQoL in
mild, moderate and severe groups [12].
The responsiveness of the RLSQoL to change over time
was confirmed by comparing change scores from baseline
to week 12 with clinicians' perceived changes (CGI-I).
Correlation of changes in RLSQoL overall life impact
score with CGI-I scores was moderate and statistically sig-
nificant in both studies. RLSQoL overall life impact
change scores were able to distinguish between CGI-I sub-
groups at a statistically significant level in both studies.
RLSQoL scores were improved in patients rated by their
clinicians as 'improved', as well as in those patients rated
by their clinicians as 'unchanged'. However, effect sizes
indicated the improvements were consistently 'large' in
those patients rated as 'improved' but only small or mod-
erate in those rated as 'unchanged'. Sample sizes for the
worsened groups were small and results for these groups
should be interpreted with caution. Improvements in the
'no change' CGI group suggest the potential presence of
the 'Hawthorne effect'; that is, a response shift most prob-
ably due to positive psychosocial effects of participating in
a clinical trial, regardless of the specific nature of any
intervention [26].
The sensitivity of the RLSQoL to worsening RLS severity
could not be fully evaluated in this study owing to the
small sample size of worsening patients, and should be
investigated further in a larger sample of worsening
ResponsivenessFigure 3
Responsiveness. Effect sizes as a measure of the change in RLSQoL overall life impact change scores between baseline and
week 12, by CGI-I scores at week 12. p < 0.0001 for comparisons of the change in RLSQoL overall life impact scores among
CGI-I groups in both TREAT RLS 1 and 2 (Kruskall-Wallis test). The sample size of n = 1 in the 'worsened' group in TREAT
RLS 2 meant that effect sizes could not be calculated. RLSQoL = RLS Quality of Life questionnaire. CGI-I = Clinical Global
Impression 'Improvement'.
¶%#'
%#%
%#)
%#'
%#-
%#+
&#%
&#'
&#+
&#)
:[[ZXih^oZhd[X]Vc\Zh^cGAHFdA
dkZgVaaa^[Z^beVXihXdgZh
IG:6IGAH&
8<>">hXdgZhVilZZ`&'
IG:6IGAH'
KZgnbjX]^begdkZY
BjX]^begdkZY
B^c^bVaan^begdkZY
CdX]Vc\Z
B^c^bVaanldghZ
BjX]ldghZ
c2+-
c2*.
c2(+
c2*&
c2*
c2.
c2*&
c2*&
c2*&
c2(,
c2+
c2&
Health and Quality of Life Outcomes 2005, 3:79 />Page 10 of 11
(page number not for citation purposes)
patients at the first opportunity. Therefore, it cannot be
concluded that the RLSQoL is responsive to worsening
until further research is conducted. Furthermore, due to
the inclusion criteria for the trials, there were very few
patients who were rated by their clinician as being 'nor-
mal, not at all ill', 'borderline ill' or 'mildly ill' at baseline
(1.27%, 1.27% and 8.18%, respectively, from the CGI-S at
baseline). Therefore, further study of the performance of
the responsiveness of the RLSQoL in patients with 'mild'
RLS is also warranted.
Finally, the focus of this research was on group compari-
sons; as a result, additional research is warranted to eval-
uate the usefulness of the RLSQoL in clinical practice to
assess patients individually.
Conclusion
In conclusion, the RLSQoL is reliable, valid and respon-
sive to improvements in patients with RLS, in a clinical
trial setting. The RLSQoL is short, takes 10 minutes to
complete, and covers those aspects of life most impacted
by RLS. Other, more generic, questionnaires will not be as
relevant to patients and therefore will not be as clinically
relevant.
Authors' contributions
LA, EM, JK, and RPA all participated in the design of the
study. LA and RA wrote the analysis plan and supervised
the analysis. All authors were involved in the interpreta-
tion of the data. LA, RA, and JK were involved in drafting
the article, which was then revised following critical
Table 5: Changes in RLSQoL overall life impact scores from baseline to week 12: effect sizes and a comparison between CGI-I levels 1–
7 (TREAT RLS 1)
n Baseline mean Baseline SD (total) Week 12 mean Mean change Effect size Kruskal-Wallis test
(p value)
Very much improved 68 64.33 18.25 91.95 27.62 1.51 0.0001
Much improved 59 62.41 18.25 83.47 21.06 1.15
Minimally improved 36 57.84 18.25 71.38 13.54 0.74
No change 51 58.65 18.25 65.41 6.76 0.37
Minimally worse 5 76.13 18.25 82.61 6.48 0.36
Much worse 9 58.33 18.25 57.53 -0.8 -0.04
p < 0.0001 for comparisons of the change in RLSQoL overall life impact scores among CGI-I groups in TREAT RLS 1 (Kruskall-Wallis test). There
were no patients included in the CGI-I 'very much worse' category. Effect sizeswere calculated by dividing the change in mean score (from baseline
to week 12) by the standard deviation of the mean score at baseline. RLSQoL = RLS Quality of Life questionnaire. CGI-I = Clinical Global
Impression 'Improvement'.
Table 6: Changes in RLSQoL overall life impact scores from baseline to week 12: effect sizes and a comparison between CGI-I levels 1–
7 (TREAT RLS 2)
n Baseline mean Baseline SD (total) Week 12 mean Mean change Effect size Kruskal-Wallis test
(p value)
Very much improved 74 63.78 18.83 92.15 28.47 1.51 0.0001
Much improved 43 59.19 18.83 77.94 18.75 1.00
Minimally improved 45 66.72 18.83 76.94 10.22 0.54
No change 37 65.48 18.83 71.39 5.91 0.31
Minimally worse 6 60.83 18.83 70.83 10.00 0.53
Very much worse 1 80.00 18.83 85.00 5.00
p < 0.0001 for comparisons of the change in RLSQoL overall life impact scores among CGI-I groups in TREAT RLS 2 (Kruskall-Wallis test). There
were no patients included in the CGI-I 'much worse' category. The 'very much worse' group consisted of a single patient and therefore further
statistical tests were not performed for this group. Effect sizes were calculated by dividing the change in mean score (from baseline to week 12) by
the standard deviation of the mean score at baseline.
RLSQoL = RLS Quality of Life questionnaire. CGI-I = Clinical Global Impression 'Improvement'.
Publish with BioMed Central and every
scientist can read your work free of charge
"BioMed Central will be the most significant development for
disseminating the results of biomedical research in our lifetime."
Sir Paul Nurse, Cancer Research UK
Your research papers will be:
available free of charge to the entire biomedical community
peer reviewed and published immediately upon acceptance
cited in PubMed and archived on PubMed Central
yours — you keep the copyright
Submit your manuscript here:
/>BioMedcentral
Health and Quality of Life Outcomes 2005, 3:79 />Page 11 of 11
(page number not for citation purposes)
review by EM and RPA. All authors read and approved the
final manuscript.
Additional material
Acknowledgements
Both the clinical trials and the psychometric analysis were supported by
GlaxoSmithKline Research and Development.
References
1. Allen RP, Picchietti D, Hening WA, Trenkwalder C, Walters AS,
Montplaisir J: Restless legs syndrome: diagnostic criteria, spe-
cial considerations, and epidemiology. A report from the
restless legs syndrome diagnosis and epidemiology work-
shop at the national institutes of health. Sleep Med 2003,
4:101-119.
2. Earley CP: Restless legs syndrome. N Engl J Med 2003,
348:2103-2109.
3. Rothdach AJ, Trenkwalder C, Haberstock J, Keil U, Berger K: Prev-
alence and risk factors of RLS in an elderly population: the
MEMO study. Memory and Morbidity in Augsburg Elderly.
Neurology 2000, 54:1064-1068.
4. Allen RP, Earley CJ: Validation of the Johns Hopkins Restless
Legs Severity Scale (JHRLSS). Sleep Med 2001, 2:239-242.
5. Hening W, Walters AS, Allen RP, Montplaisir J, Myers A, Ferini-
Strambi L: Impact, diagnosis and treatment of restless legs
syndrome (RLS) in a primary care population: the REST
(RLS Epidemiology, Symptoms, and Treatment) Primary
Care study. Sleep Med 2004, 5:237-246.
6. Allen RP, Earley CJ: Restless legs syndrome: a review of clinical
and pathophysiologic features. J Clin Neurophysiol 2001,
18:128-147.
7. Allen RP, La Buda MC, Becker P, Earley CJ: Family history study of
the restless legs syndrome. Sleep Med 2002, 3(Suppl):S3-7.
8. Desautels A, Turecki G, Montplaisir J, Sequeira A, Verner A, Rouleau
GA: Identification of a major susceptibility locus for restless
legs syndrome on chromosome 12q. Am J Hum Genet 2001,
69:1266-1270.
9. Chen JT, Garcia PA, Alldredge BK: Zonisamide-induced restless
legs syndrome. Neurology 2003, 60:147.
10. Bonati MT, Ferini-Strambi L, Aridon P, Oldani A, Zucconi M, Casari
G: Autosomal dominant restless legs syndrome maps on
chromosome 14q. Brain 2003, 126:1485-1492.
11. Trenkwalder C, Garcia-Borreguero D, Montagna P, Lainey E, de
Weerd AW, Tidswell P, Saletu-Zyhlarz G, Telstad W, Ferini-Strambi
L: Ropinirole in the treatment of restless legs syndrome:
results from the TREAT RLS 1 study, a 12-week, ran-
domised, placebo controlled study in 10 European countries.
J Neurol Neurosurg Psychiatry 2004, 75:92-97.
12. Abetz L, Vallow S, Kirsch J, Allen R, Washburn T, Earley C: Valida-
tion of the Restless Legs Syndrome Quality of Life Question-
naire. Value Health 2005, 8:157-167.
13. Walters AS, Ondo WG, Dreykluft T, Grunstein R, Lee D, Sethi K, on
behalf of the TREAT RLS 2 Study Group: Ropinirole is effective in
the treatment of restless legs syndrome: TREAT RLS 2: a 12-
week, double-blind, randomized, parallel-group, placebo-
controlled study. Mov Disord 2004, 19:1414-1423.
14. Allen RP, Kushida CA, Atkinson MJ: RLS QoL Consortium. Fac-
tor analysis of the International Restless Legs Syndrome
Study Group's scale for restless legs severity. Sleep Med 2003,
4:133-135.
15. Walters AS, LeBrocq C, Dhar A, Hening W, Rosen R, Allen RP,
Trenkwalder C, on behalf of the International Restless Legs Syndrome
Study Group: Validation of the International Restless Legs
Syndrome Study Group Rating Scale for restless legs syn-
drome. Sleep Med 2003, 4:121-132.
16. Hays RD, Stewart AL: Sleep measures. In Measuring Functioning and
Well-Being. The Medical Outcomes Study Approach Edited by: Stewart
AL, Ware JE Jr. Durham and London: Duke University Press;
1992:235-259.
17. Hays RD, Martin SA, Sesti AM, Spritzer KL: Psychometric proper-
ties of the medical outcomes study sleep measure. Sleep Med
2005, 6:41-44.
18. Guy W Ed: Clinical Global Impression (CGI). In ECDEU Assess-
ment Manual for Psychopharmacology . Rockville, MD: US Department
of Health and Human Services, Public Health Service, Alcohol Drug
Abuse and Mental Health Administration, NIMH Psychopharmacol-
ogy Research Branch; 1976:218-222.
19. Abetz L, Arbuckle R, Allen R, Garcia-Borreguero D, Hening W, Wal-
ters A, Mavraki E, Kirsch J: Validating the International Restless
Legs Scale (IRLS) in a trial patient population. Poster pre-
sented at the 16th Annual Meeting of the British Sleep Society, Cam-
bridge, UK; 2004:19-21.
20. Campbell DT, Fiske DW: Convergent and discriminant valida-
tion by the multitrait-multimethod matrix. Psychol Bull 1959,
56:81-105.
21. Bennett RM, Schein J, Kosinski MR, Hewitt DJ, Jordan DM, Rosenthal
NR: Impact of fibromyalgia pain on health-related quality of
life before and after treatment with tramadol/acetami-
nophen. Arthritis Rheum 2005, 53:519-527.
22. Kazis LE, Anderson JJ, Meenan RF: Effect Sizes for interpreting
changes in health Status. Med Care 1989, 27:S178-S189.
23. Cohen J: Statistical Power Analysis for the Behavioral Sciences 2nd edition.
Hillsdale, NJ: Lawrence Earlbaum Associates; 1988.
24. Guyatt GH, Osaba D, Wu AW, Wyrwich KW, Norman GR, the Clin-
ical Significance Consensus Meeting Group: Methods to explain
the clinical significance of health status measures. Mayo Clin
Proc 2002, 77:371-383.
25. Dunteman GH: Principal Components Analysis. Sage University Paper
series on Quantitative Applications in the Social Sciences, Series No. 69
Newbury Park, CA: Sage; 1989.
26. Scheitel SM, Boland BJ, Wollan PC, Silverstein MD: Patient-physi-
cian agreement about medical diagnosis and cardiovascular
risk factors in the ambulatory general medication examina-
tion. Mayo Clin Proc 1996, 71:1131-1137.
27. Abetz L, Shumaker S, Marciniak A, Thorsen H, Niero M, Kohlmann T:
Agreement levels between clinicians' and patients' reports
of health: results from an international study of postmeno-
pausal women. Poster presented at The North American Meno-
pause Society Meeting, Miami Beach, Florida, USA; 2003:19-21.
28. Bouchet C, Guillemin F, Briancon S: Non-specific effects in longi-
tudinal studies: impact on quality of life measures. J Clin Epi-
demiol 1996, 49:15-20.
Additional File 1
Appendix: RLS Quality of Life Questionnaire
Click here for file
[ />7525-3-79-S1.doc]