báo cáo hóa học:" Psychometric properties and the prevalence, intensity and causes of oral impacts on daily performance (OIDP) in a population of older Tanzanians" potx
Bạn đang xem bản rút gọn của tài liệu. Xem và tải ngay bản đầy đủ của tài liệu tại đây (418.5 KB, 11 trang )
BioMed Central
Page 1 of 11
(page number not for citation purposes)
Health and Quality of Life Outcomes
Open Access
Research
Psychometric properties and the prevalence, intensity and causes of
oral impacts on daily performance (OIDP) in a population of older
Tanzanians
IA Kida*
1,2
, AN Åstrøm
1,3
, GV Strand
4
, JR Masalu
2
and G Tsakos
5
Address:
1
Centre for international health, UoB, Bergen, Norway,
2
Muhimbili University College of Health Sciences, Dar es Salaam, Tanzania,
3
Department of Odontology-Community Dentistry, UoB, Bergen, Norway,
4
Department of Odontology-Gerodontology, UoB, Bergen, Norway
and
5
Department of Epidemiology and Public Health, University College of London Medical School, UK
Email: IA Kida* - ; AN Åstrøm - ; GV Strand - ;
JR Masalu - ; G Tsakos -
* Corresponding author
Abstract
Background: The objective was to study whether a Kiswahili version of the OIDP (Oral Impacts
on Daily Performance) inventory was valid and reliable for use in a population of older adults in
urban and rural areas of Tanzania; and to assess the area specific prevalence, intensity and perceived
causes of OIDP.
Method:
A cross-sectional survey was conducted in Pwani region and in Dar es Salaam in 2004/2005. A two-
stage stratified cluster sample design was utilized. Information became available for 511 urban and
520 rural subjects (mean age 62.9 years) who were interviewed and participated in a full mouth
clinical examination in their own homes.
Results: The Kiswahili version of the weighted OIDP inventory preserved the overall concept of
the original English version. Cronbach's alpha was 0.83 and 0.90 in urban and rural areas,
respectively, and the OIDP inventory varied systematically in the expected direction with self-
reported oral health measures. The respective prevalence of oral impacts was 51.2% and 62.1% in
urban and rural areas. Problems with eating was the performance reported most frequently (42.5%
in urban, 55.1% in rural) followed by cleaning teeth (18.2% in urban, 30.6% in rural). More than half
of the urban and rural residents with impacts had very little, little and moderate impact intensity.
The most frequently reported causes of impacts were toothache and loose teeth.
Conclusion: The Kiswahili OIDP inventory had acceptable psychometric properties among non-
institutionalized adults 50 years and above in Tanzania. The impacts affecting their performances
were relatively common but not very severe.
Background
Clinical data are mouth centered and rely on dental pro-
fessionals' judgments. They have traditionally been uti-
lized in assessing oral health in industrialized- and low
income countries. Although informative, this clinical
approach has been criticized because of its limited focus
Published: 27 August 2006
Health and Quality of Life Outcomes 2006, 4:56 doi:10.1186/1477-7525-4-56
Received: 22 May 2006
Accepted: 27 August 2006
This article is available from: />© 2006 Kida et al; licensee BioMed Central Ltd.
This is an Open Access article distributed under the terms of the Creative Commons Attribution License ( />),
which permits unrestricted use, distribution, and reproduction in any medium, provided the original work is properly cited.
Health and Quality of Life Outcomes 2006, 4:56 />Page 2 of 11
(page number not for citation purposes)
in terms of failing to consider functional and psychosocial
aspects of oral health [1,2]. In response to a concern that
clinical measures alone may not be adequate for assessing
the public's oral health needs, oral health related quality
of life measures (OHRQoL) have been developed and
tested in various populations and are increasingly being
used to supplement clinical indicators [1]. Cross-cultural
adaptation of existing measures is warranted and efforts
are ongoing to translate and adapt OHRQoL measures for
use in non-western cultural settings [1,3].
One promising OHRQoL measure is the Oral Impacts on
Daily Performance (OIDP) scale [4,5]. The OIDP was
developed to measure oral impacts that seriously affect a
person's daily life. It is based on the conceptual frame-
work of the World Health Organisation's International
Classification of Impairments, Disabilities and Handi-
caps, ICIDH [6], which has been amended for dentistry by
LOCKER [7]. The OIDP concentrates only on the meas-
urement of "ultimate" oral impacts, thus covering the
fields of disability and handicap [4,5]. It consists of 8
items that assess the impact of oral conditions on basic
activities and behaviours that cover the physical, psycho-
logical, and social dimensions of daily living [4,5]. Con-
sidering respondent burden, the OIDP is suitable for use
in population surveys, not only in terms of being easier
when measuring behaviours rather than feeling states, but
also in being short. The scoring system quantifies (weigh)
the impacts by using a score that reflects their frequency as
well as a severity score that indicates the importance of the
specific impact in the daily life of the person. Multiplying
the frequency and severity scores provides different per-
formance scores and the total score is expressed as a per-
centage of the sum of the performance scores divided by
the maximum possible score multiplied by 100. In this
sense the severity score provides a way of weighting the
frequency of oral impacts with individually sensitive
weights. Although, socio-dental indicators have been
reported to perform satisfactorily as un-weighted rather
than as weighted scores [8,9], the individually sensitive
weighting system of the OIDP gives prominence and
increased validity to the views of the respondents [10].
Moreover, it is evident that the OIDP weighted score is a
better predictor than either the frequency or severity
scores separately [1].
The OIDP has proved to be reliable and valid in cross-sec-
tional population based studies. It has been shown to be
applicable to older adult populations in Great Britain
[11], Greece [10] and Thailand [12]. From Tanzania,
Masalu et al [13] reported that the English OIDP fre-
quency questionnaire fulfilled the psychometrical
requirements underlying the scoring of the eight items
and was applicable to adults attending higher education
in Dar es Salaam.
Recently, it has been claimed that more oral health care is
needed globally for the growing ageing populations [14].
In this context the OIDP index is worthy of consideration
because of its adaptation for use in oral health needs
assessment, thus making it useful for planning services
[15,16]. This study aimed to assess the applicability of a
Kiswahili version of the OIDP inventory for use in a pop-
ulation of older Tanzanian adults. First, internal reliability
was assessed and discriminative and construct validity
were determined by comparing OIDP scores of groups
that differ regarding their demographic, socio-economic,
clinical and behavioural characteristics. Secondly, the
urban rural specific prevalence, severity and causes of oral
impacts in older adults were assessed.
Methods
Study area
A cross sectional survey was conducted in Pwani region,
Eastern Tanzania and in the capital city of Dar es Salaam
from November 2004 to June 2005. According to the
2002 population and housing survey in Tanzania, Pwani
region has the highest number of people 65 years and
above in the country (7%). Dar es Salaam and Pwani
region have a total population of 2.5 million and
889,154, respectively. The corresponding figures for pop-
ulation densities are 1,793 and 27 persons per square km.
The districts have drinking water with fluoride content of
about 1 mg fluoride/L (1 ppm)
Sampling and procedure
A sample size of 1200 was calculated assuming a preva-
lence rate of tooth loss (≥ 1 missing tooth) of 50%, a pre-
cision of 4% and a design effect of 2 [17]. The estimated
sample size was satisfactory also for two sided tests,
assuming prevalence of oral impacts of 0.60 and 0.50 in
individuals with caries experience and without caries
experience, a significance level of 5% and a power of 90%
[17]. A stratified (disproportionate) two-stage cluster sam-
ple design with villages as the primary sampling unit was
implemented. Villages were selected from two rural dis-
tricts (Kibaha and Bagamoyo) and one urban (Kinon-
doni) district in Pwani and Dar es Salaam region,
respectively (Fig 1). To obtain a sample of older adults of
mixed socio-economic background, 107 pure urban (N =
59688) villages and 96 pure rural villages (N = 26520)
were listed in Kinondoni and in Kibaha/Bagamoyo. At the
first stage, 10 pure urban villages (n = 6290) and 10 pure
rural villages (n = 3729) were selected by systematic ran-
dom sampling from the district village population lists. At
the second stage, a total of 60 households were selected by
systematic random sampling from each village selected at
the first stage. This involved randomly selecting the first
household by spinning a bottle at the presumed center of
each village to obtain a starting direction, listing on papers
all household heads in the selected direction up to the
Health and Quality of Life Outcomes 2006, 4:56 />Page 3 of 11
(page number not for citation purposes)
border of the village, folding the paper and randomly
picking one name. The next household would be one
whose front door was nearest to the previous one. A
household was defined as a group of people living, cook-
ing and eating together. One person 50 years and above
was enrolled per household. In case the household had
several people in the targeted age group, one man and one
woman were selected randomly. Over sampling of rural
villages were implemented to achieve a sample size that
was big enough to conduct stratified analyses. A village
leader followed the data collectors through the village and
traditional village customs were observed to ensure a high
response rate. Only consenting subjects were included in
the study. Reasons for non-participation were refusals (n
= 45), absence from the household on the day of the inter-
view (n = 88). Exclusion criteria were presence of disease/
conditions that might pose a health risk to the participant
or that may interfere with the interview and clinical exam-
ination. Subjects were excluded if they were ill or had a
history of psychiatric problems (n = 23), were intoxicated
with alcohol (n = 2), were too old (n = 7) or had beliefs in
witchcraft (n = 4). Permission to carry out the study was
approved by the Research and Publication Committee at
Muhimbili University College of Health Sciences,
MUCHS, regional and district administration authorities,
village leaders and from the ethical research committee in
Norway (REK VEST). Informed consent was obtained
from all participating subjects.
Interview
For the OIDP inventory to be administered among older
adults 50 years and above in Tanzania, translation into
Swahili language was mandatory (see additional file 1).
Kiswahili is the national and official language in Tanzania
and almost all (95%) Tanzanians speak the language pro-
ficiently. A structured interview schedule, including the
OIDP inventory, questions on socio-demographic charac-
teristics and other health-and oral health issues was con-
structed in English, translated into Kiswahili by two
Tanzanian professionals fluent in Kiswahili and English
and back translated into English by two independent
translators. Project staff at the MUCHS reviewed the OIDP
questionnaire for semantic, experiential and conceptual
equivalence to the source version. Sensitivity to culture
and selection of appropriate words were considered. After
being reviewed for content and face validity by panels of
Tanzanian academics, the Kiswahili version of the OIDP
inventory was compared with a de novo development of
oral impacts on daily performances generated through
focused group interviews with a sub-group of the study
participants. The interview schedule was piloted before
administration to identify questions which were not clear.
The interview was administered in the field by two trained
research assistants before the participants were clinically
examined.
The eight item OIDP index referred to difficulty carrying
out the eight daily life activities during the past six
months, (Table 1). Each frequency item (originally scored
0–5) was changed into 0–3 scores where (0) never, (1)
less than once a month, (2) once or twice a month up to
once or twice a week, (3) 3–4 times a week or more often
[18]. The OIDP severity scores were assessed on a 4-point
scale as follows; (0) not severe at all, (1) less severe, (2)
severe, (3) very severe. Finally the participants were asked
to identify the oral condition that caused the specific
impacts by answering for each reported item (1) yes or (0)
no to the following alternatives: "toothache, loose teeth,
gum abscess, bad breath and bleeding gums".
Performance scores representing the weighted impact on
each performance were calculated by multiplying fre-
quency (0–3) and severity scores (0–3). The overall OIDP
impact scores, OIDP-total, was the sum of all 8 weighted
performances (range 0–72). For the purpose of cross-tab-
ulation and logistic regression analyses, the OIDP-total
scores were dichotomized using a score of 1 or more as
cut-off. The distribution of the OIDP-total scores sup-
ported this cut-off point. Following the alternative scoring
method described by Gherunpong et al. [18], each
weighted performance score (range 0–9) was classified
into 6 levels of intensity; none, very little, little, moderate,
severe and very severe (Table 2). The overall intensity of
oral impacts for a person follows the same classification
and refers to the most severe impact on any of the 8 per-
formances or the highest performance score. Finally, the
extent of oral impacts, OIDP-extent, (range 0–8) was cal-
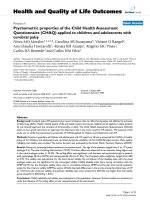
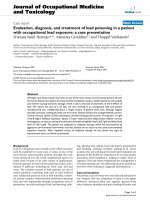
Tanzania: Kibaha and Bagamoyo districts (rural) in Pwani region and Kinondoni district (urban) in Dar es Salaam cityFigure 1
Tanzania: Kibaha and Bagamoyo districts (rural) in Pwani
region and Kinondoni district (urban) in Dar es Salaam city.
Health and Quality of Life Outcomes 2006, 4:56 />Page 4 of 11
(page number not for citation purposes)
culated as a simple count score (OIDP SC); i.e. summing
dichotomized frequency items in terms of (1) affected
(including the original categories 1,2,3) and (0) not
affected (including the original category 0). In order to
demonstrate the relative burden of impacts among those
affected, in this study we report on the intensity and extent
of oral impacts among those participants with an impact,
not on the whole sample. This means that for this purpose
we do not consider subjects scored as zero respectively
("none" for intensity, "not affected" for extent), as this
information is already provided by the prevalence figures.
The correlation coefficient (Spearman's Rho) between the
weighted OIDP-total on the one hand and OIDP SC sum
scores on the other was 0.97.
The predictor variables used in the analyses, their coding
and the number of subjects (%) according to categories
are depicted in Table 3. Socio-demographics were assessed
in terms of place of residence, gender and age. Family
wealth was assessed as an indicator of socio-economic sta-
tus in accordance with a standard approach in equity anal-
yses [19]. Household durable assets indicative of family
wealth (e.g. bicycle, television, car, motor cycle) assessed
as (1) available/in working condition, (2) not available/
available but not in working condition were analyzed in a
principle component analysis. The first component result-
ing from the analysis was used to divide households into
four approximate quartiles of wealth status ranging from
1
st
quartile (least poor) to 4
th
quartile (most poor). Self
reported oral health status was coded (1) very good, (2)
good, (3) average, (4) bad, (5) very bad and further
dichotomized into (1) good (original categories 1,2.3)
and (2) bad.
Clinical examination
One trained and calibrated dentist (IK) conducted all clin-
ical examinations in a shaded area with natural daylight as
the source of illumination and with an assistant recording
the observations. Research assistants for recording were
trained and calibrated before the main survey. Partici-
pants identified with problems that needed treatment
were referred or advised to seek treatment from the near-
est health care facility. Oral health education sessions
were provided for all the participating subjects. A full
mouth clinical examination, including 3
rd
molars was
conducted. Caries experience was assessed in accordance
with the criteria described by the World Health Organiza-
tion, WHO [20]. Number of teeth lost due to any reason was
calculated with the inclusion of edentulous people
(0.6%) and coded (1) 0–10, (2) 11–19 and (3) 20+. Tooth
mobility was assessed using a modified Miller's index [21],
whereby the ends of two instruments were placed on
either sides of the tooth and forces applied in bucco-lin-
gual/palatal direction and scored as present or absent. An
individual tooth mobility score was defined as (1) 2 or
more mobile teeth, (0) less than 2 mobile teeth. Posterior
premolar and molar occluding units, POU, were counted
based on existing natural tooth contacts between maxilla
Table 2: Classification of the intensity of oral impacts on a performance, after Gherunpong et al., 2004 [18].
Intensity Severity score Frequency score Performance score
Very severe (3) × (3) 9
Severe (3) × (2) 6
(2) × (3)
Moderate (2) × (2) 4
(3) × (1) 3
(1) × (3)
Little (2) × (1) 2
(1) × (2)
Very little (1) × (1) 1
No impacts (0) × (0) 0
Table 1: The Oral Impacts on Daily Performances index (OIDP).
During the past 6 months – how often have problems with your mouth and teeth caused you any difficulty in:
a. Eating and enjoying food
b. Speaking and pronouncing clearly
c. Cleaning teeth
d. Sleeping and relaxing
e. Smiling, laughing and showing teeth without embarrassment
f. Maintaining usual emotional state without being irritable
g. Carrying out major work or socio role
h. Enjoying contact with people
Health and Quality of Life Outcomes 2006, 4:56 />Page 5 of 11
(page number not for citation purposes)
and mandible in the bilateral regions. The number of
occluding units, POU, (with or without intact anterior
region) was categorized into (1) complete posterior
occluding support/10 functional occluding units, (2)
reduced posterior occluding support/1–9 occluding units
and (3) absence of bilateral occluding support. For analy-
sis, a dummy variable was constructed yielding, (1)
reduced occluding support (0–9 units) and (0) complete
occluding support (10 units). The distribution of the orig-
inally scored POU variable supported this cut off point.
Reproducibility
Duplicate clinical examinations were carried out on a ran-
domly selected sub-sample, considered to be representa-
tive of the study subjects. Analysis performed on the
duplicate examination recordings gave kappa statistics of
1.00 for missing teeth due to caries, decayed teeth and
occluding support. Kappa statistics of 0.77 and 0.79 were
provided with respect to mobile teeth and tooth loss due
to other reasons, respectively. These figures indicate a very
good intra-examiner reliability according to WHO [20].
Statistical analyses
Data were analyzed using SPSS version 13.0. Due to the
very low number of edentulous subjects in the material
(six subjects), edentate subjects were included in the anal-
ysis. Limiting the analyses to the dentate participants did
not change the results reported here. Cross tabulation and
chi-square statistics were used to assess bivariate relation-
ships. Internal consistency reliability was assessed using
Spearman's correlation coefficient and Cronbach's alpha.
To adjust for the effect of the survey design (strata and
clustering), re-analyses were conducted with STATA 9.0
using the svylogit command.
Results
Characteristics of participants
A total of 511 (participation rate 85.2%) urban and 520
(participation rate 86.7%) rural subjects between 50 and
100 years (mean age: 62.9, SD = 10.6, men: 46.4%, no for-
mal education: 44.7%), completed an extensive personal
interview followed by a full mouth clinical examination.
The prevalence of tooth loss (≥ 1 tooth due to any reason)
was 85.5% (mean tooth loss 6.1, SD = 6.4) in urban areas
and 82.1% (mean tooth loss 5.9, SD = 6.6) in rural areas
[22]. Table 3 gives the percentage distribution of partici-
pants' socio-demographic-, clinical-, and behavioral char-
acteristics in urban Kinondoni and rural Kibaha/
Bagamoyo districts.
Table 3: Frequency distribution of participants in urban (Kinondoni) and rural (Kibaha/Bagamoyo) districts of Tanzania according to
category on independent variables (n = 1031).
Urban Rural
Variables Categories (Code) % (n) % (n)
Age (years) 50–59 (1) 50.3 (257) 37.9 (197)
60–69 (2) 28.8 (147) 30.0 (156)
70+ (3) 20.9 (107) 32.1 (167)*
Gender Male (1) 42.7 (218) 50.0 (260)
Female (2) 57.3 (293) 50.0 (260)*
Wealth index 1
st
quartile-least poor 45.4 (232) 4.4 (23)
2
nd
quartile 40.1 (205) 8.8 (46)
3
rd
quartile 11.2 (57) 35.0 (182)
4
th
quartile – poorest 3.3 (17) 51.7 (269)*
Number of decayed teeth 0–1 (0) 54.0 (276) 44.6 (232)
2–22 (1) 46.0 (235) 55.4 (288)*
Posterior occluding units, 10 POU (1) 12.1 (62) 22.7 (118)
0–9 POU (2) 87.9 (449) 77.3 (402)*
Mobile teeth 0–1 (1) 83.8 (428) 77.3 (402)
2–25 (2) 16.2 (83) 22.7 (118)*
Self-reported oral health status Good (1) 74.4 (380) 54.4 (283)
Bad (2) 25.6 (131) 45.6 (237)*
Chewing ability All foods (1) 74.8 (382) 63.7 (331)
Soft/mashed only (2) 25.2 (129) 36.3 (189)*
Number of missing teeth 0–10 (1) 83.2 (425) 82.2 (427)
11–19 (2) 11.9 (61) 12.3 (64)
20+ (3) 4.9 (25) 5.6 (29)
* p ≤ 0.05.
The total number in the different categories did not add up to 1031 owing to missing values.
Health and Quality of Life Outcomes 2006, 4:56 />Page 6 of 11
(page number not for citation purposes)
OIDP validity and reliability
One subject omitted one OIDP frequency item. This small
number of missing responses adds support to the face
validity of the Kiswahili OIDP inventory successfully
addressed through focused group interviews and panel
reviews. Construct and criterion validity was demon-
strated in that the OIDP-total impact scores discriminated
in the expected direction between subjects who rated their
oral health status and chewing ability as good and bad
(Table 4). Moreover, as depicted in Table 4, the mean
OIDP total scores increased significantly with increasing
number of decayed teeth, reduced number of posterior
occluding units, increased number of mobile teeth (both
urban and rural) and increased number of missing teeth
(urban only). The association between the prevalence of
oral impacts (OIDP total >0) and factors known to be
associated with oral health; socio-demographic-, clinical
and behavioral variables were assessed using unadjusted
and adjusted logistic regression analysis (Table 5). There
was a statistically significant relationship (p < 0.001)
between the prevalence of oral impacts and place of resi-
dence, wealth index, self-reported oral health status,
chewing ability and a number of clinical oral health indi-
cators in the bivariate analysis. In the multiple logistic
regression analysis, age, number of POU's, self-rated oral
health and reported chewing ability remained statistically
significant predictors. The ORs for experiencing any oral
impact was 0.6, 1.7,7.7 and 3.2 if being older, having
reduced number of POU's, reporting bad oral health sta-
tus and reporting chewing problems, respectively.
Test-retest reliability of the OIDP inventory was not per-
formed due to ethical considerations, because oral health
education sessions were provided for all participants after
completion of the oral examination and because referrals
for treatment were given to those with an acute oral prob-
lem. Internal consistency reliability analysis showed
homogeneity of the OIDP-total items. In Kinondoni
(urban), the corrected item – total correlation coefficient
(i.e the correlation between each item and the total score
after omitting the item ranged between Spearman's rho
0.42 and 0.64 with a standardized Cronbach's alpha coef-
ficient of 0.83. In Kibaha/Bagamoyo (rural) the corrected
item total ranged from Spearman's rho 0.62 to 0.82 with
a Cronbach's alpha of 0.90 (Table 6).
Prevalence, extent, intensity and causes of OIDP
A total of 43.2% and 44.5% had impact scores of zero
(floor effect) using the OIDP ADD and the OIDP-total
scoring method, respectively. The corresponding ceiling
effects (proportions of adults who scored maximum) were
0.6% and 0.1%. As shown in Table 7 and 8, the prevalence
of oral impacts (OIDP total >0) was high, amounting to
51.2% and 62.1% in Kinondoni (urban) and Kibaha/Bag-
amoyo (rural), respectively. In both areas, impacts on eat-
ing were most prevalent (42.5% in urban and 55.1% in
rural) followed by cleaning teeth (18.2% in urban and
30.6% in rural), emotional stability (17.4% in urban and
30.4% in rural) and sleeping/relaxing (12.1% in urban
and 27.0% in rural). Impacts on social contacts, work and
smiling/showing teeth were the least prevalent impacts in
both areas (Tables 7, 8). However, they were still quite
Table 4: Construct and criterion validity of the OIDP-total scores: mean values for each category of grouping variable and differences
in mean rank (DMR). Mann Whitney U test and Kruskal Wallis test.
Urban (n = 508) Rural (n = 512)
Mean p DMR Mean p DMR
Oral health status
Good 2.1 3.6
Bad 8.9 0.001 142.3 15.6 0.001 167.2
Chewing foods
All kinds 2.5 5.3
Soft and mashed only 7.7 0.001 100.0 15.7 0.001 136.2
Decayed teeth
0–1 2.9 7.5
2–22 4.9 0.002 37.8 10.4 0.002 38.8
Occluding units
10 units 1.4 6.4
0–9 units 4.2 0.001 67.1 9.9 0.001 51.9
Number of missing teeth
0–10 3.6 8.3
11–19 4.6 13.3
20+ 6.2 0.492 26.1 11.0 0.001 59.8
Mobile teeth
0–1 3.5 8.2
2 or more 5.3 0.034 35.0 12.1 0.001 57.2
Health and Quality of Life Outcomes 2006, 4:56 />Page 7 of 11
(page number not for citation purposes)
prevalent; 5.9% of urban and 21.7% of rural participants
reported oral impacts in relation to social contacts, while
the figures for oral impacts in relation to smiling were
8.4% and 15.6%.
In terms of the extent of oral impacts among subjects with
impacts, in Kinondoni (urban) 47.3% had 1, 18.2% had
2 and 9.3% had 3 impacts. The corresponding figures in
Kibaha/Bagamoyo (rural) were 32.7%, 13.0% and 11.4%.
Few participants had 5 or more impacts.
In relation to the intensity of impacts, 6.0%, 14.0% and
4.3% of the participants in Kinondoni (urban) with
impacts on respectively, eating, smiling and cleaning, had
very severe impacts. Corresponding figures for eating,
cleaning, emotion and smiling were 8.7%, 10.1%, 9.5%
and 8.6% in Kibaha/Bagamoyo (rural). Mean scores of
impacts (range 0–9) on each of the 8 performances ranged
from 1.4 (eating) to 0.2 (working/social contact) in urban
areas and from 2.1 (eating) to 0.6 (smiling) in rural areas.
The distribution of the OIDP-total scores were skewed,
mean 3.8 (sd = 6.5, range 0–40) and mean 9.1 (sd = 13.3,
range 0–72) in urban and rural areas (Table 7, 8).
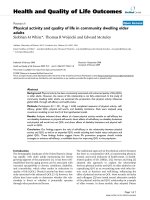
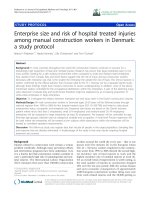
The oral problems perceived to cause the impacts on each
of the 8 performances are shown separately for urban and
rural residents in Fig. 2. In both areas, toothache and
loose teeth were the most frequently perceived causes of
impairments for almost all the performances. The major-
ity of impacts on cleaning teeth were caused by bleeding
gingiva and toothache in urban and rural areas, respec-
tively. Bad breath was the third most frequently reported
cause of impacts on speaking (among both urban and
rural subjects) and enjoying contact with people (rural
subjects), while bleeding gums was the third most fre-
quently reported cause of impacts on enjoying contact
with people in the urban areas.
Discussion
The present study applied for the first time a Kiswahili ver-
sion of the OIDP weighted inventory to a population of
older adults in urban and rural cultural settings of Tanza-
nia. This necessitated reestablishment of the psychometri-
cal properties and a further evaluation of the validity of
the OIDP scale. When used in personal interviews, the
Kiswahili OIDP was valid and reliable with psychometric
properties similar to the original English version [10,11]
Table 5: Odds ratios (ORs) and 95% Confidence Limits (CL) for having any oral impacts on daily performance (OIDP total >0)
according to clinical and non-clinical variables.
Unadjusted Adjusted
%(n) OR 95%CI OR 95% CL
Age (years): 50–59 57.1 (257) 1 1
60–69 50.7 (151) 0.8 0.5–1.1 0.6 0.4–0.8
70+ 58.1 (158) 1.0 0.7–1.4 0.7 0.4–1.0
Sex: Male 54.8 (258) 1 1
Female 56.1 (308) 1.0 0.8–1.3 0.9 0.6–1.2
Place: Urban 48.8 (248) 1 1
Rural 62.1 (318)** 1.6 1.2–2.1 1.2 0.9–1.7
Wealth: 1
st
least poor 50.2 (127) 1 1
2
nd
48.0 (120) 0.9 0.6–1.2 0.5 0.5–1.1
3
rd
59.1 (139) 1.4 1.0–2.0 0.5 0.5–1.1
4
th
most poor 63.8 (180)** 1.8 1.4–2.4 0.4 0.4–1.1
OHS: Good 38.0 (249) 1 1
Bad 86.8 (317)** 10.6 7.5–15.0 7.7 5.4–11.1
Chewing food: all 44.3 (313) 1 1
soft 80.6 (253)** 4.9 3.6–6.7 3.2 2.1–4.7
Decayed teeth: 0–1 49.5 (249) 1 1
2–22 61.3 (317)** 1.6 1.3–2.1 0.9 0.7–1.3
Missing teeth: 0–10 53.4 (449) 1 1
11–19 64.0 (80) 1.5 1.0–2.1 0.6 0.4–1.1
20+ 68.5 (37)* 1.8 1.0–3.2 0.6 0.2–1.3
Posterior Occl Units:
10 41.0 (73) 1 1
0–9 58.6 (493)** 2.0 1.4–2.8 1.7 1.2–2.6
Mobile teeth: 0–1 52.1 (428) 1 1
2 or more 69.3 (138)** 2.0 1.4–2.8 1.4 0.9–2.1
The total number in the different categories did not add up to 566 owing to missing values. ** p ≤ 0.001.
Health and Quality of Life Outcomes 2006, 4:56 />Page 8 of 11
(page number not for citation purposes)
and to the English version shown to be applicable with
Tanzanian students of higher education [13]. Internal
consistency reliability in terms of Cronbach's alphas of
0.83 (urban) and 0.90 (rural) were satisfactory and well
above the recommended levels of 0.70. Moreover, the cor-
rected item-total correlation coefficients, ranging from
Spearman's rho 0.42 to 0.64 in the urban area and from
Spearman's rho 0.62 to 0.82 in the rural area, were above
the minimum level of 0.20 for inclusion of an item into a
scale [23]. Cultural issues, in particular language might
give rise to problems with validity. Although no approach
guarantees cross-cultural equivalence, the Kiswahili OIDP
seemed to preserve the overall concepts of the English ver-
sion and did not differ in terms of sequence of questions,
the Likert scale and recall memory period used. Experi-
ence of the usability of the OIDP inventory across multi-
cultural populations of Tanzania, first applied in English
as a self-administered questionnaire [13] and recently in
Kiswahili as personal interviews provided further support
for the cross-cultural equivalence of this inventory.
Hypotheses regarding the construct and criterion validity
of the Kiswahili OIDP inventory were confirmed in that
the weighted scores varied systematically and in the
expected direction with self-reported oral health status
and perceived chewing ability (Table 4, 5). The validity of
the Kiswahili translation is supported by observations
similar to those in the UK [11], Thailand [4,5], Greece
[10] Norway[24] and among university students in Dar es
Salaam [13]. In addition, the OIDP scores were signifi-
cantly associated with various clinical measures (Table 4).
In a study of Greek adults 65 years and above, Tsakos et al
[2] reported significant associations between various clin-
ical indicators and OIDP, after adjusting for socio-demo-
Table 7: Prevalence (% OIDP SC >0), mean OIDP total impact scores and intensity (% of adults with oral impacts) of older Tanzanians
in urban areas (n = 508)
Overall Eating Speaking Cleaning Sleeping Smiling Emotion Work Contact
(n = 508) (n = 511) (n = 508) (n = 511) (n = 511) (n = 511) (n = 511) (n = 511) (n = 511)
OIDP
prevalence
%
51.2 42.5 9.1 18.2 12.1 8.4 17.4 7.6 5.9
OIDP impact score:
Range 0–40 0–9 0–6 0–9 0–6 0–9 0–9 0–6 0–6
Mean (sd) 3.8 (6.5) 1.4 (2.1) 0.3 (1.0) 0.5 (1.4) 0.4 (1.1) 0.3 (1.3) 0.5 (1.3) 0.2 (0.9) 0.2 (0.8)
Impact intensity
a
Very little 11.2 11.5 8.7 30.1 11.3 14.0 14.6 12.8 26.7
Little 22.0 31.8 43.5 29.0 19.4 25.6 38.2 30.8 26.7
Moderate 58.4 38.7 37.0 30.1 62.9 39.5 38.2 53.8 36.7
Severe 8.4 12.0 10.9 6.5 6.5 7.0 7.9 2.6 10.0
Very severe 0.0 6.0 0.0 4.3 0.0 14.0 1.1 0.0 0.0
a
Impact intensity:% of adults with impact.
Table 6: Internal consistency reliability of the Kiswahili version of the Oral Impacts on daily Performances (OIDP) inventory among
urban and rural participants: Corrected item total Spearman's correlation and Cronbach's alpha if item deleted
OIDP item Urban (n = 508) Rural (n = 512)
Corrected item total
correlation
Alpha if item deleted Corrected item total
correlation
Alpha if item deleted
1. Eating .46 .81 .62 .91
2. Speaking .54 .77 .70 .89
3. Cleaning .42 .78 .63 .91
4. Sleeping .64 .75 .77 .89
5. Showing teeth .56 .76 .63 .90
6. Emotion .64 .75 .82 .89
7. Work .51 .77 .78 .89
8. Social contact .59 .77 .79 .89
Standardised Cronbach's
Alpha
0.83 0.90
Health and Quality of Life Outcomes 2006, 4:56 />Page 9 of 11
(page number not for citation purposes)
graphic variables. An important finding of this study was
the relationship with number of POUs, a clinical indicator
reflecting both the number of posterior teeth present as
well as their function. Similar results have been reported
by Tsakos et al., [2], Srisilapanan and Sheiham [12],
Locker and Slade [25], Gilbert et al. [26] and Sarita et al
[27]. Clinical measures have traditionally been excluded
from previous validations of the OIDP instrument
[10,11]. The rationale behind the decision to omit clinical
variables is derived from the conceptual distinction
between health and disease [28,29]. Consistent with this
reasoning and with findings reported previously [13], the
self-rated oral health status and reported chewing ability
associated more strongly with the OIDP impact score than
did the measures of clinical indicators. According to the
results depicted in Table 5, the ORs for having any oral
impact was 7.7 if reporting bad oral health status, 3.3 if
eating soft foods only and 1.7 if having reduced number
of POUs.
As shown in Table 5, rural- and poor participants scored
higher on the OIDP inventory than their urban- and less
poor counterparts. Accordingly, Srisilapanan [12] found
older Thai adults with a high income to be more likely to
have low OIDP scores while their counterparts with low
income tended to have high OIDP scores. This finding is
similar to those observed with other indicators, showing
that reducedOHRQoL is most commonly recorded in
socially and economically disadvantaged groups [29]. An
inverse relationship between OIDP and age emerged in
multivariate analysis when allowing for the effects of
other variables (Table 5). Similar results have been
observed in Norway, with a different age classification sys-
tem and might reflect the changes in expectations occur-
Percentage of the main oral problems causing an impact on the eight performances according to place of residenceFigure 2
Percentage of the main oral problems causing an impact on
the eight performances according to place of residence.
TA, 82
TA, 79
TA, 37
TA, 98
TA, 59
TA, 76
TA, 95
TA, 86
TA, 77
LT, 22
LT, 17
LT, 8
LT, 15
LT, 14
LT, 19
LT, 20
LT, 23
LT, 17
GA, 9
GA, 11
GA, 8
GA, 10
GA, 7
GA, 4
GA, 5
GA, 10
GA, 8
BB, 5
BB, 11
BB, 4
BB, 5
BB, 7
BB, 8
BB, 13 BB, 13
BB, 8
BG, 10
BG, 6
BG, 64
BG, 8
BG, 9
BG, 7
BG, 10
BG, 17
BG, 16
Urban
Eating Speaking Cleaning Relaxing Smiling Emotion Work Contact Total
TA, 87
TA, 84
TA, 74
TA, 97
TA, 85
TA, 93
TA, 98
TA, 91
TA, 88
LT, 38
LT, 28
LT, 38
LT, 29
LT, 36
LT, 35
LT, 31
LT, 29
LT, 33
GA, 13
GA, 10
GA, 13
GA, 13
GA, 11
GA, 15
GA, 16
GA, 15
GA, 13
BB, 15
BB, 16
BB, 14
BB, 13
BB, 16
BB, 16
BB, 14
BB, 20
BB, 16
BG, 18
BG, 12
BG, 39
BG, 11
BG, 20
BG, 16 BG, 13
BG, 17
BG, 18
Rural
Abbreviations:
T
A- Toothache; LT- Loose tooth; GA- Gum abscess; BB- Bad breath: BG-
Bleeding gums
Table 8: Prevalence (% OIDP SC >0), mean OIDP-total impact score-, and impact intensity scores (% of adults with impacts) of older
Tanzanians in rural areas (n = 512)
Overall Eating Speaking Cleaning Sleeping Smiling Emotion Work Contact
(n = 512) (n = 519) (n = 514) (n = 520) (n = 519) (n = 520) (n = 520) (n = 520) (n = 520)
OIDP prevalence %62.155.120.830.627.015.630.422.521.7
OIDP impact score:
Range 0–72 0–9 0–9 0–9 0–9 0–9 0–9 0–9 0–9
Mean (sd) 9.1 (13.3) 2.1 (2.6) 0.9 (1.9) 1.3 (2.3) 1.1 (2.1) 0.6 (1.7) 1.2 (2.2) 0.9 (1.9) 0.9 (1.9)
Impact intensity
a
Very little 11.9 18.1 11.2 12.6 7.9 11.1 14.6 7.7 7.1
Little 15.8 18.4 12.1 13.8 17.1 13.6 19.6 21.4 21.2
Moderate 60.7 32.6 40.2 35.8 50.0 50.6 36.7 47.9 43.4
Severe 11.8 22.2 29.9 27.7 18.6 16.0 19.6 15.4 22.1
Very severe 0.0 8.7 6.5 10.1 6.4 8.6 9.5 7.7 6.2
a
Impact intensity:% of adults with impact.
Health and Quality of Life Outcomes 2006, 4:56 />Page 10 of 11
(page number not for citation purposes)
ring with increasing age [30]. Recently, Locker and Gibson
[31] found that half of the elderly subject investigated
who described their oral health as poor, were still satisfied
with their oral health status, a finding that was attributed
to changes and adjustment of values and expectations in
later life.
About one-half of the urban and rural subjects inter-
viewed had experienced at least one oral impact during
the past 6 months. The estimates obtained compares to
the prevalence of impacts reported in Thai populations of
younger (35–44 years) (73%) and older adults (52%)
[5,12]. The present prevalence is higher, however, than
that reported among older adults (67–79 years) in a
national survey from Norway (18%) [24] as well as in
Great Britain (12.3%) [11] and Greek (39.1%) [10] den-
tate older populations using the same socio-dental indica-
tor. Further research is required to examine whether the
differences in prevalence of OIDP between occidental and
non-occidental societies are related to differences in den-
tal status or in culture specific responses to dental impair-
ments.
Consistent with previous studies and across age groups,
eating was the most commonly reported aspect of OHR-
QoL [13,30,32]. The percentage of impacts related to eat-
ing observed among younger and older Tanzanian adults
were similar to those observed in comparable age groups
of younger and older Thais, but much higher than the
impacts of dentate adults from Greece (29.9%), UK
(7.0%) and Norway (11.3%) [10,11,24]. More than half
of the urban and rural adults with impacts reported hav-
ing very little, little and moderate intensity, indicating that
despite their relatively high prevalence, the reported
impacts were not severe. In urban adults, impacts in rela-
tion to smiling and showing teeth were more severe than
impacts on other performances, whereas in rural adults
cleaning was the most severe impact followed by emo-
tional stability and eating. Consistent with results
obtained among Thai adults [4,5], toothache and loose
teeth were the most frequently reported reasons for
impacts from eating.
It should be noted that the accuracy of reporting perceived
impairments and symptoms in population based studies
might be limited. Another caveat might be the OIDP
inventory using a recall period of 6 months and relying on
self-reports which implies it can be prone to recall bias.
Compared to shorter recall periods longer recalls might
result in an underestimation of health consequences but
might provide valid estimates for severe outcomes [33].
This might be the case with the OIDP covering ultimate
impacts thus essentially measuring the disabilities and
handicaps.
Conclusion
The Kiswahili OIDP inventory had acceptable psychomet-
rical properties among non-institutionalized adults 50
years and above in urban and rural areas of Tanzania. The
impacts affecting their performances were relatively com-
mon but not very severe. Numerous dental problems con-
tribute to the overall impact assessed among elderly
Tanzanians in this study. To increase the applicability of
the OIDP inventory in need assessment approaches and
dental service planning, condition specific impacts should
be assessed to support clinical measures of standard treat-
ment needs.
Competing interests
The author(s) declare that they have no competing inter-
ests.
Authors' contributions
IK: Principal investigator, conceived of the study,
designed the study, collected data, statistical analysis and
manuscript writing
ANÅ: Main supervisor, designed study, statistical analysis,
manuscript writing
GS: Participated in design of study and manuscript writ-
ing
JM: Participated in design of study, data collection and
manuscript writing
GT: Have commented on the paper and provided valuable
guidance for the OIDP scoring system
All authors read and approved the final manuscript
Additional material
Acknowledgements
This study was financially supported by the Faculty of Dentistry and the
Centre for International Health, University of Bergen and Statens Lånekas-
sen, Norway. The authors would like to thank Professor Ola Haugejorden
for valuable comments upon an earlier version of this article. The authors
would like to acknowledge the Local administrative authorities, the College
Research and Publication committee of the Muhimbili University College of
Health Sciences (MUCHS), Tanzania and REK VEST of Norway, for giving
Additional File 1
OIDP – Toleo la Kiswahili. The file provided is the Kiswahili version of
the oral impacts on daily performances (OIDP) index.
Click here for file
[ />7525-4-56-S1.doc]
Publish with BioMed Central and every
scientist can read your work free of charge
"BioMed Central will be the most significant development for
disseminating the results of biomedical research in our lifetime."
Sir Paul Nurse, Cancer Research UK
Your research papers will be:
available free of charge to the entire biomedical community
peer reviewed and published immediately upon acceptance
cited in PubMed and archived on PubMed Central
yours — you keep the copyright
Submit your manuscript here:
/>BioMedcentral
Health and Quality of Life Outcomes 2006, 4:56 />Page 11 of 11
(page number not for citation purposes)
permission to conduct this study. Thanks to the research assistants for
their tireless work in the field.
References
1. Slade GD, Strauss RP, Atchison KA, Kressin NR, Locker D, Reisine
ST: Conference summary: assessing oral health outcomes
measuring health status and quality of life. Community Dent
Health 1998, 15(1):3-7.
2. Tsakos G, Marcenes W, Sheiham A: The relationship between
clinical dental status and oral impacts in an elderly popula-
tion. Oral Health Prev Dent 2004, 2(3):211-220.
3. Locker D: Oral health and quality of life. Oral Health Prev Dent
2004, 2 Suppl 1:247-253.
4. Adulyanon S, Vourapukjaru A, Sheiham A: Oral impacts on daily
performances. In Measuring Oral Health and Quality of Life Edited by:
Slade GD. Chapel Hill , University of North Carolina, Dental Ecology;
1997:152-160.
5. Adulyanon S, Vourapukjaru J, Sheiham A: Oral impacts affecting
daily performance in a low dental disease Thai population.
Community Dent Oral Epidemiol 1996, 24(6):385-389.
6. Badley EM: The ICIDH: format, application in different set-
tings, and distinction between disability and handicap. A cri-
tique of papers on the application of the International
Classification of Impairments, Disabilities, and Handicaps.
Int Disabil Stud 1987, 9(3):122-125.
7. Locker D: Measuring oral health: a conceptual framework.
Community Dent Health 1988, 5(1):3-18.
8. Allen PF, Locker D: Do item weights matter? An assessment
using the oral health impact profile. Community Dent Health
1997, 14(3):133-138.
9. McGrath C, Bedi R: Why are we "weighting"? An assessment of
a self-weighting approach to measuring oral health-related
quality of life. Community Dent Oral Epidemiol 2004, 32(1):19-24.
10. Tsakos G, Marcenes W, Sheiham A: Cross-cultural differences in
oral impacts on daily performance between Greek and Brit-
ish older adults. Community Dent Health 2001, 18(4):209-213.
11. Sheiham A, Steele JG, Marcenes W, Tsakos G, Finch S, Walls AW:
Prevalence of impacts of dental and oral disorders and their
effects on eating among older people; a national survey in
Great Britain. Community Dent Oral Epidemiol 2001, 29(3):195-203.
12. Srisilapanan P, Sheiham A: The prevalence of dental impacts on
daily performances in older people in Northern Thailand.
Gerodontology 2001, 18(2):102-108.
13. Masalu JR, Astrom AN: Applicability of an abbreviated version
of the oral impacts on daily performances (OIDP) scale for
use among Tanzanian students. Community Dent Oral Epidemiol
2003, 31(1):7-14.
14. Braine T: More oral health care needed for ageing popula-
tions. Bull World Health Organ 2005, 83(9):646-647.
15. Gherunpong S, Sheiham A, Tsakos G: A sociodental approach to
assessing children's oral health needs: integrating an oral
health-related quality of life (OHRQoL) measure into oral
health service planning. Bull World Health Organ 2006,
84(1):36-42.
16. Gherunpong S, Tsakos G, Sheiham A: A sociodental approach to
assessing dental needs of children: concept and models. Int J
Paediatr Dent 2006, 16(2):81-88.
17. Lwanga SKLS: Sample size determinants in health studies. A
practical manual. World Health Organization; 1990.
18. Gherunpong S, Tsakos G, Sheiham A: The prevalence and sever-
ity of oral impacts on daily performances in Thai primary
school children. Health Qual Life Outcomes 2004, 2:57.
19. Victora CG, Fenn B, Bryce J, Kirkwood BR: Co-coverage of pre-
ventive interventions and implications for child-survival
strategies: evidence from national surveys. Lancet 2005,
366(9495):1460-1466.
20. World Health Organization: Oral health survey: Basic meth-
ods. Geneva ; 1997.
21. Laster L, Laudenbach KW, Stoller NH: An evaluation of clinical
tooth mobility measurements. J Periodontol 1975,
46(10):603-607.
22. Kida IA, Astrom AN, Strand GV, Masalu JR: Clinical and socio-
behavioral correlates of tooth loss: a study of older adults in
Tanzania. BMC Oral Health 2006, 6(1):5.
23. Streiner DL, Norman GR: Health measurement scales : a prac-
tical guide to their development and use. In Oxford medical pub-
lications 2nd edition. Oxford , Oxford University Press; 1995:VIII, 231
s
24. Astrom AN, Haugejorden O, Skaret E, Trovik TA, Klock KS: Oral
Impacts on Daily Performance in Norwegian adults: validity,
reliability and prevalence estimates. Eur J Oral Sci 2005,
113(4):289-296.
25. Locker D, Slade G: Oral health and the quality of life among
older adults: the oral health impact profile. J Can Dent Assoc
1993, 59(10):830-3, 837-8, 844.
26. Gilbert GH, Foerster U, Duncan RP: Satisfaction with chewing
ability in a diverse sample of dentate adults. J Oral Rehabil 1998,
25(1):15-27.
27. Sarita PT, Witter DJ, Kreulen CM, Van't Hof MA, Creugers NH:
Chewing ability of subjects with shortened dental arches.
Community Dent Oral Epidemiol 2003, 31(5):328-334.
28. Locker D, Miller Y: Subjectively reported oral health status in
an adult population. Community Dent Oral Epidemiol 1994,
22(6):425-430.
29. Tsakos G, Marcenes W, Sheiham A: Evaluation of a modified ver-
sion of the index of Oral Impacts On Daily Performances
(OIDP) in elderly populations in two European countries.
Gerodontology 2001, 18(2):121-130.
30. Astrom AN, Haugejorden O, Skaret E, Trovik TA, Klock KS: Oral
Impacts on Daily Performance in Norwegian adults: the
influence of age, number of missing teeth, and socio-demo-
graphic factors. Eur J Oral Sci 2006, 114(2):115-121.
31. Locker D, Gibson B: Discrepancies between self-ratings of and
satisfaction with oral health in two older adult populations.
Community Dent Oral Epidemiol 2005, 33(4):280-288.
32. Astrom AN, Okullo I: Validity and reliability of the Oral
Impacts on Daily Performance (OIDP) frequency scale: a
cross-sectional study of adolescents in Uganda. BMC Oral
Health 2003, 3(1):5.
33. Moshiro C, Heuch I, Astrom AN, Setel P, Kvale G: Effect of recall
on estimation of non-fatal injury rates: a community based
study in Tanzania. Inj Prev 2005, 11(1):48-52.