báo cáo hóa học:" Psychological approach to successful ageing predicts future quality of life in older adults" pdf
Bạn đang xem bản rút gọn của tài liệu. Xem và tải ngay bản đầy đủ của tài liệu tại đây (254.81 KB, 10 trang )
RESEARCH Open Access
Psychological approach to successful ageing
predicts future quality of life in older adults
Ann Bowling
1*
, Steve Iliffe
2
Abstract
Background: Public policies aim to promote well-being, and ultimately the quality of later life. Positive perspectives
of ageing are underpinned by a range of appraoches to successful ageing. This stud y aimed to investigate whether
baseline biological, psychological and social aproaches to successful ageing predicted future QoL.
Methods: Postal follow-up in 2007/8 of a national random sample of 999 people aged 65 and over in 1999/2000.
Of 496 valid addresses of survivors at follow-up, the follow-up response rate was 58% (287). Measures of the
different concepts of successful ageing were constructed using baseline indicators. They were assessed for their
ability to independently predict quality of life at follow-up.
Results: Few respondents achieved all good scores within each of the approaches to successful ageing. Each
approach was associated with follow-up QoL when their scores were analysed continuously. The biomedical (health)
approach failed to achieve signi ficance when the traditional dichotomous cut-off point for successfully aged (full
health), or not (less than full health), was used. In multiple regression analyses of the relative predictive ability of each
approach, only the psychological approach (perceiv ed self-efficacy and optimism) retained significance.
Conclusion: Only the psychological approach to successful ageing independently predicted QoL at follow-up.
Successful ageing is not only about the maintenance of health, but about maximising one ’s psychological
resources, namely self-efficacy and resilience. Increasing use of preventive care, better medical management of
morbidity, and changing lifestyles in older people may have beneficial effects on health and longevity, but may
not improve their QoL. Adding years to life and life to years may require two distinct and different approaches,
one physical and the other psychological. Follow-up health status, number of supporters and social activities, and
self-rated active ageing also significantly predicted QoL at follow-u p. The longitudinal sample bias towards healthy
survivors is likely to underestimate these results.
Background
The current generation of ageing adul ts expects to age
well, and to maintain their general well-being and, ulti-
mately, enhance the quality of later life. Most people
aged 50 and 65 and more rate themselves as ageing well,
or successfully, and few rate as high their chances of
becoming housebound, losing their memory or entering
a nursing home [1,2]. These positive perspectives reflect
a shift away from a predominantly pathological perspec-
tive of later life, which exaggerated the extent to which
chronic i ll-health could be attributed to ageing, and
which largely ignored the heterogeneity of the older
population. A more positive view of old age sees it as a
period of opportunity and well-being, with retention, or
development, of the psychological resources to cope with
life’schallenges[3].Thiscoincideswithworld-widepol-
icy interest in the promotion of physical and mental well-
being in populat ions, and the compression of m orbidity
into fewer years of later life, driven by concerns about
increasing expenditure on health and social care in an
ageing society. Althoug h there is an awareness that well-
being has no clearly defined op posite, and that it is more
than the absence of ‘ill-being’, there are no agreed defini-
tions, other than that it is a ‘good thing’ [4,5]. Policy
guidance, including that in the UK, prefers to focus on
specific aspects of well-being that are potentially amen-
able to known interventions, including physical activity
* Correspondence:
1
Faculty of Health and Social Care, St George’s, University of London and
Kingston University, St George’s, University of London, Cranmer Terrace,
London SW17 ORE, UK
Full list of author information is available at the end of the article
Bowling and Iliffe Health and Quality of Life Outcomes 2011, 9:13
/>© 2011 Bowling and Iliffe; licensee BioMed Centr al Ltd. This is an Open Access article distributed under the terms of the Creative
Commons Attribution License ( /by/ 2.0), which permits unrestricted use, distribution , and
reproduction in any medium, provided the origina l work is properly cited.
(e.g. exercise) to maintain mental and physical function-
ing, hence well-being [6], rather than a s a dynamic,
multi-faceted state which includes more complex subjec-
tive, social, and psychological dimensions. There are
however exceptions to such reductionist views [7,8]. For
example, NHS Scotland (2006) [8] defined the state of
mental well-being broadly, encompassing subjective and
psychological feelings of life satisfaction, optimism, self-
esteem, mastery and feeling in control, havi ng a purpose
in life, a sense of belonging and support. This is more
consistent with the long tradition of social research on
general well-being, dating back to the 1950s [1].
The current, international policy focus on promotion
of well-being has stimulated interest in quality of life
(QoL) as an outcome indicator. QoL has long been used
as an outcome measure in the evaluation of a diverse
range of health a nd social care interventions. It is a
multi-faceted, concept, encompassing macro societal
and socio-demographic influences and also micro con-
cerns, such as individuals’ expe riences, social circum-
stances, health, values and perceptions [1]. As it is
subjective, it needs grounding in people’sownvalues
and perceptions.
Much of the focus on how to enhance the quality of
later life has been on th e achievement of successful age-
ing, by promoting different approaches, ranging from
biomedical, as i n the MacArthur Studies of Successful
Aging [9-11], to broader social,-psychological and lay-
based approaches [3,12]. These overlap with concepts of
‘active ageing’ [13]. The criteria necessary for achieving
successful ageing, described in the literature, can be
grouped into five approaches: biological (i.e. ‘health’),
broader biological (i.e. health and social engagement),
social, psychological and lay. These have have been
reviewed in detail in a cross-disciplinary systematic
review of successful ageing [3], and their construction
for the research reported here is summarised next (the
measurement scales are described later under Methods):
• Biomedical (i.e. health): Comprised summing of:
having diagnosed, chronic medical conditions (actual
number reported); ability to perform activities of
daily living (ADL) (originally no/little difficulty was
originally scored <10, with the remainder scoring a
range of levels of difficulty); psychiatric morbidity
measured using the General Health Questionnaire-
12 (GHQ-12) (original caseness was scored as 5 or
more, with no problems as 0-4).
• Broader biomedical (i.e health and social
engagement): Comprised summing of th e above
plus number of different s ocial activities engaged in
during past month (3+), as an index of social
engagement.
• Social functioning:Comprisedsummingofnum-
ber of different social activities engaged in during
past month, frequency of social contacts, number of
helpers/supporters.
• Psychological resources: Comprised summing of
self-efficacy score (best score was less than an orig i-
nal score of 11), best optimism score (of less than an
original score of 6), plus GHQ-12 items on sense of
purpose: playing useful part; coping: facing up to
problems, overcoming difficulties; self-esteem: feels
has self-confidence and has self-worth.
• Lay: Comprised summing of the above (note:
GHQ-12 items were counted once only given their
overlap across models, to avoid singularity being vio-
lated by double summing), plus gross annual income
and perceived social capital [rating of area facilities
(e.g. transport, closeness to shops, services), area
problems (e.g. crime, vandalism, graffiti, speed and
volume of traffic, air quali ty), somewhere nice to go
for a walk, feels safe walking alone during the day or
night].
Biological (or health) approaches to achieve successful
ageing have been def ined as the avoidance of disease and
risk fac tors, maintenance of physical and cognitive func-
tioning and active engagement with life [ 9]. Some b iolo-
gical appraoches are broader, also inc luding numbers
of different social activities engaged in during past month
(i.e. health and social engagement). Current social
approaches include maintenance of high levels of social
activity, interaction and participation [14]; and psycholo-
gical approaches emphasise psychological resources for
coping with the challenges of ageing over time (e.g. per-
ceived self-efficacy, control over life, ability to compen-
sate for declining abilities [15,16]. While biological
approaches have been the most often investigated [3],
broader approaches, including psycho-social factors
accord more closely with lay views of successful ageing
[2] that include income and environmental quality and
safety. In cross-se ctional analyses such broader biological
approaches are also associated with people’sself-rated
quality of life [12]. These have been reviewed in depth by
Bowling [3].
In earlier work on alternate criteria of successful ageing,
we reported that broader approaches predicted self-rated
QoL more powerfully than unidimensional approaches,
and should be used to evaluate the outcomes of health
promotion interventions in the older population [12]. This
paper investigates the predictive ability of these different
biological, psychological and social approaches of success-
ful ageing on QoL over time, using a national random
sample of people aged 65 and over who were followed up
7-8 years later.
Bowling and Iliffe Health and Quality of Life Outcomes 2011, 9:13
/>Page 2 of 10
Methods
A postal follow-up survey of community-dwelling people
aged 65 and over who had responded to four face-to-
face interview surveys about QoL during 1999/2000.
The sample was derived from four quarterly Office for
National Statistics Omnibus Surveys during 2000-1,
sampled quarterly from a small us er postcode sampling
frame across Britain, with geographic and socio-eco-
nomic stratification.
Omnibus Survey respondents aged 65 and over were
asked whether they would be willing to be re-inter-
viewed by ONS interviewers for our module on QoL.
Those who consented were re- interviewed two months
later. Of the sample of 1,299 eligible respondents sifted
by Omnibus S urvey staff, the overall response rate was
77% (999), 19% refused and 4% were not contactable.
The characteristics of the baseline sample w ere broadly
representative of people aged 65 and o ver living at
home in Britain and have been reported in detail [1].
After removing the addresses of non-survivors identified
from flagging che cks at NHS Central Registry), survivors
aged 65 and over at baseline were mailed a further postal
questionnaire in 2007-8 (n- = 553), containing measures
of QoL, active ageing, h ealth, psych-social and economic
circumstances. Of these 553 mailings, relatives replied and
informed us that a further five sample members had died,
and the Royal Mail returned a further 52 envelopes (9% of
the 553 mailings) as ‘person not at/unknown at that
address. Apart from sample flagging at ONS Central Reg-
istry, although there will be a time lag before revisions are
received, l ogged and released, all baseline respondents
were also given a Freepost card on which to notify us of
changes of address. As the follow-up study was postal,
there was no opportunity for interviewers to approach
neighbours for information about moves.
A t otal of 287 completed questionnaires were returned
by respondents. The raw response rate at final follow-up,
then, was 287 out of 553 mailed: 52%. The response was
52% if deaths were removed from th e denominator (302/
553 minus 5 deaths = 287/548). The valid response rate
of 287 questi onnaires returned out of 496 valid addresses
(removing both 5 deaths and 52 untr aced respondents
from the denominator = base = 496) was 58%.
Sample attrition is inevitable in longitudinal surveys of
older adults, where the most vulnerable and ill members
of the sample will have died, leaving the healthiest sam-
ple members. The follow-up sample was, by definition, a
sample of survivors. As the main source of non-response
was death, baseline characteristics of survivors and
deceased sample membe rs by follow-up were compared.
These confirmed the expectation that the deceased
respondents were more likely than survivors to be older,
male, and less likely to rate their health optimally. For
example, of those who died by follow-up: 58% (133)
were in the oldest age group 75+, compared with 37%
(283) of survivors (Chi-square:55.260, 3df, p = 0.001);
58% (132) were male, compared with 45% (343) of survi-
vors (Chi-square: 12.139, 1df, p = 0.001); and 59% (135)
had rated their health at baseline as ‘Excellent/Very
good’, compared with 77% (590) of survivors (Chi-
square: 29.338, 1df, p = 0.001). Hence , the results pre-
sented here need to be interpreted with caution, given
the healthier survivor bias.
Thesample(287)wasinitiallyweightedbyONSto
correct for the unequal probability of small households
(in which people aged 65 and over usually live) being
included in the sample and this increased the effective
sample size to n = 302.
The baseline study was granted ethical committee
consent by London MREC and ONS Omnibus ethics
committee; the follow-up study was granted ethnical
committee consent to proceed by University College
London Research Ethics Committe e, and registered with
UCL Clinical Governance.
Measures
QoL was the dependent variable, measured using the fol-
low-up QoL measure: the Older People’s Quality of Life
Questionnaire (OPQOL). The OPQOL was designed to be
multi-dimensional, and was developed directly from older
people’s views on the main compo nents of QoL [1,17]. It
had 32 items with 5-point Likert scales (’Strongly Agree’
to ‘Strongly Disagree’), representing: life overall (4 items),
health (4 items), social relationships and participation (7
items), independence, control over life, freedom (5 items),
area: home and neighbourhood (4 items), psychological
and emotional well-being (4 items), financial circum-
stances (4 items). Items are scored with higher scores
equalling higher QoL; the scale ranges from 32 to 160; cut
off points indicate levels of quality of life [17]. The
OPQOL had good psychometric properties when tested
on independent population and ethnically diverse sample
surveys in Britain; it had better reliability and validity over-
all than other QoL instruments [17]. Cronbach’salphas
for the OPQOL was a 0.901, and thus satisfied the a: 0.70
< 0.90 threshold for internal consistency: a: 0.901 [17].
The variables selected for the construction of the alter-
nate approaches to successful ageing (see Box 1) were
dichotomised into ‘good’ and ‘not good’ scores. The
number of good scores for each item included (see
below) was used to represent successful ageing for the
different approaches. Both numbers of good scores
within each approach, as well as traditional cut-off points
(achieving all or mostly good scores for the indicators
included within an approach [9]) were analysed. The bio-
medical ap proach was thus a sum of positive responses,
Bowling and Iliffe Health and Quality of Life Outcomes 2011, 9:13
/>Page 3 of 10
indicating no problems to physical and psychological
health va riables (diagnosed, chronic medical condition s,
activities of daily living, no psychological morbidity using
the General Health Questionnaire-12 [18]). The social
functioning approach comp rised summing of: num ber of
different social activities engaged in during past month,
frequency of social contacts, and number of helpers and
supporters. The psychological resources approach
involved summing of positive self-efficacy score, best
optimism score, and positive responses to General Health
Questionnaire-12 (GHQ-12) [18] items measuring sense
of purpose, coping, self-confidence and self-worth (these
items were removed when the biological, social and psy-
chological approaches we re entered together in a multi-
variate analyses to examine their independent predictive
ability). In addition to the GHQ-12 [18], the psycho-
social variables above were measured with validated
scales of social support [19], perceived neighbourhood
environment [20], self-efficacy [21], optimism-pessimism
[22], and items measuring soci al ac tivities, lone liness, life
expectations, risk perceptions, and social comparisons.
Physical health and functioning was measured with
Townsend’s [23] physical functioning [activities of daily
living (ADL)] scale; self-rated health; and diagnosed med-
ical conditions. Standard socio-demographic and eco-
nomic items were also included in the questionnaire.
These included age, sex, socio-economic status (NS-
SEC), housing tenure, gross annual income, age left full-
time education, highest education qualification, house-
hold size, and marital status. Indicators of successful age-
ing were selected after examination of the literature
[3,12].
Statistical analysis
The OPQOL was selected on the basis of its multi-
dimensionality as the outcome indic ator against which to
test the independent predictive ability of the approaches
to successful ageing. The OPQOL was developed from
open-ended responses to questions about quality of life
at baseline, and tested in the follow-up survey. Thus
there was thus no baseline multidimensional measure of
OPQOL.
Item non-response was minimal at baseline. The range
of baseline item-non-response was16-21 out of the 999
respondents. This was due to the baseline study being a
face-to-face interview survey, conducted by trained
interviewers from the office of National Statistics (and
whose training emphasised the importance of item
response). The follow-up item response was less good as
the mode was self-completion (postal). The range of fol-
low-up item non-response was 55-58 out of the 302
weighted sample (287 raw sample size)
Univariate analyses included frequency distributions,
Spearman’s rho correlations, means, and chi-square tests.
The Spearman rank correlation coefficient is calculated
on occasions when it is not possible to give actual values
to variables, but only to assign a rank order to instances
of each variable. Sex was coded in rank order (0, 1) it was
therefore legitimate to use this method.
Linear multiple regression analysis was used for model
comparison in relation to quality of life outcomes (after
checks for multicollinearity). The ability of theoretically
relevant variables to independently predict successful
ageing classifications was tested. There are inconsistent
associations in the literature between socio-demographic
variables and indicators of well-being, including quality
of life, and these were included last (to control for their
effects) [1]. A hierarc hical approach was used, with
entry of independent variables in theoretical order of
importance. The level for statistica l significance was set
at 0.05. Item non-response was small, although
cumulative.
The scales and items included in the baseline measures
of successful ageing, were conceptually distinct from the
lay-based ‘OPQOL’ at follow-up. They did not over-cor-
relate by more than 0.60, and satisfied criteria for multi-
collinearity. For example, the baseline measures were
more objectiv e indicators (e.g. number of chronic condi-
tions to number of social contacts). In contrast, the fol-
low-up OPQOL was subjective and contained evaluative
items (e.g. feelings of needing (more) companionship).
The multiple regression analysis was limited to testing
the biomedical (i.e. health), social and psychological
approaches, as independent predictors of quality of life,
as they overlapped in content with the broader biomedi-
cal (i.e. health and social engagement) and the multidis-
ciplinary lay approaches.
Results
Characteristics of sample
The baseline sample was evenly divided between men and
women, just under two thirds, were aged 65 < 74, and the
remainder were aged 75 and over; most were married
although over a quarter were widowed; and a third lived
alone; Less than half had an income of £7,280 or more.
The vast majority of respondents were white, as would be
expected in a national sample of people aged 65 and over
[1]. At follow-up, 17% (47) of the sample we re aged 65 <
75; the remainder were all aged 75 and over. Over half of
the sample comprised women (54%, 152). In addition, 49%
(138) we re marri ed or cohabiting compared wit h being
single or widowed; 49% (137) lived alone, rather than with
others, and 85% (239) were owner-occupiers.
Quality of life
OPQOL scores at follow-up were slightly positively
skewed: 7% (17) scored as QoL as bad as can be (<11)
and 12% (29) scored at the most optimum QoL end of
Bowling and Iliffe Health and Quality of Life Outcomes 2011, 9:13
/>Page 4 of 10
the scale (140+). The mean OPQOL score was 121.385;
standard deviation 14.048 (scale r ange 32-160, with
higher scores equating with better QoL). The QoL sub-
scales on which respondents scored most positively
were home and neighb ourho od, followed by psychologi-
cal well-being and outlook (36% (10 6) and 30% (87)
respectively scored ‘QoL as good as can be’). The areas
that they scored worst on were health and functioning
and financial circumstances (21% (58) and 15% (45)
respectively scored ‘QoL as bad as can be’). This may be
expected with the decline in health and financial
reserves that often accompany older age. The se areas
also had the lowest mean sub-scale scores. There were
no significant differe nces in mean score or subscale
scores and age or sex of respondents.
Successful ageing
Approaches to conceptualising successful ageing are tra-
ditionally constructed with dichotomous cut-off points
(successfully aged, or not), with t he requirement that, to
be categorised as successfully aged, individuals should
have met the criteria for successful ageing on each
indicator included [9]. For this study, as stated earlier,
both numbers of good scores within each approach, as
well as traditional, dichoto mous cut-off points indicating
success were analysed. At both baseline and follow-up,
the sample distributions were skewed positively towards
people achieving higher numbers of good scores within
all except the lay approach to successful ageing (which
had a normal distribution). However, few achieved all
good scores within each approach, in dicating that tradi-
tional approaches are unrealistic as they exclude most
people.
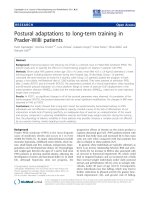
Table 1 shows the associations between baseline
approaches to successful ageing, using traditional cut-
offs for success (all or mostly good scores on each indi-
cator in the approach), and follow-up OPQOL. The
smaller numbers in the successfully aged groups are
shown. Only the narrow biomedical (health) approach
failed to achieve statistical significance a t the 0.05 level
with OPQOL categories.
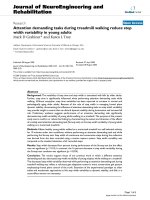
Continuous scores for the measures of successful age-
ing were also analysed in relation to OPQOL scores. All
approaches were then significantly associated with
Table 1 Baseline successful ageing+ by follow-up OPQOL++
Successful ageing+++: OPQOL: Quality of life is:
So bad could not be worse
scores <99
Middle scores
100-119
So good could not be better
scores 120+
% (n) % (n) % (n)
Successful ageing biomedical (health)
Not successfully aged 81 (13) 70 (64) 60 (75)ns
Successfully aged on all 3/3 indicators 19 (3) 30 (27) 40 (50)
Successful ageing broader biomedical (health and
social engagement)
Not successfully aged 88 (14) 73 (66) 62 (77)*
Successfully aged on all 4/4 indicators 13 (2) 28 (25) 38 (48)
Successful ageing psychological
Not successfully aged 100 (16) 85 (78) 72 (90)**
Successfully aged on all 7/7 indicators —— 15 (14) 28 (35)
Successful ageing social
Not successfully aged 81 (13) 57 (53) 38 (47)***
Successfully aged on all 3/3 indicators 19 (3) 43 (40) 62 (78)
Successful ageing lay
Not successfully aged (<10) 100 (13) 81 (70) 50 (61)***
Successfully aged on 10-13 indicators —— 19 (16) 50 (60)
No. of responders 13-14 91-93 125
NS not statistically significant using Chi-square tests at least at 0.050; * p < 0.05; ** p < 0.01; *** p < 0.001; Caution in interpretation is required where there are less
then 5 counts per cell.
+Recoded baseline scores; ++OPQOL scores grouped at follow-up.
+++ Biomedical (health): sum of (1 problem, 0 no problem) no diagnosed, chron ic medical conditions, no problems with activities of daily living, no psychiatric
morbidity (GHQ-12 with 5+ cut-off); broader biomedical model (health and social engagement): sum of: the above plus number of different social activities engaged in
during past month (3+), as an index of social engagement; social functioning model: sum number of different social activities engaged in during pas t month (as above
3+), frequency of social contacts score (1-8), helped/supported in all 5 areas of life asked about.; psychological resources model: sum of self-efficacy score (best <11),
best optimism score (<6), plus best ratings on single GHQ items (3, 6, 8, 10, 11) on: sense of purpose: playing useful part; coping: facing up to problems, overcoming
difficulties; self-esteem: feels has self-confidence, has self-worth. Lay model: sum of all the above (note: duplicated items between above models counted once) plus
gross annual income (>£7280), and optimal perceived social capital scores (ratings of area facilities, e.g. transport, closeness to shops, services, area problems, e.g.
crime, vandalism, graffiti, speed and volume of traffic, air quality, somewhere nice to go for a walk, feels safe walking alone during the day or night).
Bowling and Iliffe Health and Quality of Life Outcomes 2011, 9:13
/>Page 5 of 10
OPQOL, indicating that traditionally used cut-offs in
approaches to successful ageing are less sensitive to
quality of life (Table 2). The t able also shows that fol-
low-up social and psychological variables (except cop-
ing) were associated with OPQOL scores. Age but not
sex was also associated with OPQOL, as was socio-
economic status. The final column displays the correla-
tions for those who had died between baseline interview
and follow-up. Each approach to successful ageing,
except the full and reduced psychological approach, was
significantly correlated with mortality.
Multivariable analyses
It was not possible to enter all five approaches to suc-
cessful ageing into a single linear multiple regression
analysis, due to overlap between their items, compro-
mising their independence. First, in order to examine
their contribution to explained variation in OPQOL
scores, each approach to successful ageing was entered
singl y into separate multiple regression s of predictors of
OPQOL, along with the same follow-up variables.
Results were similar for each approach to successful
ageing, when entered separately, and each was highly
significant. The proportions of explained variance in
OPQOL scores were: 56% for biomedical (health)
(Adjusted R
2
0.564; p = 0.0001); 57% for broader biome-
dical (health and social engagement) (Adjusted R
2
0.567;
p = 0.0001); 58% for psychological (Adjusted R
2
0.576;
p = 0.0001); 57% for social (Adjusted R
2
0.571; p =
0.0001); 60% for the lay approach (multidimensional
incorporating each model (Adjusted R
2
0.598; p =
0.0001).
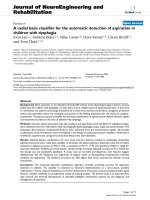
In order to assess their independent, relative contribu-
tion to OPQOL scores, the successful ageing approaches
with independent (non- overlapping) items were entered
into a single multiple regression together, a long with
follow-up items. The approaches entered together were
the biomedical (health), the psychological (minus the
items which overlapped with the GHQ in the biological
approach) and the social approach to successful ageing.
Table 3 shows the full regression model and Table 4
shows the statistics for the reduced model (the variables
which lost significance in model 1 were removed and
the model was then rerun). Despite the significance of
each when entered into a model alone, when entered
together only the psychological approach to successful
ageing retained significance. Thus the biological (health)
and social appraoches lost significance in this combined
regression model. Mirroring the results of the single
regressions of each approach to successful ageing, the
Table 2 Spearman’s correlations with baseline successful ageing (continuous scores)
Baseline: OPQOL total score at
follow-up 32 items:
Died between baseline and
follow-up interview
Successful ageing biomedical (health) raw score 0.361** -0.159**
Successful ageing broader biomedical (health and social engagement) raw score 0.401** -0.138**
Successful ageing psychological raw score 0.337** -0.032 ns
Successful ageing psychological model raw score reduced - self-efficacy and optimism
only, minus GHQ items on self worth/confidence
0.206** -0.026 ns
Successful ageing social raw score 0.315** -0.157**
Successful ageing lay raw score 0.489** -0.138**
Follow-up:
Self-rated health status - Excellent to Poor Likert scale 0.480** NA
ADL raw score -0.507** NA
No. of people who comfort/support 0.397** NA
No. of different social activities in last month 0.537** NA
Self-rated ageing actively -0.582** NA
Efficacy- can handle whatever comes Likert scale 0.373** NA
Efficacy: Can solve most problems- Likert scale 0.365** NA
Coping methods - has identified method/none -0.034 ns NA
Socio-demographic/economic:
Age - continuous -0.227** 0.229**
Sex 0.088 ns 0.110**
NS-SEC classes 0.194** -0.031 ns
Married/not+ 0.148* 0.060 ns
ns not statistically significant at least at 0.050; *0.05; **p < 0.01 using Chi-square tests NA not applicable; + follow-up status married for OPQOL column and baseline
married status for mortality column.
Bowling and Iliffe Health and Quality of Life Outcomes 2011, 9:13
/>Page 6 of 10
only follow-up predictor variables which retained signifi-
cance were health status, social support, social activity
and self-rated active ageing.
In the final multiple regression analysis of the relative
predictive ability of independent biomedical (health),
psychological and social approaches to successful ageing,
only the baseline psychological approach (perceived self-
efficacy and optimism) retained statistical significance.
Socio-demographic and economic variables were not
significant in the model. Follo w-up self-rated health but
not physical functioning was also signifi cant, as were
social support and participation and self-rated active
ageing. Follow-up perceived problem solving abilities did
not retain significance in the final regression model. The
amount of explained variance in OPQOL scores by the
variables entered was significant, and high at 60%.
Discussion
Theaimoftheanalysespresentedherewastoexamine
whether baseline appraoches to successful ageing pre-
dicted QoL, at follow-up 7-8 years on. Biomedical
(health) approaches to successful ageing are the most
widely used and published. Promotion of QoL tends to
be framed in conventio nal medical terms of mental and
physical health. However, the longitudinal results pre-
sented here caution against over-reliance on sole biome-
dical (health) approaches to successful ageing. In the
multiple regression analyses of the relative predictive
ability of independent biomedical (health), psycho logical
and social approaches to successful ageing, only the
baseline psychological approach (perceived self-efficacy
and optimism) retained significance. While baseline ana-
lyses found that the multidisciplinary lay approach
(which incorporated the other approaches) was the
strongest predictor of a global quality of life (measured
using a single, global item question), these earlier ana-
lyses examined each approach in separate regressions
(12). The results present ed here differed from the base-
line analyses, as, for this paper, each approach was
entered into the same regression analysis (hence over-
lappin g approache s had to be excluded as they were not
independent - the broader biological (health and social
engagement) and the lay approach).
Huppert’s (2008) [5] review of ment al capital and well-
being e mphasised the importance of the influence early
environmental factors on mental well-being, as well as
Table 3 Full linear multiple regression of predictors of OPQOL+
Independent predictor variables Unstandardised B Standardised
Beta
95% confidence
interval
(2-tailed
t-test)
P=
Block 1:
R
2
change 0.254, p = 0.0001
Baseline approaches to successful ageing
SA biological (health) 0.198 0.013 –1.607-2.004 (0.217) 0.829
SA psychological 1.514 0.154 0.458-2.570 (2.827) 0.005
SA social 1.665 0.112 1.134-3.196 (2.145) 0.033
Block 2:
R
2
change 0.306, p = 0.0001
Follow-up health and social circumstances:
Self-rated health status, compared to others of same
age
0.062 0.192 0.026-0.098 (3.406) 0.001
Number of people can turn to for comfort/support 0.524 0.172 0.232-0.816 (3.538) 0.001
Number of social activities 0.014 0.194 0.005-0.023 (2.971) 0.003
Self-rated active ageing -4.645 -0.330 0.6.410–2.880 (-5.190) 0.001
Block 3:
R
2
change 0.022, p = 0.070 ns
Age 0.041 0.091 -0.182-2.264 (0.359) 0.720
Sex 1.520 0.054 -1.229-4.269 (1.091) 0.277
NS-SEC 4.686 0.130 1.271-8.101 (2.707) 0.007
Housing tenure (follow-up) 0.105 0.005 -1.898-2.109 (0.103) 0.918
Marital status (follow-up) -0.031 -0.003 -1.191-1.130 (-0.052) 0.958
Constant 100.960
R
2
0.560
Adjusted R
2
0.545
Anova F statistic; p = 22.462; 0.0001
Bowling and Iliffe Health and Quality of Life Outcomes 2011, 9:13
/>Page 7 of 10
external circumstances, but concluded that individuals’
actions and attitudes may have a greater influence.
Hence, enhancement of well-being requires interventions
to enc ourage positive attitudes and behaviours over the
life course. Howev er, evidenc e i ndicates that self-efficacy
and reliance can also be nurtured in later life [24,25].
This study of influences o n QoL outcomes supports the
literature on the imp ortance of building up one’s psycho-
logical resources in order to cope effectively with the
challenges of ageing, given that it is difficult for very
elderly people, who are frail, to function physically at
optimal levels and retain high levels of activity [16,26].
The narrowness of a dichotomous approach to having
successfully aged (on all indicators) or not was also illu-
strated by the minorities of people who h ad all good
scores within each a pproach. This limited approach can
stigmatise and marginalise older people with disabilities
[27]. A continuous approach to conceptualisation and
measurement is preferable. In sin gle model regression
analyses the dichotomised b iological (health) approach
was also less sensitive to QoL outcomes.
Policy makers aimi ng to prom ote wellb eing, successful
ageing and QoL in ageing populations should consider
people’s psychological resources, rather than only their
health, functional, a ctivity levels or social circumstances
(whi ch deserve attention fo r other reas ons). QoL is often
Table 4 Reduced linear multiple regression of predictors of OPQOL
Independent predictor variables Unstandardised B Standardised Beta 95% confidence
interval
(2-tailed t-test) P =
Block 1:
R
2
change 0.311, p = 0.0001
Baseline approaches to successful ageing
SA biological (health) (n. chronic conditions,
ADL, GHQ-12 score)
0.039 0.053 1.273-3.352 (0.888) 0.376
SA psychological (for this regression self-
efficacy and optimism only - minus GHQ items
on self-worth and confidence as GHQ-12
included in biological model)
3.562 0.177 1.530-5.593 (3.462) 0.001
SA social (n. different social activities, n. areas
supported in, face to face contact score)
1.155 0.066 -0.759-3.069 (1.192) 0.235
Block 2:
R
2
change 0.304, p = 0.0001
Follow-up health and social circumstances:
Self-rated health status, compared to others of
same age
0.055 0.160 0.012-0.099 (2.529) 0.012
Physical functioning (activities of daily living/
mobility score)
-0.011 -0.078 0.034-0.110 (-1.019) 0.310
Number of people can turn to for comfort/
support
0.654 0.176 0.288-1.020 (3.525) 0.001
Number of social activities 0.013 0.169 0.003-0.024 (2.474) 0.014
Self-efficacy - problem solving 2.165 0.090 -0.384 - -4.714 (1.677) 0.095
Self-rated active ageing -4.443 -0.313 -6.513 - -2.373 (-4.238) 0.001
Block 3:
R
2
change 0.012, p = 0.397 ns
Age 0.170
0.049
-0.212-0.552 (0.878) 0.381
Sex 0.261
0.009
-2.920-3.410 (0.878) 0.381
NS-SEC -0.718
-0.095
1.481-0.045 (-1.857) 0.065
Housing tenure (follow-up) 0.887
0.038
-1.411-3.185 (0.762) 0.447
Marital status (follow-up) -0.107
-0.008
-1.420-1.206 (0.161) 0.872
Constant 93.794
R
2
0.627
Adjusted R
2
0.595
Anova F statistic; p = 19.700; 0.0001
Reduced model: significant variables only, with control variables, re-entered).
+Baseline approaches to successful ageing with follow-up health and psychosocial variables, controlling for socio-demographic/economic characteristics (full model).
Bowling and Iliffe Health and Quality of Life Outcomes 2011, 9:13
/>Page 8 of 10
seen as an outcome of service activities, such as encoura-
ging uptake of prevent ive care, or m odifying lifestyles.
For example, the US Centre for Disease Control focuses
its efforts on impro ving QoL by promoting healthy life-
style, be haviors, increasing the use of clinical preventi ve
services, addressing cognitive impairment, addressing
issues related to mental health and pro vide education on
decision making related to end-of-life planning (http://
cdc.gov/chron icdisease/resources/publications/aag /aging.
htm - link valid 03-03-2011). Promoting psychological
resources is crucial for optimising both ageing well or
successfully, and enhancing the quality of later life,
enabling older people to feel confident in living in their
own homes, and with wider benefits to society.
The limitat ion of the studymustalsobeacknowl-
edged. The survey used statistically robust sampling
methods, and the response rates were fairly good in an
era of declining response to surveys. Sample attrition is
inevitable in longitudinal surv eys, especially in older
sample members, where the most vulnerable and ill
members of the sample will have died or dropped out,
leaving the healthiest sample members. In a follow-up
study of older people there is inevitably a healthy survi -
vor effect among the respondents. Hence the results
relate to a sample of survivors, and cannot necessarily
be generalised across older populations. While the char-
acteristics of respondents were comparable with popula-
tion estimates from the last census, non-response was
still a potential source of bias. The respondents who
had died since baseline were more likely to be older,
male and to have wors e baseline heath status. Follow-up
health status, along with number of su pporters and
social activities, and self-rated active ageing, also signifi-
cantly predicted QoL at follow-up. Thus the longitudinal
sample bias towards healthy survivors is likely to under-
estimate these results.
There was some positivity bias in ratings of QOL and
successful ageing. This was not unexpected. Lawton’s
(2001) [28] theory of emotion-regulation argued that
older people are more likely than younger people to reg-
ulate affect, and minimise the negative, while maximis-
ing the positive. There is some supporting evidence for
this theory, although results are inconsistent.
In conclusion, our findings suggest that healthy ageing is
not simply about physical or mental health maintenance,
but rather about maximising psychological resources,
namely self-efficac y and resilience. Increasing use of pre-
ventive care, better medical management of morbidity and
changing lifestyles in older people may have beneficial
effects on wider health and longevity, but may not
improve their quality of life. Adding years to life and life
to years may require two distinct and different approaches,
one physical and the other psychological. A psychological
approach includes perceived self-efficacy, self-esteem and
self worth, confidence, optimism, purpose in l ife, coping,
facing up to problems and overcoming difficulties. Only
the psychological approach to successful ageing indepen-
dently predicted quality of life at follow-up.
Abbreviations
OPQOL: Older People’s Quality of Life Questionnaire; QOL: quality of life
Acknowledgements
Thanks are due to ONS Omnibus Survey staff for mounting the baseline
Quality of module, and processing the data. Material from the ONS Omnibus
Survey, made available through ONS, has been used with the permission of
the Controller of The Stationery Office. We also thank members of the study
advisory group, Ms Corinne Ward for her administration of the QoL postal
follow-up survey and data processing. Members of ONS Omnibus Survey
who carried out the original baseline analysis and collection of the data
hold no responsibility for the further analysis and interpretation of them. The
baseline study was funded by ESRC Growing Older Programme; grant
reference number L480254003; also part-funded by grants, held
collaboratively with Professors Christina Victor (PI) and John Bond
(L480254042; Loneliness and Social Isolation, ESRC Growing Older Research
Programme), and by Professor Shah Ebrahim (Medical Research Council
Health Services Research Collaboration (Health and Disability). The follow-up
study was funded by the UK cross research council New Dynamics of
Ageing Programme; we are grateful for their support: New Dynamics of
Ageing Research Programme; grant reference number: RES-352-25- 0001.
Author details
1
Faculty of Health and Social Care, St George’s, University of London and
Kingston University, St George’s, University of London, Cranmer Terrace,
London SW17 ORE, UK.
2
Department of Primary Care and Population
Sciences, University College London, Hampstead Campus, London NW3 2PF,
UK.
Authors’ contributions
AB carried out the statistical analyses, and wrote the initial draft of this
paper. SI contributed significantly to developing the idea for the study, and
to subsequent drafts of this paper; he had access to the data. AB conceived
of the study, had full access to all the data in the study and takes
responsibility for the integrity of the data and the accuracy of the analyses.
Both authors have read and approved the submitted manuscript.
Competing and financial interests
The authors declare that they have no competing interests.
Received: 24 October 2010 Accepted: 9 March 2011
Published: 9 March 2011
References
1. Bowling A: Ageing well. Quality of life in old age. Maidenhead: Open
University Press; 2005.
2. Bowling A, Dieppe P: What is successful ageing and who should define
it? Br Med J 2005, 331:1548-1551.
3. Bowling A: Aspirations for older age in the 21
st
century: what is
successful ageing? International J Aging Human Dev 2007, 64:263-297.
4. Ereant G, Whiting R: What do we mean by wellbeing? And why does it
matter? Linguistic landscapes Department of Children, Schools and Families.
Research report DCSF-RWO 73, London; 2008.
5. Huppert FA: Mental capital and well-being: making the most of
ourselves in the 21
st
century. State-of-science review. Psychological well-
being: evidence regarding its causes and consequences. SR-X2. London:
Government Office for Science Foresight project; 2008.
6. National Institute for Health and Clinical Excellence: Mental wellbeing and
older people. Guidance for occupational therapy activity interventions
to improve the mental wellbeing of older people. London, NICE public
health guidance 16. London: NICE; 2008.
7. Department of Health: Confident communities, brighter futures. A
framework for developing well-being. New Horizons. London, DH; 2010.
Bowling and Iliffe Health and Quality of Life Outcomes 2011, 9:13
/>Page 9 of 10
8. NHS Scotland: Mental health improvement programme, background and
policy context. NHS Scotland; 2006 [o], link valid
03-02-2011.
9. Rowe JW, Kahn RL: Successful aging. New York: Pantheon Books; 1998.
10. Seeman TE, Berkman LF, Charpentier PA, Blazer DG, Albert MS, Tinetti ME:
Behavioral and psychosocial predictors of physical performance:
MacArthur Studies of successful aging. J Gerontol 1995, 50A:M177-M183.
11. Reuben DB, Judd-Hamilton L, Harris TB, Seeman TE: The associations
between physical activity and inflammatory markers in high-functioning
older persons: MacArthur Studies of Successful Aging. J Am Geriat Soc
2003, 51:1125.
12. Bowling A, Iliffe S: Which model of successful ageing should be used in
epidemiological surveys? Baseline findings from a British survey of
ageing. Age Ageing 2006, 35:607-14.
13. Bowling A: Perceptions of active ageing in Britain: divergences between
minority ethnic and whole population samples. Age Ageing 2009,
38:703-710.
14. Silverstein M, Parker MG: Leisure activities and quality of life among the
oldest old in Sweden. Res Aging 2002, 24:528-547.
15. Ryff CD: Successful aging: a developmental approach. Gerontologist 1982,
22:209-14.
16. Baltes P, Baltes M: Psychological perspectives on successful aging: the
model of selective optimisation with compensation. In Successful aging:
perspectives from the behavioral sciences. Edited by: Baltes P, Baltes M. New
York: Cambridge University Press; 1990.
17. Bowling A, Stenner P: Psychometric properties of the Older People’s
Quality of Life Questionnaire. Which measure performs best with older
people. Journal of Epidemiology and Community Health 2011, 65:273-80.
18. Goldberg DP, Williams P: A user’s guide to the General Health
Questionnaire. Windsor: NFER-Nelson; 1988, 2.
19. Sherbourne CD, Stewart AL: The MOS social support survey. Soc Sci Med
1991, 32:705-14.
20. Cooper K, Arber S, Fee L, Ginn J: The influence of social support and
social capital on health: a review and analysis of British data. London:
Health Education Authority; 1999.
21. Schwarzer R: Measurement of perceived self-efficacy: psychometric scales
for cross-cultural research. Berlin: Free University of Berlin, Institute for
Psychology; 1993.
22. Scheier MF, Carver CS: Optimism, coping and health: assessment and
implications of generalised outcome expectancies. Health Psychology
1985, 4:219-47.
23. Townsend P: Poverty in the United Kingdom. Harmondsworth: Pelican;
1979.
24. Lorig KR, Ritter PL, Laurent DD, Fries JR: Long-Term Randomized
Controlled Trials of Tailored-Print and Small-Group Arthritis Self-
Management Interventions. Medical Care 2004, 42:346-354.
25. Lorig KR, Ritter PL, Jacquez A: Outcomes of border health Spanish/English
chronic disease self-management programs. Diabetes Educator 2005,
31:401-9.
26. Ouwehand C, De Riddera DTD, Bensinga JM: A review of successful
ageing models: proposing proactive coping as an important additional
strategy. Clin Psychol Rev 2007, 27:873-84.
27. Minkler M, Fadem P: Successful ageing: a disability perspective. Journal of
Disability Policy Studies 2002, 12:229-235.
28. Lawton MP: Emotion in later life. Curr Direct Psychological Sci 2001,
10:120-123.
doi:10.1186/1477-7525-9-13
Cite this article as: Bowling and Iliffe: Psychological approach to
successful ageing predicts future quality of life in older adults. Health
and Quality of Life Outcomes 2011 9:13.
Submit your next manuscript to BioMed Central
and take full advantage of:
• Convenient online submission
• Thorough peer review
• No space constraints or color figure charges
• Immediate publication on acceptance
• Inclusion in PubMed, CAS, Scopus and Google Scholar
• Research which is freely available for redistribution
Submit your manuscript at
www.biomedcentral.com/submit
Bowling and Iliffe Health and Quality of Life Outcomes 2011, 9:13
/>Page 10 of 10