báo cáo hóa học: " Towards a brief definition of burnout syndrome by subtypes: Development of the “Burnout Clinical Subtypes Questionnaire” (BCSQ-12)" doc
Bạn đang xem bản rút gọn của tài liệu. Xem và tải ngay bản đầy đủ của tài liệu tại đây (375.29 KB, 12 trang )
RESEARCH Open Access
Towards a brief definition of burnout syndrome
by subtypes: Development of the “Burnout
Clinical Subtypes Questionnaire” (BCSQ-12)
Jesús Montero-Marín
1,2
, Petros Skapinakis
3,4
, Ricardo Araya
3
, Margarita Gili
5
and Javier García-Campayo
1*
Abstract
Background: Burnout has traditionally been described by means of the dimensions of exhaustion, cynicism and
lack of eficacy from the “Maslach Burnou t Inventory-General Survey” (MBI-GS). The “Burnout Clinical Subtype
Questionnaire” (BCSQ-12), comprising the dimensions of overload, lack of development and neglect, is proposed as
a brief means of identifying the different ways this disorder is manifested. The aim of the study is to test the
construct and criterial validity of the BCSQ- 12.
Method: A cross-sectional design was used on a multi-occup ational sample of randomly selected university
employees (n = 826). An exploratory factor analysis (EFA) was performed on half of the sample using the
maximum likelihood (ML) method with varimax orthogonal rotation, while confirmatory factor analysis (CFA) was
performed on the other half by means of the ML method. ROC curve analysis was preformed in order to assess
the discriminatory capacity of BCSQ-12 when compared to MBI-GS. Cut-off points were proposed for the BCSQ-12
that optimized sensitivity and specificity. Multivariate binary logistic regression models were used to estimate effect
size as an odds ra tio (OR) adjusted for sociodemographic and occupational variables. Contrasts for sex and
occupation were made using Mann-Whitney U and Kruskall-Wallis tests on the dimensions of both models.
Results: EFA offered a solution containing 3 factors with eigenvalues > 1, explain ing 73.22% of variance. CFA
presented the following indices: c
2
= 112.04 (p < 0.001), c
2
/gl = 2.44, GFI = 0.958, AGFI = 0.929, RMSEA = 0.059,
SRMR = 0.057, NFI = 0.958, NNFI = 0.963, IFI = 0.975, CFI = 0.974. The area under the ROC curve for ‘overload’ with
respect to the ‘exhaustion’ was = 0.75 (95% CI = 0.71-0.79); it was = 0.80 (95% CI = 0.76-0.86) for ‘lack of
development’ with respect to ‘cynicism’ and = 0.74 (95% CI = 0.70-0.78) for ‘neglect’ with respect to ‘inefficacy’. The
presence of ‘overload’ increased the likelihood of suffering from ‘exhaustion’ (OR = 5.25; 95% IC = 3.62-7.60); ‘lack
of development’ increased the likelihood from ‘cynicism’ (OR = 6.77; 95% CI = 4.79-9.57); ‘neglect’ increased the
likelihood from ‘inefficacy’ (OR = 5.21; 95% CI = 3.57-7.60). No differences were found with regard to sex, but there
were differences depending on occupation.
Conclusions: Our results support the validity of the definition of burnout proposed in the BSCQ-12 through the
brief differentiation of clinical subtypes.
Keywords: burnout, subtypes, BCSQ-12, factorial validity, criterial validity
* Correspondence:
1
Department of Psychiatry. University of Zaragoza. REDIAPP (Research
Network on Preventative Activities and Health Promotion, RD06/0018/0017).
Spain
Full list of author information is available at the end of the article
Montero-Marín et al. Health and Quality of Life Outcomes 2011, 9:74
/>© 2011 Montero-Marín et al; licensee BioMed Central Ltd. This is an Open Access article distributed under the terms of the Creative
Commons Attribution License ( which permits unrestricted use, distribution, and
reproduction in any medium, provided the original work is pr oper ly cited.
Background
Burnout syndrome is considered a uniform condition with
relatively consistent aetiology and symptoms resulting
from prolonged exposure to chronic stressors in the work-
place [1]. This syndrome tends to be given standard opera-
tionalization through the “ Maslach Burnout Inventory
General Survey” (MBI-GS) by means of the dimensions of
‘exhaustion ’, ‘cynicism’ and professional ‘ ineffica cy’ [2].
‘Exhaustion’ is the feeling of not being able to offer a ny
more of oneself at a n emot ional level; ‘cynicism’ is con-
templated as a distant attitude towards work; and ‘ineffi-
cacy’ is the feeling of not performing tasks adequately.
Clinical experience, however, shows that burnout is
manifested in different ways that can be classified depend-
ing on the level of dedication with which individuals cope
with work-related tasks [3,4]. The “frenetic” burnout sub-
type is characterized by the investment of a large amount
of time to work and is common in highly involved, ambi-
tious and overloaded individuals. ‘ Involvement’ is the
investment of every effort required to overcome difficul-
ties; ‘ambition’ is a great need to obtain important success
and achievements at work; and ‘overload’ is risking one’s
own health and neglecting of one’s own personal life in
the pursuit of good results [4-7]. The “underchallenged”
burnout subtype is influenced by the o ccupation typ e. It
appears in indiffere nt an d bore d individuals who do not
find personal development in their work. ‘Indifference’ is
lack of concern, interest and enthusiasm in work-related
tasks; ‘boredom’ is caused by the understanding of work as
a mechanical and routine experience with little variation
in activities; and ‘lack of development’ is the absence of
personal growth experiences for individuals together with
their desire for taking on other jobs where they can better
develop their skills [4-7]. The “worn-out” burnout subtype
is determined by the rigidity of the organizational struc-
ture of an individual’s workplace and is characterized by a
lack of control over results, lack of recognition for efforts
and neglect of responsibilities. ‘ Lack of control’ is the
feeling of helplessness as a result of dealing with many
situations that are beyond their control; ‘lack of acknowl-
edgement’ is
the belief that the organizations those indivi-
duals work for fail to take their efforts and dedication into
account; and ‘neglect ’ refers to ind ividuals ’ disregard as a
response to any difficulty [4-7].
This conceptualization of burnout , operationalized
through the “Burnout Clinical Subtype Questionnaire”
(BCSQ-36), is very useful for the specific evaluation of
the syndrome and for the design of treat ment strategies
depending on the characteristics of each clinical case.
This is practicable given that it provides a broader fra-
mework th at exce eds the pos sibilities for evaluation and
intervention implicit in the standard design of the MBI-
GS, which is more directed towards a unified (although
three-dimensional) definition of the syndrome [7,8].
The dimensions of ‘overload’, ‘lack of development’ and
‘neglect’, belonging to the subtypes of “ frenetic”, “under-
challenged” and “worn-out”, respectively, could construct
a brief definition of burnout that is able to bring the typo-
logical perspective of the BC SQ-36 closer to the MB I-GS
standard [8]. T hese dimensions have been proposed as a
definition of burnout th at could cover common g round
between the typological and standard approaches, and
have been selected as a result of a second order factor ana-
lysis, carried out between the dimensions of BCSQ-36 and
MBI-GS taken together [1,2,4,7,8]. These dimensions
showed good discriminant validity, which makes them
very useful for the brief identification of clinical subtypes
of burnout [8]. H owever, it is necessary to explore and
confirm the structure of this new definition, in view of the
fact that it groups the items of the original scale in a differ-
ent way. It will also be necessary to analyse its criterion
validity because this new design reduces the extent of the
initial typological definition.
The main objectives of this study were to test the factor-
ial struct ure of the differential design proposed by means
of the dimensions of ‘overload’, ‘lack of development ’ and
‘neglect’ through the BCSQ-12, and to estimate its discri-
minatory strength compared to the dimensions of ‘exhaus-
tion’, ‘cynicism’ and ‘inefficacy’ of the MBI-GS standard.
We also p roposed to evaluate the internal consistency of
the dimensions and possible differences caused by gender
and occupation.
Method
Design and study population
A cross-sectional design was utilized by means o f the
self-report technique through an online q uestionnaire
completed by selected subjects who had provided
informed consent.
The study population was comprised of the entire work-
force of the University of Zaragoza in employment in Jan-
uary 20 08 (N = 5,493). The sample size w as c alculated
with a 95% confidence interval and a margin of error of
3.5%. The prevalence of burnout was estimated at 18% [9],
giving a result of 427 subjects. As t he expected response
rate in web-mail surveys is approximately 27% [10,11], and
in order to perform both an exploratory and confirmatory
factor analysis on the different groups, 3,200 employees
were selected by stratified probability sampling with pro-
portional allocation by o ccupation (58% teaching and
research staf f or ‘ TRS’ , 33% administration and service
personnel or ‘ASP’ and 9% trainees or ‘TRA’).
The participants’ tot al final sample (n
T
=826)was
divided randomly into two equal halves (n
1
=413and
n
2
= 413). T he size of the resulting sub-samples per-
mitted the establi shed margin of error to be maintained
and exceeded the construct validity evaluation criterion,
making it possible to perform the analysis on both
Montero-Marín et al. Health and Quality of Life Outcomes 2011, 9:74
/>Page 2 of 12
groups with psych ometric adjustment [12-15]. The sam-
ple size calculation, subject selection and sample divi-
sion were performed with Epidat 3.1. software.
Procedure
An e-mail was sent to the selected subjects explaining the
aims of the research. This message contained a link to an
online questionnaire and two access passwords that
enabled the subjects to complete the questionnaire dur-
ing the month of February 2008. The first page of t he
protocol again provided another explanation of the aims
of the study, the participants to whom it was addressed,
the v oluntary nature of participation in it, possible bene-
fits/risks entailed and the confidentiality of information
given. All participants received an anonymous report
with an explanation of their results. The project was
approved by the regional Clinical Research Ethics Com-
mittee of Aragon.
Measurements
Sociodemographic and Occupational factors
Subjects were first asked a set of questions dealing with
socio-demographic and occupational characteristics
including: age, sex, whether they were in a stable rela-
tionship (‘yes’ vs ‘no’), level of education (‘secondary or
lower’ , ‘university degree’ , ‘do ctorate’ ), occupat ion type
(‘TRS’, ‘ASP’ , ‘ TRA’ ), years of service (‘ <4’ , ‘ 4-16’ , ‘ >
16’), type of employment contract ( ’permanent’ vs ‘ part
time’) and whether they had taken sick leave in the pre-
vious year (‘yes’ vs ‘no’).
Burnout Clinical Subtype Questionnaire (BCSQ-12)
Following on, they were provided with the “Burnout Clini-
cal Subtype Questionnaire” in its brief Spanish version, the
BCSQ-12 (Additional file 1, Appendix 1: Spanish language
version of BCSQ-12; Appendix 2: English language version
of BCSQ-12). This questionnaire consists of 12 items
equally distr ibuted between the dimensions of ‘overload’
(e.g. “I overlook my own needs to fulfil work demands”),
‘ lack of development’ (e.g. “ My work doesn’ tofferme
opportunities t o develop my abil ities” )and‘neglect’ (e.g.
“ When things at work don’ t turn o ut as well as they
should, I stop trying” ). Subjects had to indicate their
degree of agreement with each of the statements presented
according to a Likert- type scale with 7 respo nse o ptions,
scored from 1 (totally disagree) to 7 (totally agree). The
results were presented as scalar scores. Cronbach’s a coef-
ficient showed the internal consistency of these dimen-
sions, with values of a≥0.85 in all cases in the present
study.
Maslach Burnout Inventory General Survey (MBI-GS)
Subjects were also given the “ Maslach Burnout Inven-
tory-General Survey” (MBI-GS) [2] in its validated Span-
ish languag e version [16]. This adaptation consists of 15
items grouped into ‘ three dimensions: ‘ exhaustion’ (e.g.
“I feel emotionally drained from my work” ), ‘cynicism’
(e.g. “I’ ve become more callous towards people since I
took this job”)and‘ efficacy’ (e.g. “I deal very effectively
with the problems of my work” ). Responses were
arranged (in a Likert = type scale with 7 response
options, scored from 0 (’ never’)to6(’ always ’ ). Results
are presented in scalar scores. All of the questionnaire
dimensions acquired an internal consistency of a≥0.78
[16].
Data analysis
A descriptive analysis of the participants’ socio-demo-
graphic and occupational characteri stics was conducted,
using means and standard deviations for age and per-
centages for the other variables. Contrasts were made
depending on the sub-sample to which participants
belonged using Student’ s t-test for age and c
2
for the
rest.
An initial contrast was made of the validity of the
BCSQ-12 construct by means of an exploratory factor
analysis (EFA) over n
1
. The maximum likelihood (ML)
extraction method was used with varimax orthogonal
rotation to facilitate interpretation, enabling relatively
unrelated dimensions to be obtained. We had previous ly
verified tha t: the correlations matrix presented a large
number of significant values; all variables presented a
valueofr>0.30;theabsolutevaluesoftheanti-image
matrix were close to 0; the matrix determining factor was
very low; the K aiser-Meyer-Olkin (KMO) index was >
0.70; Barlett’ s test of sphericity was statistically signifi-
cant; and the measures of sampling adequancy (MSA)
were above 0.80 [13]. The number of components was
decided using Kaiser’s criterion, which requires eigenva-
lues > 1 [17], in addition to Cattel’s scree test on the sedi-
mentation graph [18]. The belonging factor was
determined by means of the factor weight criterion w >
0.5 in only one of the factors [12] and the percentage of
variance explained in each variable by means of h
2
com-
munality values.
Confirmatory factor analysis (CFA) was performed over
n
2
in order to ensure the clear distinction between the
factors. The covariance matrix was used for data entry as
it enables robust a nalysis to be made of ordinal data
when the latent variables present more than one in dica-
tor [19]. This an alysis was carried out using the ML
method. This method assumes a multivariate normality,
although it is relatively insensitive to its non-observance
[20,21]. N evertheless, we ensured that Ma rdia’ s coeffi-
cient for kurtosis was < 70 [22], given that below this
limit, the ML method provides consistent param eter esti-
mates [23]. A ll components of the model were intro-
duced as latent factors, taking the items of the BCSQ-12
as observable variables distributed according to the origi-
nal proposal [7]. From an analytical perspective, factor
Montero-Marín et al. Health and Quality of Life Outcomes 2011, 9:74
/>Page 3 of 12
saturations (l) > 0.5 [24-26], the explained variance on
each observable variable (R
2
)andthedegreeofassocia-
tion between latent factors (), all of which were standar-
dized, were taken into account. From a general
perspective, absolute fit and incremental fit indices were
contemplated.
The absolute fit indices used were: chi-square (c
2
), chi-
square/degrees of freedom (c
2
/df), goodness-of-fit index
(GFI), adjusted goodness-of-fit index (AGFI), root mean
square error of approximation (RMSEA) and standarized
root mean square residual (SRMR). c
2
is highly sensitive
to sample size [24], for which use was also made of c
2
/df,
which indicates a good fit with a value < 5 or, more
strictly, < 3 [20,21,24,25]. GFI measures explained var-
iance and pres ents the same limitation as c
2
, while AGFI
corrects this limitation depending on the degrees of free -
dom and number of variables. Both are considered accep-
table ≥ 0.9 [26-29]. RMSEA is a measurement of the
error of approximation to the population and is consid-
ered acce ptable < 0.08 [30], a lthough values of < 0.06
[28] and < 0.05 [24] have also been proposed. Generally
speaking, values < 0.05 are good, while those c lose to
0.08 are reasonable and values > 0.1 are unacceptable
[31]. SRMR is the standardized difference between the
observed and th e predicted covarianc e, indicating a good
fit for values < 0.08 [21].
The incremental fit indices used were: normed fit index
(NFI), non-normed fit index (NNFI), incremental fit index
(IFI) and comparative fit index (CFI). NFI measures the
proportional reduction in the adjustment function when
going from null t o the proposed model; it does not take
into account the parsimony of the model and is considered
acceptable > 0.9 [32,33]. NNFI considers the degree of
freedom of the proposed model and of the independence
model and ≥0.9 is recommended [26], although > 0.9 [33]
and ≥0.95 [34] have been proposed. IFI also introduces a
factor of scale, with values > 0.9 being acceptable [35]. CFI
measures imp rovement in the me asurement of non-cen-
trality, also taking into account the parsimony of the
model, and indicates good fit ≥0.9 [26], although > 0.9 [30]
and ≥0.95 [34] have also been proposed.
Criterial validity was estimated using ROC curve analy-
sis over n
T
. The area under this curve was taken as a
representation of the discriminatory capacity of the ‘over-
load’ , ‘ lack of development’ and ‘ neglect’ dimensions
(BCSQ-12 ) t o di fferentiate b etween ‘ ca ses’ and ‘ non-
cases’ of ‘ exhaustion ’, ‘cynicism’ and ‘ lack of efficacy’
(MBI-GS), respectively . ‘ Case’ /’ non-case’ status was
established in the criterion dimensions t aking as t he cut-
off the 75 percentile of the standard yardstick for the
general Spanish population, corresponding to high or
very high scores (’exhaustion’ ≥2.90; ‘cynicism’≥2.26 and
‘efficacy’≤3.83) [16]. The c
2
test was used to contrast the
area under the ROC curve against the hypothesis of
random b ehaviour. Cut-off points were chosen for the
BCSQ-12 dimensions at scores that optimized the sensi-
tivity-specificity r atio, marking the dif ference between
‘exposed’ and ‘non-exposed’ in each of the conditions.
Accuracy was also calculated by means of negative pre-
dictive values, overall misclassification rate, positive like-
lihood ratio tests (coefficient between sensitivity and
1-specificity) and negative li kelihood ratio tests (coeffi-
cient between 1-sensitivity and specificity). Likelihood
ratio tests between 0.5-2 are regarded as poor; between
2-5 or 0.2-0.5 as good; 5-10 or 0.1-0.2 as very good, and
> 10 or < 0.1 as excellent [36]. The size of the effect was
estimated by using multivariate logistic regression (LR)
models by means of the calculation of adjusted Odds
ratios (OR), controlling the variables of age, sex, stable
relationship, level of education, occupation type, years of
service and duration and type of work contract, described
in the preceding section. The statistical significance of
the effect was estimated by the Wald test and the good-
ness of fit of models by means of the Hosmer-Lemeshow
(H-L) c
2
test. Confidence intervals at 95% (CI 95%) were
calculated in all measures of accuracy and effect.
The distribution of items and factors were described
by means of the statistical concepts of mean, standard
deviation, median, 25-75 percentiles, minimum-maxi-
mum scores, asymmetry and kurtosis. Internal consis-
tency was assessed by means of the item-rest
correlation, Cronbach’s a and according to changes in a
through the elimination of each individual item. Con-
trasts were made depending on sex and occupation
using the Mann-Whitney and Kruskal-Wallis tests, given
the non-parametric distrib ution of t he dimensions on
these groups.
The le vel of significance adopted in the tests was p <
0.05, and p < 0.017 for multiple comparisons owing to
the Bonfe rroni correction. Data analysis was carried out
using the SPSS-15, AMOS-7 and Epidat 3.1 software
packages.
Results
Characteristics of the study participants
A response rate (RR) of 25.81% was obtained, with ‘TRS’
(RR = 20.04%) being less participative than ‘ ASP’ (RR =
33.24%) and ‘TRA’ (RR = 35.76%) (p < 0.001). Table 1
shows the socio-de mographi c and occupational charac-
teristics of the participants. No significant differences
were found between the sub-samples in any of them.
Factorial Validity
Exploratory Factor Analysis (EFA) over n
1
All the items presented values of r > 0.30 in the correla-
tions matrix, with 89.39% of them being significant.
83.33% of the MSA were > 0.80 and absolute anti-image
values approached 0. The KMO was = 0.83, the matrix
Montero-Marín et al. Health and Quality of Life Outcomes 2011, 9:74
/>Page 4 of 12
determi ning factor = 0.001 and Bartlett’s test p < 0.001.
Consequently, the data distribution enabled EFA to be
performed legitimately. This analysis provided an
unforced solution for three factors. The first (‘neglect’)
explained 37.53% of the variance (eigenvalue = 4.50); the
second (‘lack of development’) expl ained 20.13% (eigen-
value = 2.41 ); and the third (‘ overload’ )explained
16.12% (eigenvalue = 1.94). The scree test allowed the
solution to be accepted as adequate. In total, 73.7 8% of
the variance was explained. Table 2 shows the rotated
factor solution and h
2
values.
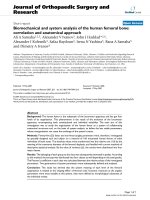
Confirmatory Factor Analysis (CFA) over n
2
Mardia’s coefficient was = 66.77 (p < 0.001), which made
it possib le to use the ML estimation method in condi-
tions of distance from the assumption of multiva riate
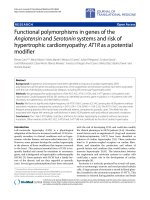
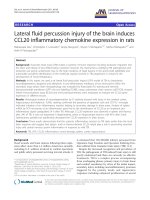
normality. Figure 1 shows the results of CFA from an
analytical perspective. The fit indices for this model were:
c
2
= 149.61 (gl = 51; p < 0.001), c
2
/gl = 2.93, GFI =
0.941, AGFI = 0.911, RMSEA = 0.068 (90% CI = 0.055-
0.080), SRMR = 0.059, NFI = 0.943, NNFI = 0.951, IFI =
0.962 and CFI = 0.962. The entry into the model of those
correlations between the error terms with modification
indices that sh owed significant reductions in the value o f
c
2
[e
4
-e
5
(r = 0.13; p = 0.015), e
4
-e
10
(r = 0.19; p = 0.009),
e
5
-e
6
(r = 0.18; p = 0.002), e
5
-e
11
(r = 0.20; p < 0.001) y
e
6
-e
11
(r = 0.15; p = 0.014)], gave the following indices:
c
2
= 112.04 (gl = 46; p < 0.001), c
2
/gl = 2.44, GFI =
0.958, AGFI = 0.929, RMSEA = 0.059 (90% CI = 0.045-
0.073), SRMR = 0.057, NFI = 0.958, NNFI = 0.963, IFI =
0.975 and CFI = 0.974.
Criterial validity
When predicting ‘exhaustion ’, the area under the ROC
curve for ‘ overload’ was = 0. 75, this was = 0.80 for ‘lack
of development’ relative to ‘ cynicism’ and = 0.74 for
‘ negl ect’ relative to ‘ inefficacy’ (p < 0.001). Table 3
shows the accuracy of cut-off points that optimized the
sensitivity-specificity ratio [’overload’≥3.38 (se = 75.89;
sp = 62.35); ‘lack of development’ ≥3.63 (s e = 70.71; sp =
70.57); ‘neglect’≥2.63 (se = 71.19; sp = 67.03)].
Descriptives, internal consistency and contrasts
25.06% of participants in the total sample presented hig h
or very high scores in only one of the MBI-GS d imen-
sions; 16.46% did so in two of them; and 8.11% in all
three. Table 4 shows the descriptives for the BCSQ-12
items, while Table 5 shows those corresponding to the
BCSQ-12 and MBI-GS dimensions, as well as contrast
Table 1 Characteristics of the study participants
variables total sample
n
T
= 826
sub-sample 1
n
1
= 413
sub-sample 2
n
2
= 413
p
Age 0.242
Md (SD) 40.26 (9.52) 40.64 (9.59) 39.87 (9,46)
Sex 0.362
male 366 (44.31) 176 (42.62) 190 (46.00)
Stable Relationship 0.999
yes 647 (78.33) 324 (78.45) 323 (78.21)
Education 0.667
secondary 119 (14.41) 64 (15.50) 55 (13.32)
university 423 (51.21) 208 (50.36) 215 (52.06)
doctorate 284 (34.38) 141 (34.14) 143 (34.62)
Occupation 0.988
TRS 372 (45.04) 185 (44.79) 187 (45.28)
ASP 351 (42.49) 176 (42.62) 175 (42.37)
TRA 103 (12.47) 52 (12.59) 51 (12.35)
Length of service 0.210
< 4 years 184 (22.28) 85 (20.58) 99 (23.97)
4-16 years 353 (42.74) 172 (41.65) 181 (43.83)
> 16 years 289 (34.99) 156 (37.77) 133 (32.20)
Contract duration 0.775
permanent 503 (60.90) 254 (61.50) 249 (60.29)
Contract type 0.718
full-time 750 (90.80) 377 (91.28) 373 (90.31)
Sick leave 0.201
yes 256 (30.99) 119 (28.81) 137 (33.17)
The figures represent frequencies, percen tages (in brackets) and the p value associated with an c
2
contrast between sub-sample 1 and sub-sample 2 except for
the age variable where the figures represent means, standard deviations and the p value associated with a t contrast.
Montero-Marín et al. Health and Quality of Life Outcomes 2011, 9:74
/>Page 5 of 12
with regard to sex and occupation. T he results of the
internal consistency analysis s howed tha t removal of
items separately caused the a valuetodecreaseinall
cases. No differences were found with regard to sex, but
there were differences depending on occupation. Teach-
ing or research staff (TRS) showed higher levels of
‘ exhaustion’ tha n administrati on or service personnel
(ASP), TRS and trainees (TRA) presented higher levels of
‘overload’, ASP showed higher levels of ‘ lack of develop-
ment’ (p < 0.001). TRA showed lower levels of ‘ neglect’
than ASP (p = 0.004).
Discussion
The BCSQ-12 has been proposed as a definition of
burnout that could cover common ground between the
typological and standard approaches [1,2,4,7,8]. Its factor
and criterial validity had not been tested until now. By
using a multi-occupational sample of university employ-
ees, EFA and CFA were performed on different sub-
samples, a ROC curve analysis was carried out with the
MBI-GS as a standard criterion and a contrast of
hypotheses was made for both models with respect to
sex and occupation.
The prevalence v alues obtained for the study sample
according to the classical dimensions were high, although
within the expected range. The structure of the BCSQ-12
behaved consistently throughout the factor analyses. All
the items loaded perfectly on the factors following the
original design, and they we re all well explained. Internal
consistency was very good in all cases and all items con-
tibuted to its increase. The restrictions imposed by the
model were well fitted to all the data, from bot h an abso-
lute and incremental perspective. The discriminatory
capacity of the cl assifier and the accuracy associated with
the propos ed cut-off points were good. The sens itivity
and specificity shown by the dimensions of the BCSQ-12
when predicting those of the MBI-GS do not show the
values that we normally expect to obtain from an ideal
classifier, however, they are seen to be moderately high
and all significant, far from those of random behaviour.
Although the likelihood of being a ‘ non-case’ among
unexposed subjects offered an excellent score that of
being a ‘ case’ among exposed subjects offered a more
limited score, which made the misclassification increase
in this sense. Nevertheless, the likelihood of being a ‘case’
among exposed subjects was much greater than those
who were not exposed, the likelihood of attaining the sta-
tus of ‘ exposed’ was greater among the ‘ cases’ and the
likelihood of attaining the status of ‘ un exposed’ was
greater among ‘ non-cases’ . No s ignificant differences
were found with regard to sex, but there were differences
depending on occupation. ‘TRS’ showed higher levels of
‘exhaustion’ than ‘ASP’. ‘TRS’ and ‘TRA’ presented higher
levels of ‘overload’ and ASP sh owed hi gher levels of ‘ lac k
of development’ . ‘TRA’ showed lower levels of ‘neglect’
than ‘ASP’.
As limitations to the study, we should mention that the
scores for variables conside red were self-reported and
therefore may have been weakened by the effects of
socially desirable responses. The utilization of a sample
obtained from a sole organization may have limited the
external validity of the obtained results. Still, this is a
broad and mu lti-occu pati onal sample made u p of work-
ers with very diverse jobs, which reinforces the possibility
of generalization. Certainly, the RRs obtained with regard
to occupation were different and could have introduced a
possible selection bias that may have affected the repre-
sentative nature of the sample. However, we would also
mention that this does not produce an important reduc-
tion in the statistical power for comparing the groups.
We found that teaching and research staff were signifi-
cantly less participative than administration
and service
Table 2 Exploratory Factor Analysis - weightings and communalities
Factor
Items 123h
2
3. When things at work don’t turn out as well as they should, I stop trying 0.72 0.13 0.07 0.54
6. I give up in response to difficulties in my work 0.85 0.15 0.14 0.76
9. I give up in the face of any difficulties in my work tasks 0.73 0.17 0.14 0.58
12. When the effort I invest in work is not enough, I give in 0.82 0.12 0.09 0.70
2. I would like to be doing another job that is more challenging for my abilities 0.02 0.85 0.05 0.73
5. I feel that my work is an obstacle to the development of my abilities 0.29 0.68 0.22 0.62
8. I would like to be doing another job where I can better develop my talents 0.12 0.92 0.04 0.86
11. My work doesn’t offer me opportunities to develop my abilities 0.22 0.72 0.02 0.58
1. I think the dedication I invest in my work is more than what I should for my health 0.07 0.13 0.80 0.67
4. I neglect my personal life when I pursue important achievements in my work 0.09 0.02 0.82 0.67
7. I risk my health when I pursue good results in my work 0.06 0.01 0.77 0.60
10. I overlook my own needs to fulfil work demands 0.20 0.11 0.68 0.52
Extraction method: Maximum Likelihood with Varimax orthogonal rotation on sub-sample 1. h
2
= communalities. Bold = belonging factor.
Montero-Marín et al. Health and Quality of Life Outcomes 2011, 9:74
/>Page 6 of 12
e
9
e
3
e
12
e
6
Item 3
0.42
0.61**
Item 12
0.68
Item 9
0.56
Item 6
0.64
0.80**
0.75**
0.82**
e
8
e
11
e
5
e
4
e
2
Item 2
0.75
0.87**
Item 11
0.57
Item 8
0.81
Item 5
0.56
0.75**
0.90**
0.75**
e
7
e
1
e
10
0.14*
0.32**
0.13*
Item 1
0.68
0.82**
Item 10
0.64
Item 7
0.65
Item 4
0.64
0.80**
0.81**
0.80**
Overload
Lack of
Development
Neglect
†
BCSQ-12 measurement model and standardized estimations from sub-sample 2. The circles represent latent constructs and the rectangles are observable
variables. The factor weightings (Ȝ) are over the one-way arrows, the percentage of explained variance for each observable variable (R
2
) over the boxes, and
the correlations between latent factors (ij) next to the two-way arrows. *p<0.05; **p<0.001.
Figure 1 Analytical perspective of Confirmatory Factor Analysis
†
.
Table 3 Exactness of BCSQ-12 according to MBI-GS
criterion: ‘exhaustion’
(cut-off point ‘overload’≥3.38)
criterion: ‘cynicism’
(cut-off point ‘L.development’≥3.63)
criterion: ‘inefficacy’
(cut-off point ‘neglect’≥2.63)
index 95% IC index 95% IC index 95% IC
Sensitivity * 75.89 70.07 - 81.72 70.71 65.21 - 76.22 71.19 64.23 - 78.14
Specificity * 62.35 58.40 - 66.30 70.57 66.66 - 74.48 67.03 63.33 - 70.72
PPV
a
* 42.82 37.83 - 47.81 55.15 49.87 - 60.44 37.06 31.78 - 42.34
NPV
b
* 87.44 84.19 - 90.69 82.48 78.93 - 86.06 89.51 86.68 - 92.33
OMR
c
* 33.98 30.69 - 37.27 29.38 26.22 - 32.55 32.08 28,84 - 35.33
PLR
d
2.02 1.78 - 2.29 2.40 2.07 - 2.79 2.16 1.87 - 2.49
NLR
e
0.39 0.30 - 0.49 0.42 0.34 - 0.50 0.43 0.34 - 0.55
OR
f
5.25
g
3.62 - 7.60 6.77
h
4.79 - 9.57 5.21
i
3.57 - 7.60
*values given as percentages. a = Positive predictive value. b = Negative predictive value. c = Overal misclassification rate. d = Positive likelihood ratio. e =
Negative likelihood ratio. f = Adjusted Odds Ratio by means of multivariate logistic regression models controlling age, sex, stable relationship, education,
occupation, length of service, contract duration and contract type. g = Wald p < 0.001; H-L p = 0.451. h = Wald p < 0.001; H-L p = 0.093. i = Wald p < 0.001; H-L
p = 0.216. Values obtained from the total sample (n
T
).
Montero-Marín et al. Health and Quality of Life Outcomes 2011, 9:74
/>Page 7 of 12
Table 4 Descriptive statistics for BCSQ-12 items
items Mn SD Q
1
Mdn Q
3
min max asym
a
kurt
b
Item-rest
1. I think the dedication I invest in my work is more than what I should for my health 3.83 1.66 3.00 4.00 5.00 1.00 7.00 0.09 -0.80 0.75
4. I neglect my personal life when I pursue important achievements in my work 3.10 1.71 2.00 3.00 4.00 1.00 7.00 0.57 -0.56 0.75
7. I risk my health when I pursue good results in my work 3.43 1.69 2.00 3.00 5.00 1.00 7.00 0.33 -0.73 0.74
10. I overlook my own needs to fulfil work demands 3.53 1.63 2.00 3.00 5.00 1.00 7.00 0.21 -0.73 0.69
2. I would like to be doing another job that is more challenging for my abilities 3.42 1.86 2.00 3.00 5.00 1.00 7.00 0.31 -0.90 0.77
5. I feel that my work is an obstacle to the development of my abilities 3.08 1.64 2.00 3.00 4.00 1.00 7.00 0.61 -0.29 0.72
8. I would like to be doing another job where I can better develop my talents 3.68 1.86 4.00 4.00 5.00 1.00 7.00 0.14 -1.01 0.82
11. My work doesn’t offer me opportunities to develop my abilities 3.53 1.86 2.00 3.00 5.00 1.00 7.00 0.30 -0.96 0.73
3. When things at work don’t turn out as well as they should, I stop trying 2.46 1.26 1.00 2.00 3.00 1.00 7.00 0.92 1.08 0.61
6. I give up in response to difficulties in my work 2.36 1.24 1.00 2.00 3.00 1.00 7.00 0.88 0.90 0.74
9. I give up in the face of any difficulties in my work tasks 2.12 1.09 1.00 2.00 3.00 1.00 7.00 1.05 1.84 0.68
12. When the effort I invest in work is not enough, I give in 2.48 1.20 1.00 3.00 3.00 1.00 7.00 0.69 0.64 0.74
Mn = mean. SD = standard deviation. Mdn = median. Q
1
= percenti le-25. Q
3
= percentile-75. min = minimum score. max = maximum score. asym = asymmetry. kurt = kurtosis. Item-rest = correlation coefficient
item-rest (r between each item and the remaining items belonging to the same factor). a = typical asymmetry error = 0.08 for all items. b = typical kurtosis error = 0.17 for all items. Values obtained from the total
sample (n
T
= 826).
Montero-Marín et al. Health and Quality of Life Outcomes 2011, 9:74
/>Page 8 of 12
personnel and trainees. Nonetheless, all the response rate
valuesobtainedfromthesegroups,althoughlow,fell
within the range that could be expected when using this
data collection procedure [10,11]. Our opinion is that
this pattern of response could be due to differences in
the type of burnout mostly present in each occupational
category, which follows the line put forward by Montero-
Marín et al. [4] and is in agreement with the results
obtained in this study concerning the differences between
groups. The fact that teaching and research staff show a
Table 5 Descriptive statistics, Cronbach’s a and contrasts with regard to sex and occupation for the BCSQ-12 and
MBI-GS dimensions
BCSQ-12 MBI-GS
(n) Overload L. Development Neglect Exhaustion Cynicism Efficacy
Total 826
Mn 3.47 3.43 2.35 2.24 2.01 4.47
SD 1.42 1.57 1.00 1.42 1.57 0.97
Mdn 3.25 3.25 2.25 2.00 1.50 4.58
Q
1
2.50 2.25 1.50 1.20 0.75 3.83
Q
3
4.50 4.50 3.00 3.20 3.00 5.17
min 1.00 1.00 1.00 0.00 0.00 0.00
max 7.00 7.00 6.25 6.00 6.00 6.00
asym
a
0.34 0.28 0.48 0.71 0.78 -0.72
kurt
b
-0.50 -0.62 0.06 -0.14 -0.23 0.71
a 0.87 0.89 0.85 0.91 0.92 0.82
Male 366
Mdn 3.25 3.50 2.25 1.80 1.75 4.50
Q
1
2.50 2.25 1.50 1.00 1.00 3.83
Q
3
4.50 4.62 3.00 3.00 3.00 5.17
a 0.86 0.88 0.86 0.91 0.91 0.81
Female 460
Mdn 3.25 3.25 2.50 2.00 1.50 4.67
Q
1
2.50 2.25 1.50 1.00 1.00 3.83
Q
3
4.50 4.25 3.00 3.20 2.94 5.17
a 0.88 0.89 0.84 0.92 0.92 0.83
p
c
0.502 0.082 0.480 0.194 0.108 0.124
TRS 372
Mdn 3.75 3.00 2.25 2.00 1.50 4.50
Q
1
3.00 1.75 1.50 1.40 0.75 3.83
Q
3
5.00 4.00 3.00 3.60 3.00 5.00
a 0.87 0.86 0.84 0.92 0.92 0.82
ASP 351
Mdn 3.00 4.00 2.50 1.80 1.75 4.67
Q
1
2.25 3.00 1.50 1.00 1.00 4.00
Q
3
3.50 5.00 3.00 2.80 3.00 5.17
a 0.85 0.90 0.86 0.90 0.91 0.82
TRA 103
Mdn 3.50 3.00 2.00 2.00 1.50 4.50
Q
1
2.50 1.75 1.25 1.00 0.75 3.67
Q
3
5.25 4.00 2.75 3.40 2.75 5.50
a 0.87 0.91 0.86 0.93 0.94 0.85
p
d
< 0.001 < 0.001 0.016 0.006 0.305 0.155
TRS vs ASP < 0.001 < 0.001 0.322 0.001 0.123 0.056
TRS vs TRA 0.456 0.622 0.023 0.466 0.786 0.344
ASP vs TRA < 0.001 < 0.001 0.004 0.202 0.501 0.863
Mn = mean. SD = standard deviation. Mdn = median. Q
1
= percentile-25. Q
3
= percentile-75. min = minimum score. max = maximum score. asym = asymmetry.
kurt = kurtosis. a = typical asymmetry error = 0.08. b = typical kurtosis error = 0.17. c = Mann-Whitney contrast. d = Kruskal-Wallis contrast.
Montero-Marín et al. Health and Quality of Life Outcomes 2011, 9:74
/>Page 9 of 12
greater tendency to suffer f rom overload may influence
their being less participative, owing to the little time they
have and their strong focus on accomplishing their own
goals. Administration and service personnel, showing a
greater tendency to experience lack of development,
would appear to be more participative perhaps as this
allows them a momentary break from the monotony of
their work. The traine es, show ing outstandin gly low
levels of neglect, appear to be a participative group, most
likely owing to the nature of their jobs and to their scarce
exposure in time to the rigidity of the organizational
structure of the institution, which would leave them feel-
ing less worn out. Consequently, the different response
rates obtained depending on occupati onal categorie s
could be explaine d in rel ation to the differences between
the burnout types encountered.Thispointgainsin
importance if we are to obtain representative samples for
the calculation of prevalence values for burnout syn-
drome depending on the different occupational strata [5].
Therefore, this will have to be taken into account when
recruiting participants in future research projects. Finally,
the criterion was established from a psychometric level,
given the lack of consensus in the contemporary scen e
from a clinical perspective. As strengths of the study, we
would underscore the quality of the data, which was con-
trolled by eliminating the possible errors from the tran-
scription process by means of purpose-designed software.
Likewise, the obtention of convergent results between
exploratory and confirmatory analyses, carried out on dif-
ferent sub-samples, increases the confidence of our
results.
According to social exchange theory, the establish-
ment of reciprocal relationsisessentialforthehealth
and well-being of individuals. Perception of the lack of
reciprocity in a work environment plays a fundamental
role in the development of burnout syndrome and
increases the risk of individuals suffering from emo-
tional disorders [ 37-39]. This is due to the imbalance
between effort and gratification being an important
source of stress [40]. The manifestation of burnout
through di fferent clinical subtypes co rresponds to cop-
ing with feelings of frustration produced through differ-
ing levels of commitment [3-8].
Individuals suffering from “ frenetic” burnout experi-
ence the feeling of ‘ overload’ when they try to maximize
their rewards by taking on a volume and pac e of work
that become excessive [3-8]. This feeling constitutes a
classic aetiological factor of burnout [41-43], which was
observed to be associated with ‘exhaustion’ in our study.
According to K arasek’ s model, high demands and low
autonomy in the workplace increase exhaustion levels
and thus the likelihood of developing the syndrome, par-
ticularly in workers with poor time management skills
and a low level of resources [44-46]. The “ frenetic”
subtype offers a profile of active coping that could benefit
from interventions directed at reducing activation, for the
purpose of removing accumulated tension and prevent-
ing exhaustion; improvement in ti me manageme nt to
make room f or the total satisfaction of personal needs;
and development of self-assertion in order to place limits
on the acceptance of responsibilities.
The “ underchallenged” subtype balances rewards by
carrying out tasks in a superficial manner, leading to feel-
ings of meaninglessness and lack of personal develop-
ment in the workplace [3-8]. This has an influence on
the negative assessment of work conditions [47], consti-
tutes a risk factor for bu rnout [48,49] and has been as so-
ciated with boredom, indifference and a mechanical
performance [8]. It has been associated with ‘cynicism’ in
our study. From a non-linear perspective, Karasek’ s
model explains the origin of feeling of frustration as the
absence of challenges resulting from monotony owing t o
low demands in the workplace [50]. The “ underchal-
lenged” subtype, situated between active and passive cop-
ing modes although closer to the latter, may benefit from
interventions that encourage interest, satisfaction and
personal development through training of conscious
attention towards tasks and through the establishment of
challenging and significant targets.
The “worn-out” subtype optimizes rewards by reducing
efforts through ‘ neglect’ of responsibilities and chooses
this as a consequence of the defencelessness learned in
the individual’s experience with th e organizat ion [3 -8].
This ‘neglect’ is the opposite of commitment [7,51] and is
seen in our study to be associated with the perception of
‘lack of efficacy’ in the carrying out of tasks. According to
Karasek
’s
model, experiences of lack of control play an
important part in the health of workers and reduce their
productivity [44,52], leading to a breaking of an indivi-
dual’ s commitment through the erosion they cause in
expectations of sel f-efficacy, given the m odulating role
these play i n the ma intenance of behaviours [53,54]. The
“worn-out” subtype presents a profile of passive coping
that could benef it from interventions directed at treat-
ment for despair and increased confidence through the
regaining of control and the perception of self-efficacy.
A definition of the syndrome that is able to discriminate
the type of experienced burnout by means of the identifi-
cation of clinical profiles according to a three-dimensional
definition, such as that presented in the BCSQ-12, offers
understanding into the type of dysfunctional attitudes
associated with each case, favouring the development of
more specific interventions within a conceptual framework
according to the classical per spective. From our p oint of
view, this is due to the fact that the model provided by the
BCSQ-12 extends t he s tandard definition of burnout,
all owing greater differentiation to be made using clinical
subtypes; but at the cost of becoming a little distanced
Montero-Marín et al. Health and Quality of Life Outcomes 2011, 9:74
/>Page 10 of 12
from the core of the syndrome as it has been considered
using the classical model. Extra validity will be given to
the proposed model through the clinical benefits that this
new definition may produce by means of the design of
new and more specific interventions for the syndrome.
Our study shows how the BCSQ-12 went further than
the standard MBI-GS in characterizing work-related dis-
comfort experienced with regard to occupation. Taking
into account the series of inconsistencies presented by
the classic stand ard [55,56], the BCSQ-12 may provide a
more solid definition of the syndrome at a structural
level. The therapeutic interventions derived from the
standard model has not produced very promising results
to date [57], perhaps because not enough attention has
been given to the matter of the type of dissatisfaction
and burnout experienced. Generally speaking, the evi-
dence shows that levels of satisfaction in the workplace
have a decisive influece on the health of workers [58].
Future research will need to clarify whether this new
perspective will be able to produ ce more effective inter-
vent ions for burnout and for the impro vement of work-
ers’ health status.
Conclusions
Our results provide evidence in favour of the criterial and
construct validity of the brief typological definition of
burnout established in BCSQ-12. This questionnaire can
be a very useful instrument for future evaluation and also
for designing interventions, as it pro vides an approach to
the syndrome focusing on the identification of the type
of dissatisfaction and discomfort experienced.
Additional material
Additional file 1: Appendix 1. “Burnout Clinical Subtype
Questionnaire” (BCSQ-12), Spanish version. The BCSQ-12 in its English
version is presented and scoring explained to facilitate the use by the
readers. Appendix 2. “Burnout Clinical Subtype Questionnaire” (BCSQ-12),
English version. The BCSQ-12 in its Spanish version is presented and
scoring explained to facilitate the use by the readers.
Author details
1
Department of Psychiatry. University of Zaragoza. REDIAPP (Research
Network on Preventative Activities and Health Promotion, RD06/0018/0017).
Spain.
2
Faculty of Health and Sports. University of Zaragoza, Huesca. Spain.
3
Academic Unit of Psychiatry, School of Social and Community Medicine,
University of Bristol, UK.
4
Department of Psychiatry, University of Ioannina
School of Medicine, Ioannina, Greece.
5
Institut Universitari d’Investigació en
Ciències de la Salut (IUNICS), University of Balearic Islands, REDIAPP (Research
Network on Preventative Activities and Health Promotion, RD06/0018/0017).
Spain.
Authors’ contributions
JMM, JGC, PS, RA and MG conceived the study design. JMM and JGC
collected the data, JMM, PS, JGC and RA conducted the statistical analysis,
REDIAPP has given scientific and statistical support over the research study
and all authors contributed to the interpretation of the results, the drafting
of the manuscript, and the approval of the final manuscript.
Competing interests
The authors declare that they have no competing interests.
Received: 22 April 2011 Accepted: 20 September 2011
Published: 20 September 2011
References
1. Maslach C, Schaufeli WB, Leiter MP: Job Burnout. Annual Review of
Psychology 2001, 52:397-422.
2. Maslach C, Jackson SE, Leiter MP: Maslach Burnout Inventory Palo Alto, CA:
Consulting Psychologist Press; 1996.
3. Farber BA: Treatment strategies for different types of teacher burnout.
Journal of Clinical Psychology 2000, 56(5):675-89.
4. Montero-Marín J, García-Campayo J, Mera DM, López Y: A new definition
of burnout syndrome based on Farber’s proposal. Journal of Occupational
Medicine and Toxicology 2009, 4:31.
5. Montero-Marín J, García-Campayo J, Fajó-Pascual M, Carrasco JM, Gascón S,
Gili M, Mayoral-Cleries F: Sociodemographic and occupational risk factors
associated with the development of different burnout types: the cross-
sectional university of Zaragoza study. BMC Psychiatry 2011, 11:49.
6. Montero-Marín J, García-Campayo J, Andrés E: Análisis exploratorio de un
modelo clínico basado en tres tipos de burnout. Cuadernos de Medicina
Psicosomática y Psiquiatría de Enlace 2008, 88:41-49.
7. Montero-Marín J, García-Campayo J: A newer and broader definition of
burnout: Validation of the “Burnout Clinical Subtype Questionnaire
(BCSQ-36)”. Public Health 2010, 10:302.
8. Montero-Marín J, Araya R, Oliván B, Gili M, Martínez V, García-Campayo J:
Convergent validity between Maslach’s classic definition of burnout and
a new definition of the syndrome based on clinical sub-types: a cross-
sectional study., pending publication.
9. Moreno-Giménez B: Evaluación, medidas y diagnóstico del síndrome de
burnout. In El Síndrome de quemarse por el trabajo (burnout). Grupos
profesionales de riesgo. Edited by: Gil-Monte PR, Moreno-Jiménez B. Madrid:
Pirámide Psicología; 2007:43-70.
10. Heiervang E, Goodman R: Advantages and limitations of web-based
surveys: evidence from a child mental health survey. Soc Psychiatry
Psychiatr Epidemiol 2009.
11. Kaplowitz MD, Hadlock TD, Levine R: A comparison of web and mail
survey response rates. Public Opinion Quarterly 2004, 68(1):94-101.
12. Comrey AL: Manual de análisis factorial Madrid: Cátedra; 1985.
13. García E, Gil J, Rodríguez G: Análisis Factorial Madrid: La Muralla; 2000.
14. Hair JF, Anderson RE, Tatham RL, Black WC: Análisis Multivariante. 5 edition.
Madrid: Prentice Hall; 2000.
15. Freeman DH: Applied categorical data análisis New York: Marcel Dekker; 1978.
16. Bresó E, Salanova M, Schaufeli WB: Síndrome de estar quemado por el
trabajo “Burnout
” (III):
Instrumento de medición. Nota Técnica de
Prevención (NTP 732). Instituto Nacional de Seguridad e Higiene en el
Trabajo (INSHT). Extract dated 8 December 2007 [ />InshtWeb/Contenidos/Documentacion/FichasTecnicas/NTP/Ficheros/
701a750/ntp_732.pdf].
17. Kaiser HF: The application of electronic computers to factor analysis.
Educational and Psychological Measurement 1960, 20:141-51.
18. Cattell RB: The scree test for the number of factors. Multivariate Behavioral
Research 1966, 1:245-76.
19. Coenders G, Satorra A, Saris WE: Alternative approaches to structural
modeling of ordinal data: a Monte Carlo study. Structural Equation
Modeling 1997, 4:261-82.
20. Schermelleh-Engel K, Moosbrugger H, Müller H: Evaluating the fit of
Structural Equation Models: Test of significance and descriptive
goodness-of-fit measures. Methods of psychological research online 2003,
8(2):23-74.
21. Hu LT, Bentler PM: Cutoff criteria for fit indexes in covariance structure
analysis: Conventional criteria vs. new alternatives. Structural Equations
Modeling 1999, 6:1-55.
22. Mardia K: Applications of some measures of multivariate skewness and
kurtosis in testing normality and robustness studies. Sankhya 1974,
36:115-28.
Montero-Marín et al. Health and Quality of Life Outcomes 2011, 9:74
/>Page 11 of 12
23. Rodríguez MN, Ruíz MA: Atenuación de la asimetría y de la curtosis de
las puntuaciones observadas mediante transformaciones de variables:
Incidencia sobre la estructura factorial. Psicológica 2008, 29:205-27.
24. Bollen KA, Long JS: Testing Structural equation models Beverly Hills, CA:
Sage; 1993.
25. Marsh HW, Hocevar D: Aplication of confirmatory factor análisis to the
study of self concept: First -and higher- order factor models and their
invariante across groups. Psychological Bulletin 1985, 97:562-82.
26. Byrne BM: Structural equation modeling with Amos: Basic concepts,
applications and programming Mahwah, NJ: Erlbaum; 2001.
27. Jöreskog FG, Sörbom D: SPSS Lisrel 7 and Prelis, User’s guide and Referente
Chicago, IL: SPSS Inc; 1990.
28. Maiti SS, Mukherjee BN: A note on Distributional Properties of the
Jöreskog-Sörbom Fit Indices. Psychometrika 1990, 55:721-26.
29. Medsker GJ, Williams LJ, Holahan PJ: A review of current practices for
evaluating causal models in organizational behaviour and human
resources management research. Journal of Management 1994, 20:439-64.
30. Hair JF, Anderson RE Jr, Tateman JL, Black WC: Análisis Multivariante Madrid:
Pearson Educación; 1999.
31. Browne MW, Cudeck R: Alternative ways of assessing model fit. In Testing
Structural Equation Models. Edited by: Bollen KA, Long JS. Beverly Hills, CA:
Sage; 1993:136-62.
32. Bentler PM, Bonett DG: Significance test and goodness of fit in the
analysis of covariance structures. Psychollogical Bulletin 1980, 88:588-606.
33. Lévy JP, Martín MT, Román MV: Optimización según estructuras de
covarianzas. In Modelización con Estructuras de Covarianzas en Ciencias
Sociales. Edited by: Lévy JP, Varela J. A Coruña: Netbiblo; 2006:21-22.
34. Batista JM, Coenders G: Modelos de ecuaciones estructurales Madrid: La
Muralla; 2000.
35. Rial A, Valera J, Abalo J, Lévy JP: El Análisis Factorial Confirmatorio. In
Modelización con Estructuras de Covarianzas en Ciencias Sociales. Edited by:
Lévy JP, Varela J. A Coruña: Netbiblo; 2006:127-28.
36. Jaeschke R, Guyatt G, Lijmer J: Diagnostic tests. In Users’ guides to the
medical literature. Edited by: Guyatt G, Rennie D. Chicago: AMA Press;
2002:121-40.
37. Buunk BP, Schaufeli WB: Reciprocity in Interpersonal Relationships: An
Evolutionary Perspective on its Importance for Health and Well-being.
European Review of Social Psychology 1999, 10:260-291.
38. Unterbrink T, Hack A, Pfeifer R, Buhl-Griesshaber V, Müller U, Wesche H,
Frommhold M, Scheuch K, Seibt R, Wirsching M, Bauer J: Burnout and
effort-reward-imbalance in a sample of 949 German teachers. Int Arch
Occup Environ Health 2007, 80(5):433-41.
39. Lehr D, Hillert A, Keller S: What can balance the effort? Associations
between effort-reward imbalance, overcommitment and affective
disorders in German teachers. Int J Occup Environ Health 2009,
15(4):374-84.
40. Siegrist J: Stress work, self-experience, and cardiovascular disease
prevention. In Behavioral medicine approaches to cardiovascular disease
prevention. Edited by: Orth-Gomér K, Schneiderman N. Mahwah, NJ: LEA;
1996:87-102.
41. Schaufeli WB, Bakker AB: Job demands, job resources, and their
relationship with burnout and engagement: a multi-sample study. J
Organizat Behav 2004, 25:293-315.
42. Lorente L, Salanova M, Martínez I, Schaufeli WB: Extensión of the Job
Demands-Resources model in the prediction of burnout and
engagement among teachers over time. Psicothema 2008, 20:354-360.
43. Günüşen NP, Ustün B: Turkish nurses’ perspectives on a programme to
reduce burnout. Int Nurs Rev 2009, 56(2):237-42.
44. Karasek R: Control in the workplace and its health-related aspects. In Job
control and worker health. Edited by: Sauter Sl, Hurrell JJ Jr, Cooper CL.
Chichester: Wiley; 1989:129-59.
45. Peeters MA, Rutte CG: Time management behavior as a moderator for
the job demand-control interaction. J Occup Health Psychol 2005,
10(1):64-75.
46. Bakker AB, Demerouti E, Euwema MC: Job resources buffer the impact of
job demands on burnout. J Occup Health Psychol 2005, 10(2):170-80.
47. van Dierendonck D, Schaufeli WB, Buunk BP: The evaluation of an
individual burnout intervention program: the role of inequity and social
support. Journal of Applied Psychology 1998, 83:392-407.
48. Borritz M, Bültmann U, Ruqulies R, Christensen KB, Villadsen E, Kristensen TS:
Psychosocial work characteristics as predictors for burnout: findings
from 3-year follow up of the PUMA Study. J Occupat Environm Med 2005,
47:1015-25.
49. Montero-Marín J, García-Campayo J, Andrés E: Validez Factorial de la
estructura del Cuestionario Breve de Burnout (CBB). Revista de
Psicopatología y Psicología Clínica 2009, 14:123-32.
50. Pisanti R: An empirical investigation of the demand-control-social
support model: effects on burnout and on somatic complaints among
nursing staff. G Ital Med Lav Ergon 2007, 29(1 Suppl A):A30-6.
51. Schaufeli WB, Salanova M: Efficacy or inefficacy, that’s the question:
burnout and work engagement, and their relationship with efficacy
beliefs. Anxiety Stress Coping 2007, 20:177-96.
52. Yandrick RM: High demand, low-control jobs reduce productivity and
increase workplace disability costs. Behav Healthc Tomorrow 1997,
6(3):40-4.
53. Bandura A: Social cognitive theory: An agentic perspective. Ann Rev
Psychol 2001, 52:1-26.
54. Salanova M, Grau R, Martinez I: Demandas laborales y conductas de
afrontamiento: el rol modulador de la autoeficacia profesional.
Psicothema 2005, 17:390-95.
55. Gil-Monte PR: El síndrome de quemarse por el trabajo (burnout). Una
enfermedad laboral en la sociedad del bienestar Madrid: Pirámide Psicología;
2005.
56. Poghosyan L, Aiken LH, Sloane DM: Factor structure of the Maslach
burnout inventory: an analysis of data from large scale cross-sectional
surveys of nurses from eight countries. Int J Nurs Stud 2009,
46(7):894-902.
57. De Vente W, Kamphuis JH, Emmelkamp PM, Blonk RW: Individual and
group cognitive-behavioral treatment for work-related stress complaints
and sickness absence: a randomized controlled trial. J Occup Health
Psychol 2008, 13(3):214-31.
58. Faragher EB, Cass M, Cooper CL: The relationship between job satisfaction
and health: a meta-analysis. Occup Environ Med 2005, 62:105-12.
doi:10.1186/1477-7525-9-74
Cite this article as: Montero-Marín et al.: Towards a brief definition of
burnout syndrome by subtypes: Development of the “Burnout Clinical
Subtypes Questionnaire” (BCSQ-12). Health and Quality of Life Outcomes
2011 9:74.
Submit your next manuscript to BioMed Central
and take full advantage of:
• Convenient online submission
• Thorough peer review
• No space constraints or color figure charges
• Immediate publication on acceptance
• Inclusion in PubMed, CAS, Scopus and Google Scholar
• Research which is freely available for redistribution
Submit your manuscript at
www.biomedcentral.com/submit
Montero-Marín et al. Health and Quality of Life Outcomes 2011, 9:74
/>Page 12 of 12