báo cáo hóa học:" Medication quality and quality of life in the elderly, a cohort study" doc
Bạn đang xem bản rút gọn của tài liệu. Xem và tải ngay bản đầy đủ của tài liệu tại đây (322.75 KB, 9 trang )
RESEARCH Open Access
Medication quality and quality of life in the
elderly, a cohort study
Inger Nordin Olsson
1,2*
, Rebecka Runnamo
1,3
and Peter Engfeldt
1
Abstract
Background: Modern drugs have made large contributions to better health and quality of life. Increasing
proportions of neg ative side effects due to extensive pharmacological treatment are however observed especially
among elderly patients who have multiple health problems. The aim of our study was to see if there is an
association between medication quality and quality of life.
Methods: 150 pa tients discharged from hospital. Inclusion criteria were: living in ordinary homes, ≥ 75 years and ≥
5 drugs. Home visits were performed to all, including prescription reviews and calculation of medication
appropriateness index. The patients were divided into three groups depending on index score and followed for 12
months. The validated and recognized EQ-5D and EQ VAS instruments were used to assess quality of life.
Results: A lower medication quality was associated with a lower quality of life. EQ-5D index was statistically
significantly different (declining for each group) among the groups (p = 0.001 at study start, p = 0.001 at 6 months and
p = 0.013 at 12 months) as was EQ VAS (p = 0.026 at study start, p = 0.003 at 6 months and p = 0.007 at 12 months).
Conclusions: This study has shown the valid ity of the basic principle in prescribing: the more appropriate
medication the better quality of life. Since drug quality is related to the patients’ quality of life, there is immense
reason to continuo usly evaluate every prescription and treatment. The evaluation and if possible deprescribing
should be done as a process where both the patient and physician are involved.
Background
The ageing process and becoming old is a complex phase
encompassing many perspectives, for example loss of
functions and decreasing autonomy, higher morbidity and
need of care. With an ageing population the real challenge
for the healthcare system is the increasing burden of
chronic diseases and ongoing chronic medication [1].
Modern drugs have made great contributions to health
and quality of life (QoL), though increasing proportions of
negative side effects due to extensive pharmacological
treatment are observed. Prescribing for older people
demands specific knowledge [2,3]. Multi-medication or
polypharmacy, defined as ≥ 5 drugs [4,5] is among the
most obvious signs of risks in drug treatment, resulting
in increased risks for inappropriate drug use and adverse
drug reactions, followed by higher morbidity and hospita-
lization [6-9]. Polypharmacy also include risks of
underutilization of each dru g and underprescription of
appropriate drugs [10-12] all possibly affecting QoL. Drug
treatment can be either the fa cilitator which gives the
opportunities, or the opposite, an intens ifier of problems
by occurrence of unacceptable side effects leading to
decreased QoL.
Compared to other age groups there is a greater impact
of health and functional ability on QoL in older ages
[13,14]. If the goal of healthcare is both “to help people
live longer and feel better” [15] there is a need for new
outcome measures including QoL. In the area of medicine
this demands a paradigm shift towards shared decision
and incorporating the patient’s preferences when the cru-
cial factor is QoL [15]. The standardised and non-disease
specific EQ-5D instrument [16] is used to assess the
patient’s health related QoL. Together with their self-rated
QoL via the EQ VAS form, a reliable and valid depiction
of their QoL is obtained.
Assessment of prescription quality and medication
appropriateness demands reliable tools. The medication
appropriateness index (MAI) developed by Hanlon et al
* Correspondence:
1
Family Medicine Research Centre, School of Health and Medical Sciences,
Örebro University P.O. Box 1613, SE-701 16 Örebro, Sweden
Full list of author information is available at the end of the article
Nordin Olsson et al. Health and Quality of Life Outcomes 2011, 9:95
/>© 2011 Nordin Olsson et al; licensee BioMed Central Ltd. This is an Open Access article distributed under the terms of the C reative
Commons Attribution License ( http://creativeco mmons.org/licenses/by/2.0), which permits unrestricted use, distribution, and
reproduction in any medium, provided the original work is properly cited.
[17] has been shown to fulfil the criteria [17-19]. The
MAI score is a reliable instrument to evaluate the elderly
patient’s drug therapy [20], to continuously question the
treatment and the lack of follow up, to achieve better and
more appropriate prescribing and most of all to minimize
adverse drug events [3,21,22].
There are currently no studies that have definitively
deter mined whether various methods design ed to reduce
drug-related problems in the elderly affect QoL [23]. The
aim of our study was therefore to see if there is an associa-
tion between medication quality and quality of life. We
also wanted to examine if there is an association between
medication quality and cognitive impairment.
Methods
During the period September 2006 to May 2007, all
patients ready for discharge from the University Hospital
in Örebro, Sweden and fulfilling the criteria were eligible
for t he study. Inclusion criteria were: ≥ 75 years, ≥ 5
drugs and li ving in ordinary homes. Exclusion criteria
were dementia, abuse (all forms of abuse registered in the
patient’s medication record) or malignant disease diag-
nosed before the study start. Moving to a nursing home
during the study also resulted in exclusion. The electro-
nic care planning system (Meddix), used throughout the
County Council and municipalities, m ade the surveil-
lance of all discharges complete and all patients had the
same opportunity to be included. The study was per-
formed in primary care, since the family physicians are
responsible for the medical care of the elderly after dis-
charge from hospital. The patients in the study were
followed during one year with study end May 2008.
At time of discharge all patients were registered in the
care planning system and a message was sent to the
research centre. If the patient was eligible, a l etter con-
cerning the study including informed consent was sent
to the patient.
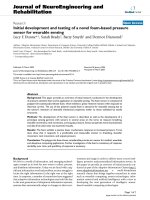
Within one month after discharge, a home visit was
made (Figure 1). It consisted of questions about satisfaction
and capability of managing the medication and the dosage
regimen/dispensing and screening for cognitive impair-
ment since this is often omitted and is a main issue for the
patients’ capa bility t o handle their medication. Both the
Mini Mental State E xamination (MMSE) [24] and clock
drawing test (CDT) were used, as the latter is more sensi-
tive to decline in activities and orientation in daily life
[25,26]. The patients also completed an EQ-5D and EQ
VAS survey. The study nurse asked all patients about their
drug regimen and compliance, to compare with their pre-
scriptions. The “true” drug lists (the combinations of pre-
scriptions from all physicians involved or previously
involved in the patient’s care) were then forwarded to the
research centre. After six months all the patients rece ived a
letter with a new E Q-5D and EQ VAS s urvey. The study
ended after 12 months with a follow-up home visit includ-
ing EQ-5D, EQ VAS and questions of drug utilization. All
thehomevisitsthroughoutthestudyweredonebythe
same stud y nurse.
To evaluate medication quality the MAI was used. This
index has been developed by Professor Hanlon et al and
was used after personal approval by Professor Hanlon.
The MAI is considered to be the most reliable and valid
comprehensive instrument of today [20]. It consists of
explicit criteria and implicit judgment meaning it permits
standardisati on and takes advantage from clinical knowl-
edge and judgment in the evaluation process [19,20]. The
MAI review is based on thorough examinations of the
patients’ medication lists, prescriptions and medical
records. Since all patients in the study had their medical
care provided by the County Council, all data concerning
the medical records and drug lists were available for the
researchers. The medical record for every study patient
was scrutinized systematically, by the same physician and
resear ch assistant throug hout the study, according to the
principles of MAI. Every drug was checked in accordance
with the MAI routine on ten items regarding medication
indication, effectiveness, dosage, directions, drug-drug
interactions, drug-disease interactions, practicality,
expense, duplication and duration [17,18]. This renders a
weighted MAI score per drug ranging between 0 (good
quality) and 18 (poor quality). In adherence with the prin-
ciples of appropriate prescribing for elderly [3,21,27,28]
the item of indication was deemed fundamental in our
analysis and s coring of MAI. The assessment of indica-
tions was based on the patients’ medical records.
Every patient’s medical record was scrutinized system-
atically for each drug:
1. Was there an evident diagnose admitting
prescription?
2. If not; were there a ny notes of a diagnose or
symptom two years before, during or one year after
the study?
3. If no diagnose was evident were there signs of
ongoing follow-up of a specific disease, for example
blood pressure or blood tests like lipids, thyroid hor-
mone and glucose?
Ifanyofthesethreeconditionswerefulfilledthedrug
was considered to have an indication. If the reviewed drug
was determined to be devoid of indication, the grade C
was given which in our analysis resul ted in a C in all the
nine following questions. Hence the drug received the
worst (highest) possible MAI score. The total MAI score
for each patient is calculated as the sum of the individual
drug MAIs for that patient.
To measure QoL and functional status the validated
questionnaire EQ-5D was used after approval of the
Nordin Olsson et al. Health and Quality of Life Outcomes 2011, 9:95
/>Page 2 of 9
EuroQol group. EQ-5D is a generic instrument eval uat-
ing function in five dimen sions (mobility, self-care, usual
activities, pain/discomfort and anxiety/depression)
[16,29]. The EQ-5D index was used for an overall estima-
tion of QoL. The prefe rence weights and the calculation
algorithm we used in this study were determined in the
UK using data from the Measurement and Valuation of
Health Survey [30]. EQ VAS was used for self-rating of
current health-related QoL.
The study participants were divided into three equal size
groups, A, B and C. The third of the patients with the low-
est MAI score (measured at study start) and therefore the
“best” medication quality was allocated to group A. Group
B and C represented the thirds with the “middle/centre”
respectively the “worst” medication quality. The groups
were then compared with respect to EQ-5D index and EQ
VAS at the three measuring points (study start, 6 months
and 12 months) and MMSE/CDT at baseline.
The Regional Ethics Committ ee of Uppsala University
approved the study.
Statistical analyses
The study groups were analysed with respects to EQ-5D
index and EQ VAS measured at study start, 6 months
and12months.Jonckheere-Terpstratrendtestacross
groups was performed. It tests the alternative hypothesis
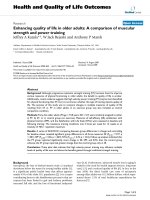
other reasons=10
* see methods
** 79% response rate
Dropouts for other reasons include no answer after three
telephone calls, not opening the door at agreed visiting time,
medical record not attainable and no lon
g
er willin
g
to participate.
Discharge from hospital
and care planning
procedure
n=434
Fulfilling criteria
Informed consent
Home visit by nurse
*
n=150
Medication
appropriateness index
n=140
Home visit by nurse*
n=106
EQ-5D and EQ VAS by
post**
dead=18
nursing home=5
other reasons=11
Study start
6 months
12 months
n=110
Figure 1 Study flow chart.
Nordin Olsson et al. Health and Quality of Life Outcomes 2011, 9:95
/>Page 3 of 9
that the population medians are ordered in a particular
direction (that is, if there is a dose-response relationship).
To be able to correct for number of drugs, sex and
age as possible confo unding factors, we created a line ar
multiple regression model with the EQ-5D index utility
as response variable. The explanatory variables of pri-
mary interest were total MAI score, sex, age and num-
ber of medications. We also performed similar
calculations with EQ VAS as the response variable.
To adjust for comorbidities we used the Charlson
Comorbidity Index [31].
In addition we analysed the different MAI groups with
respects to MMSE and CDT using the Jonckheere-Terpstra
test.
ThedatawereanalyzedusingtheSPSSprogram,
version 15.
Results
150 patients w ere identified for inclusion in the study
(Figure 1). Table 1 shows the characteristics of our study
population. The proportion of patients satisfied with
their drug therapy and patients’ self-rated ability to han-
dle their drug therapy is presented in Table 1. 84% of the
patients in the study claimed to be satisfied with their
drug therapy but only 56% felt able to handle their drug
regimen. 79% of our patients preferred life quality over
long life. Notable is the fact that 32% of the participants
had MMSE < 25 as well as reductions in CDT score indi-
cating possible cognitive impairment. The number of
deaths during the 12 month study period in group A, B
and C were 5 (11 %), 7 (15%) respectively 6 (13 %). 1, 4
respectively2ofthesepatients died within the first
6 months.
The results from calculating MAI are presented in
Table 2 as are the number of drugs per patient. In addi-
tion to wrong dosages, interaction/duration problems
etc, the fact that a relatively large part of drug regiments
lack indicatio n causes surprisingly high tot al MAI
scores. Extreme polypharmacy, defined as taking ≥ 10
drugs was common and persistent in all three groups
(Table 2). Some drugs are considered to pose special
risks for the elderly [23]. These are presented in Table 3
together with percent of patients taking the drug and
percent of prescriptions lacking indication.
QoL, measured by EQ-5D, is presented as recom-
mended by the EuroQol group [16] (Table 4).
The results from our statistical analysis are presented
in Table 5 and 6. The Jonckheere-Terpstra test shows
that a lower medication quality is associated with a
lower quality of life. EQ-5D index was statistically signif-
icantly different (declining for ea ch group) among the
groups (p = 0.001 at study start, p = 0.001 at 6 months
and p = 0.013 at 12 months) as was EQ VAS (p = 0.026
at study start, p = 0.003 at 6 months and p = 0.007 at
12 months).
The same analysis was performed after dividing the
study group into two age groups (above and below med-
ian; ≤ 83, ≥ 84 years) and male/female groups to adj ust
for age and sex. Even with these small groups the results
remain statistically significant for EQ-5D for 9 out of 12
comparisons (4 groups, 3 different point s in time) a nd
the trend towards lower EQ-5D with lower medication
quality still remains between the groups. For EQ VAS the
results were statistically significant for 7 out of 12 com-
parisons. The same trend with declining EQ VAS with
lower medication quality remains.
When we performed the linear regression with EQ-5D
index as the response variable and MAI groups, age, sex
and number of drugs as explanatory variables we basi-
cally found similar results. The difference in EQ-5D
index between group A an d group C was statistically sig-
nificantatthefirsttwopointsintimebutnotatthe12
month measuring point (p = 0.019 at study start, p =
0.011 at 6 months a nd p = 0.233 at 12 months). There
was no statistically significant difference between the
middle group and the group with the highest MAI score.
Table 1 Characteristics of the study population
Total
n = 140
Group A
n=47
Group B
n=47
Group C
n=46
Age; mean 83.4 (5.0) 83.3 (4.5) 84.3 (5.4) 82.7 (5.0)
Sex; women (%) 62.1 66.0 53.2 67.4
men (%) 37.9 34.0 46.8 32.6
Mini Mental State Examination (MMSE); 1) median, 2) mean 1) 27 (23 - 28)
2) 25.6 (3.8)
1) 26 (23 - 28)
2) 25.2 (3.5)
1) 27 (23 - 29)
2) 25.3 (4.6)
1) 27 (24 - 29)
2) 26.2 (3.1)
Clock Drawing Test (CDT);
1) median, 2) mean
1) 2.0 (1.0 - 3.0)
2) 1.8 (0.9)
1) 2.0 (1.0 - 3.0)
2) 1.9 (0.9)
1) 2.0 (1.0 - 2.0)
2) 1.7 (0.9)
1) 2.0 (1.8 - 3.0)
2) 1.9 (1.0)
Are satisfied with drug therapy (%) 84.3 85.1 87.2 80.4
Feel able to handle drug therapy (%) 55.7 63.8 44.7 58.7
Prefer life quality before long life (%) 79.3 78.7 78.7 80.4
The va lues are presented as mean (± SD), median (IQR) or percentage.
Nordin Olsson et al. Health and Quality of Life Outcomes 2011, 9:95
/>Page 4 of 9
When performing the linear regression with EQ-5D
index as the response variable and MAI groups, age, sex
and Charlson Comorbidity Index as explanatory variables
we found that comorbidity did not affect EQ-5D index.
The d ifference in EQ-5D between MAI group A and
group C was remained statistically signif icant at the all
three points in time (p = 0.001 at study start, p = 0.002 at
6 months and p = 0.033 at 12 months). There was no sta-
tistically significant difference between the middle group
and the group with the highest MAI score.
For EQ VAS, there was a statistically significant differ-
ence between group A and C at the six and 12 month
measuring points but not at baseline (p = 0.052 at study
start, p = 0.009 at 6 months and p = 0.042 at 12
months). As with EQ-5D index, there was no statistically
significant difference between the middle group and the
group with the highest MAI score.
Number of drugs had a statistically significant impact
on both EQ-5D index and EQ VAS at all points in time.
Sex or age did not affect either EQ-5D index or EQ
VAS.
We also analysed the different MAI groups with respects
to MMSE and CDT using the Jonckheere-Terpstra test. In
our study group we could not find any indication that cog-
nitive impairment is associated with low medication
quality.
Discussion
The main result of our study demonstrates an association
between medication qua lity and QoL. Through the stu dy
and by using reliable instruments, MAI together with
EQ-5D and EQ VAS, we have been able to visualize the
association between inappropriate medication and low
QoL. We found a rema rkable high number of patients
Table 2 Drug treatment and Medication Appropriateness Index
Study start
Total Group A Group B Group C
Number of drugs per patient;
median
10.0 8.0 10.0 12.0
Number of drugs lacking indication per patient; median 3.0 1.0 3.0 6.0
Number of drugs lacking indication per patient; min - max 0 - 15 0 - 2 2 - 4 4 - 15
MAI score
median
54.0 18.0 54.0 108.0
MAI score
mean
61.3 16.0 51.3 117.7
MAI score
min - max
0 - 270 0 - 36 36 - 72 72 - 270
Table 3 Special risk drugs
Percent taking the drug Percent lacking indication
Analgesics (light), ongoing 40.1 36.3
Analgesics (midrange), ongoing 7.5 50.0
Analgesics (strong), ongoing 9.5 47.1
Bulk/laxatives, ongoing 22.4 67.9
Benzodiazepines (short acting), total 10.2 82.4
Benzodiazepines (long acting), total 4.8 66.7
Sleeping tablets, total 44.2 88.1
NSAID, total 5.4 50.0
Neuroleptics, total 3.4 100.0
PPI, totalt 27.9 57.9
Digoxin, total 13.6 35.0
Loop diuretics, total 59.9 18.6
SSRI, total 19 70.4
Other anticholinergics*, total 21.8 70.4
NSAID - Non-Steroidal Anti-Inflammatory Drug
PPI - Proton-Pump Inhibitor
SSRI - Selective Serotonin Reuptake Inhibitor
*Amitriptyline, Clomipram ine, Clemastine, Desloratadine, Hydroxyzine, Loratadine, Montelukast and Tolterodine
Nordin Olsson et al. Health and Quality of Life Outcomes 2011, 9:95
/>Page 5 of 9
with inappropriate medication. The findings are of
importance for the individual as well as the healt hcare
system since the vulnerable group of elderly with chronic
health problems and chronic drug treatment is growing.
We find it remarkable that more than four out of five
patients in th e study are satisfied with their drug therapy
while only slightly more than half the patients feel able to
handle their drug regimen and the calculation of MAI
shows us that medication quality is overall poor. A possi-
ble reason for the low self-rated capability to handle drug
regimens is the fact that almost one third of the partici-
pants had MMSE < 25 as well as reductions in CDT
score, indicating cognitive impairment. A reason for
patients claiming to be satisfied with their drug therapy
while not being able to handle it could be trust in the
“good doctor” and fear of damaging the doctor-patient
relationship by voicing concerns about their drug therapy
[32].
AnimportantaspectiswhethertheMMSEandCDT
results in our study indicate the ability of the patients to
properly fill in the EQ-5D. A ccording to previous
research the EQ-5D is well suited for evaluating QoL in
a population with cognitive impairment [33].
It is a well established truth that drug treatment and
polypharmacy in the elderly are risk factors for adverse
drug reactions, hospitalization and mortality [22,34,35].
These are factors known to affect QoL. In this study w e
set out to see if medication quality could also be associated
to life quality. The reason for this is that we wanted to
study quality of drug treatment from a patient perspective.
With increasing number of elderly who faces the problems
that come with old age, chronic medication and chronic
diseases, the real challenge for the healthcare of tomorrow
is both “to help people live longer and feel better” [15]. To
achieve this, the healthcare professions need to adopt new
outcomes, including QoL. By choosing QoL as an out-
come in stead of solely treatment goals per se we wanted
to accomplish more of a patient focus and a movement
towards shared decisions by empowerment of patient
participation.
Polypharmacy is a giant challenge in many ways, but the
objective of our study is ap propriateness of the prescrip-
tions in a wide perspective, meaning the burden of drug
treatment for each patient. Appropriateness of medication
is therefore the key word in every part of the discussion,
because if appropriate and needed then the benefits of the
medications are obvious for optimizing QoL. But as
shown here, in many cases there is no indication for the
treatment which is devastating throughout the system and
especially for the patient. Indication as the basic principle
for prescribing is learned by every medical student and is
emphasized in the regulations for physicians and also in
the reimbursement system for drug treatment. A finding is
that there might have been an indication once, but no one
Table 4 Frequency distribution (profile) of the EQ-5D
descriptive system at baseline
Group A
(n = 47)
Group B
(n = 47)
Group C
(n = 46)
Mobility
no problems (%) 13 6 13
some problems (%) 78 85 80
confined to bed (%) 9 9 7
Self-Care
no problems (%) 69 61 60
some problems (%) 24 28 33
unable to (%) 7 11 7
Usual Activities
no problems (%) 48 56 31
some problems (%) 35 20 33
unable to (%) 17 24 36
Pain/Discomfort
none (%) 31 22 22
moderate (%) 54 54 58
extreme (%) 15 24 20
Anxiety/Depression
none (%) 54 46 45
moderate (%) 39 46 53
extreme (%) 7 8 2
The internal loss of follow up was ≤ 3 in all groups.
Table 5 Medication appropriateness and quality of life
Group EQ-5D index
at study start
EQ-5D index
at 6 months
EQ-5D index
at 12 months
Mean Median n= Mean Median n= Mean Median n=
A (lowest MAI score) 0.58 0.73 47 0.59 0.69 34 0.57 0.73 33
B (medium MAI score) 0.51 0.66 44 0.50 0.60 32 0.43 0.62 32
C (highest MAI score) 0.33 0.39 46 0.32 0.41 32 0.37 0.37 34
p = 0.001 p = 0.001 p = 0.013
Statistical analyses were done using Jonckheere-Terpstra trend test.
A higher MAI score equals worse medication quality.
A higher EQ-5D index represents better quality of life (range 0 - 1, though negative values are possible and represents status “worse than death”).
Nordin Olsson et al. Health and Quality of Life Outcomes 2011, 9:95
/>Page 6 of 9
has done a follow up, no one has adjusted the dose, no one
has defined the time for treatment or the costs. The pre-
sences of interactions remain unnotic ed. All these are
important factors for the patients undergoing treatment as
it affects their QoL. For some types of drugs this can seem
as an issue of low significance (for examp le laxatives and
vitamin pills) but the list of inappropriate drugs in our
patient group also includes pain killers, sleeping pills and
diuretics and in the worst cases anticoagulants and insulin.
In every respect these results show lack of systematic work
in the prescription process. The use of MAI with its expli-
cit and implicit criteria gives an extensive and to some
extent depressive perspective and shows the omission to
fulfill the obligations connected to drug treatment.
To prescribe drugs is important in medical treatment
and demonstrates initiative and action, but good and
appropriate prescribing demand s many considerations. It
involves evaluation of symptoms, follow u p of effect,
adjustment of dose and monitoring over t ime as well as
deprescribing when indicated [21,28,36]. Prescribing for
elderly demands special knowledge and close monitoring
[23]. This includes courage to deprescribe and the neces-
sity of avoiding the prescribing casc ade [37]. For the
elderly patients who have multiple health problems, the
risks increase as there are often many prescribers with
different specializations involved, focusing on their area
of specialization and with no one taking an overall
responsibility regarding the patient [23].
The patie nt’s QoL has historical ly been neglected since
other outcomes are judged more important. Today there
are guidelines for treatment of individual diseases, but
there is a lack of guidelines and goals for treatment of the
elderly wit h many diseases [38]. In the healthcare system
there are now established incitements and rewards for
following the guidelines for drug treatment (number of
patients with recommended prescriptions) while consid-
ering the patient’s quality of life is subordinate.
Some limitations should be acknowledged. In this study
we have use d one measure of QoL, the EQ-5D in dex.
This is probably the most recognized instrument for
measuring QoL and it is extensively used in international
studies. It is nevertheless possible that a different result
would be obtained wi th a different measure of QoL. The
same pertain to our chosen measure of medication
quality.
The MAI scoring system does not take into account
that a patient might lack certain drugs that could be ben-
eficiary to them, i.e. underprescription. The possible
reduction in QoL and associated costs resulting from this
underprescription is therefore not taken into account in
this study.
Our study concentrates on the population of elderly
with multiple medications and chronic diseases. Conclu-
sions from this study can therefore not be used to gener-
alize about other parts of the population/community. It
is also a small study. More and bigger studies are needed
to investigate the impact of poor medication quality in
the general population and to confirm the results from
this study.
In this study it was not possible to separate disease
groups from one another sinc e all patients in the study
were multi-diseased and had medical conditions from
several different disease groups. If we would have been
able to separate the different disease groups, and adjust
for these in the analysis, we believe that we might have
found a stronger relationship between medication quality
and QoL. We believe that it is a possibility t hat poor
medication quality in certain disease groups has a bigger
impact on QoL than others. Further studies are needed
to evaluate if and how poor medication quality in differ-
ent disease groups affect QoL.
The strength of our study is that it is performed in care
as usual. Another strength is the fact that we are describ-
ing a group of people that w ill keep growing as the base
of the population pyramid in the western world is con-
tracting while the top is expanding. This means that mea-
sures to improve medication quality in the elderly in
ordertoimproveQoLwillbeawaytochangealotfor
lots of patients. The fact that we are using the patients’
self stated medication lists as a basis for evaluating their
prescript ions is both a strength and a weakness. By doing
this, we are more likely to capture what medications the
Table 6 Medication appropriateness and quality of life
Group EQ VAS
at study start
EQ VAS
at 6 months
EQ VAS
at 12 months
Mean Median n= Mean Median n= Mean Median n=
A (lowest MAI score) 55.8 50.0 47 61.0 60.0 33 63.2 60.0 32
B (medium MAI score) 51.2 50.0 43 51.7 50.0 32 51.0 50.0 32
C (highest MAI score) 46.2 50.0 46 45.2 50.0 29 51.7 50.0 34
p = 0.026 p = 0.003 p = 0.007
Statistical analyses were done using Jonckheere-Terpstra trend test.
A higher MAI score equals worse medication quality.
A higher EQ VAS represents better self-rated quality of life (range 0 - 100).
Nordin Olsson et al. Health and Quality of Life Outcomes 2011, 9:95
/>Page 7 of 9
patient is actually tak ing but we a re also subject to the
patients’ forgetfulness or possible unwillingness to share
information.
When applying to the Hippocratic Oath, physicians
are taught to do well and not to harm. The hierarchic
structure of healthcare has undergone tremendous
changes but the patient is still in a weak position despite
the ongoing discussion of patient participation and
empowerment. In a world of pharmacological possibili-
ties the debate regarding prescribing ought to be as pro-
minent as ever. Concerning the elderly pati ent there
must be a crusade finding the breaking point were the
intention to do “well” and not to harm means to depre-
scribe or refrain from prescribi ng based on shared deci-
sion with the patient to prioritize their QoL.
Conclusion
Drug treatment in the elderly is a huge challenge for
healthcare. Since drug quality is related to the patient’s
quality of life, there is immense reason to continuously
evaluate every prescription and treatment. The evalua-
tion and if possible deprescribing should be done as a
process where both the patient and physician are
involved.
List of abbreviations
CDT: Clock drawing test; MAI: medication appropriateness index; Meddix:
electronic care planning system; MMSE: Mini Mental State Evaluation; QoL:
quality of life
Acknowledgements
This study was supported by grants from Örebro County Council. Special
thanks to the study nurse Ewa Löfgren for her sterling work and Susanne
Collgård for her excellent work with compilation of the data.
Author details
1
Family Medicine Research Centre, School of Health and Medical Sciences,
Örebro University P.O. Box 1613, SE-701 16 Örebro, Sweden.
2
The National
Board of Health and Welfare Regional Supervisory Unit Central P.O. Box 423,
SE-701 48 Örebro, Sweden.
3
Faculty of Health Sciences, Linköping University,
SE- 581 83 Linköping, Sweden.
Authors’ contributions
INO participated in the design of the study, the statistical analysis and the
drafting of the manuscript. RR participated in the statistical analysis and the
drafting of the manuscript. PE participated in the design of the study and
the drafting of the manuscript. All authors read and approved the final
manuscript.
Competing interests
The authors declare that they have no competing interests.
Received: 14 March 2011 Accepted: 3 November 2011
Published: 3 November 2011
References
1. Hagstrom B, Mattsson B, Wimo A, Gunnarsson RK: More illness and less
disease? A 20-year perspective on chronic disease and medication.
Scand J Public Health 2006, 34:584-8.
2. Le Couteur DG, Hilmer SN, Glasgow N, Naganathan V, Cumming RG:
Prescribing in older people. Aust Fam Physician 2004, 33:777-81.
3. Milton JC, Hill-Smith I, Jackson SH: Prescribing for older people. Bmj 2008,
336:606-9.
4. Agostini JV, Han L, Tinetti ME: The relationship between number of
medications and weight loss or impaired balance in older adults. JAm
Geriatr Soc 2004, 52:1719-23.
5. Hovstadius B, Astrand B, Petersson G: Assessment of regional variation in
polypharmacy. Pharmacoepidemiol Drug Saf 2010, 19:375-83.
6. Franic DM, Jiang JZ: Potentially inappropriate drug use and health-
related quality of life in the elderly. Pharmacotherapy 2006, 26:768-78.
7. Hamilton HJ, Gallagher PF, O’Mahony D: Inappropriate prescribing and
adverse drug events in older people. BMC Geriatr 2009, 9:5.
8. Liu GG, Christensen DB: The continuing challenge of inappropriate
prescribing in the elderly: an update of the evidence. J Am Pharm Assoc
(Wash) 2002, 42:847-57.
9. O’Mahony D, Gallagher PF: Inappropriate prescribing in the older
population: need for new criteria. Age Ageing 2008, 37:138-41.
10. Cleland JG, Baksh A, Louis A: Polypharmacy (or polytherapy) in the
treatment of heart failure. Heart Fail Monit 2000, 1:8-13.
11. Kuijpers MA, van Marum RJ, Egberts AC, Jansen PA: Relationship between
polypharmacy and underprescribing. Br J Clin Pharmacol 2008, 65:130-3.
12. Turnheim K: Drug dosage in the elderly. Is it rational? Drugs Aging 1998,
13:357-79.
13. Vaarama M: Care-related quality of life in old age. European Journal of
Ageing 2009, 6:113-25.
14. Walker A, Lowenstein A: European perspectives on quality of life in old
age. European Journal of Ageing 2009, 6:61-6.
15. Kaplan RM:
The significance of quality of life in health care. Qual
Life Res
2003, 12(Suppl 1):3-16.
16. The EuroQol Group: Euro-Qol - a new facility for the measurement of
health-related quality of life. Health policy 2009, 16(3):199-208.
17. Hanlon JT, Schmader KE, Samsa GP, Weinberger M, Uttech KM, Lewis IK,
Cohen HJ, Feussner JR: A method for assessing drug therapy
appropriateness. J Clin Epidemiol 1992, 45 :1045-51.
18. Fitzgerald LS, Hanlon JT, Shelton PS, Landsman PB, Schmader KE,
Pulliam CC, Williams ME: Reliability of a modified medication
appropriateness index in ambulatory older persons. Ann Pharmacother
1997, 31:543-8.
19. Samsa GP, Hanlon JT, Schmader KE, Weinberger M, Clipp EC, Uttech KM,
Lewis IK, Landsman PB, Cohen HJ: A summated score for the medication
appropriateness index: development and assessment of clinimetric
properties including content validity. J Clin Epidemiol 1994, 47:891-6.
20. Shelton PS, Fritsch MA, Scott MA: Assessing medication appropriateness
in the elderly: a review of available measures. Drugs Aging 2000,
16:437-50.
21. Maxwell S, Walley T: Teaching safe and effective prescribing in UK
medical schools: a core curriculum for tomorrow’s doctors. Br J Clin
Pharmacol 2003, 55:496-503.
22. Pham CB, Dickman RL: Minimizing adverse drug events in older patients.
Am Fam Physician 2007, 76:1837-44.
23. The Swedish Council on Health Technology Assessment S: How Can Drug
Consumption among the Elderly be Improved. Stockholm: SBU Statens
beredning för medicinsk utvärdering; 2009, Report No.: 193.
24. Heeren TJ, Lagaay AM, von Beek WC, Rooymans HG, Hijmans W: Reference
values for the Mini-Mental State Examination (MMSE) in octo- and
nonagenarians. J Am Geriatr Soc 1990, 38:1093-6.
25. Samton JB, Ferrando SJ, Sanelli P, Karimi S, Raiteri V, Barnhill JW: The clock
drawing test: diagnostic, functional, and neuroimaging correlates in
older medically ill adults. J Neuropsychiatry Clin Neurosci 2005, 17:533-40.
26. Shulman KI: Clock-drawing: is it the ideal cognitive screening test? Int J
Geriatr Psychiatry 2000, 15:548-61.
27. Jones BA: Decreasing polypharmacy in clients most at risk. AACN Clin
Issues 1997, 8:627-34.
28. World Health Organization: The WHO Patient Safety Curriculum Guide for
Medical Schools., 2009 2009.
29. Brooks RG, Jendteg S, Lindgren B, Persson U, Bjork S: EuroQol: health-
related quality of life measurement. Results of the Swedish
questionnaire exercise. Health Policy
1991, 18:37-48.
30.
Dolan P: Modeling valuations for EuroQol health states. Med Care 1997,
35:1095-108.
Nordin Olsson et al. Health and Quality of Life Outcomes 2011, 9:95
/>Page 8 of 9
31. Charlson ME, Pompei P, Ales KL, MacKenzie CR: A new method of
classifying prognostic comorbidity in longitudinal studies: development
and validation. J Chronic Dis 1987, 40:373-83.
32. Moen J: Multiple Medicine Use - Patients’ and general practitioners’
perceptions and patterns of use in relation to age and other patient
characteristics. [Dissertation]. Uppsala: Uppsala University; 2009.
33. Wolfs CA, Dirksen CD, Kessels A, Willems DC, Verhey FR, Severens JL:
Performance of the EQ-5D and the EQ-5D+C in elderly patients with
cognitive impairments. Health Qual Life Outcomes 2007, 5:33.
34. Hanlon JT, Artz MB, Pieper CF, Lindblad CI, Sloane RJ, Ruby CM,
Schmader KE: Inappropriate medication use among frail elderly
inpatients. Ann Pharmacother 2004, 38:9-14.
35. Klarin I, Wimo A, Fastbom J: The association of inappropriate drug use
with hospitalisation and mortality: a population-based study of the very
old. Drugs Aging 2005, 22:69-82.
36. Woodward M, Bird M, Elliot R, Lourens H, Saunders R: Deprescribing:
achieving better health outcomes for older people through reducing
medications. J Pharm Pract Res 2003, 33:323-8.
37. Rochon PA, Gurwitz JH: Optimising drug treatment for elderly people:
the prescribing cascade. Bmj 1997, 315:1096-9.
38. Boyd CM, Darer J, Boult C, Fried LP, Boult L, Wu AW: Clinical practice
guidelines and quality of care for older patients with multiple comorbid
diseases: implications for pay for performance. JAMA 2005, 294:716-24.
doi:10.1186/1477-7525-9-95
Cite this article as: Nordin Olsson et al.: Medication quality and quality
of life in the elderly, a cohort study. Health and Quality of Life Outcomes
2011 9:95.
Submit your next manuscript to BioMed Central
and take full advantage of:
• Convenient online submission
• Thorough peer review
• No space constraints or color figure charges
• Immediate publication on acceptance
• Inclusion in PubMed, CAS, Scopus and Google Scholar
• Research which is freely available for redistribution
Submit your manuscript at
www.biomedcentral.com/submit
Nordin Olsson et al. Health and Quality of Life Outcomes 2011, 9:95
/>Page 9 of 9