báo cáo hóa học:" Do diabetes and depressed mood affect associations between obesity and quality of life in postmenopause? Results of the KORA-F3 Augsburg population study" pdf
Bạn đang xem bản rút gọn của tài liệu. Xem và tải ngay bản đầy đủ của tài liệu tại đây (412.65 KB, 10 trang )
RESEARCH Open Access
Do diabetes and depressed mood affect
associations between obesity and quality of life
in postmenopause? Results of the KORA-F3
Augsburg population study
Daniela A Heidelberg
1
, Rolf Holle
2
, Maria E Lacruz
3
, Karl-Heinz Ladwig
3
and Thomas von Lengerke
1,2*
Abstract
Background: To assess associations of obesity with healt h-related quality of life (HRQL) in postmenopausal
women, and whether depressed mood and diabetes moderate these associations.
Methods: Survey of 983 postmenopausal women aged 35-74, general population, Augsburg region/Germany,
2004/2005. Body weight/height and waist/hip circumference were assessed anthropometrically and classified via
BMI ≥ 30 as obese, and WHR ≥ 0.85 as abdominally obese (vs. not). Depressed mood was assessed by the
Depression and Exhaustion-(DEEX-)scale, diabetes and postmenopausal status by self-report/medication, and HRQL
by the SF-12.
Results: General linear models revealed negative associations of obesity and abdominal obesity with physical but
not mental HRQL. Both forms of excess weight were associated with diabetes but not depressed mood.
Moderation depended on the HRQL-domain in question. In non-diabetic women, depressed mood was found to
amplify obesity-associated impairment in physical HRQL (mean “obese"-"non-obese” difference given depressed
mood: -6.4, p < .001; among those without depressed mood: -2.5, p = .003). Reduced mental HRQL tended to be
associated with obesity in diabetic women (mean “obese"-"non-obese” difference: -4.5, p = .073), independent of
depressed mood. No interactions pertained to abdominal obesity.
Conclusions: In postmenopausal women, depressed mood may amplify the negative impact of obesity on
physical HRQL, while diabetes may be a precondition for some degree of obesity-related impairments in mental
HRQL.
Keywords: obesity, health-related quality of life, postmenopause, depressed mood, diabetes mellitus
Background
While the evidence on the effects of the menopausal
transition on health-related quality of life (HRQL) is
inconclusive [1], it is rather clear regarding effects of
menopausal symptom s [2]. Avis et al. [3] found that the
menopausal transition showed little impact on physical
HRQL when adjusted for symptoms, medical conditions,
and stress. Williams et al. [4] r evealed that post meno-
pausal women with severe vasomotor symptoms fe lt
more impaired in their daily activities than those with
moderate or mild symptoms. T imur and Sahin [5]
showed that menopause-specific quality of life was
impaired in menopausal women with sleep disturbances.
Finally, van Dole et al. [6] found that in postmenopausal
period, increasing vasomotor symptoms were associated
with a small but significant increase in psychosocial
symptoms (e.g. dissatisfaction with personal life).
The role of chronic medical conditions for HRQL in
postmenopause seems less clear. Avis et al. [3] studied
arthritis and migraines, and found that especially the
former contributed to reduced physical HRQL. Sanfélix-
Genovés et al. [7] identified osteoporotic vertebral
* Correspondence:
1
Hannover Medical School, Medical Psychology Unit (OE 5430), Carl-
Neuberg-Str. 1, 30625 Hannover, Germany
Full list of author information is available at the end of the article
Heidelberg et al. Health and Quality of Life Outcomes 2011, 9:97
/>© 2011 Heidelberg et al; licensee BioMed Central Ltd. This is an Open Access article distributed under the terms of the Creative
Commons Attribution License ( which permits unrestricted use, distribution, and
reproduction in any medium, provided the original work is properly cited.
fractures to be associated with significantly lowered phy-
sical HRQL. Schwarz et al. [8] used a multi-morbidity
index including hypertension , unspecified chronic back
pain, arthrosis, varicosis, elevated blood lipids, migraine,
thyroid disease, osteopor osis, arthritis and diabetes mel-
litus. Multi-morbidity was linearly associated with pain
and gastrointestinal symptoms. However, due to sum-
scoring no assertions could be drawn as to which dis-
eases produced the differences. In their review, Jones
and Sutton [9] argued that a condition particularly
important for postmenopausal HRQL is obesity, as
women tend to gain weight especially during the meno-
pausal transition.
Although obesity has been shown to be associated
with reduced physical HRQL, in most s tudies no asso-
ciation has been found for mental HRQL [10]. A com-
parable assertion holds for postmenopausal obesity,
which is associated with poor HRQL, particularly
regarding physical functioning, energy/vitality, and gen-
eral health perceptions [9]. This is surprising consider-
ing the shared biology of obesity and depression [11].
Also, social stigmatisation associated with obesity may
reduce mental HRQL [12]. Therefo re, postmenopausal
women who are obese could be expected to be more
impaired in mental HRQL than their non-obese coun-
terpa rts. Possibly, the existing small associat ions may be
explained by restrictions of decreased mental HRQL to
obese groups with co-morbidities. E.g., Banegas e t al.
[13] found cumulative effects of obesity, diabetes and
hypertension on HRQL in women 60 years or older.
Obese w omen with diabetes showed greater-than-addi-
tive declines not only in physical, but mental HRQL as
well. Regarding mental morbidity, Ladwig et al. [14]
found a small synergistic effect of depressed mood with
obesity on long-term cardiovascular risk in obese
women aged 45 to 74 years.
Considering these finding s and the pathophysiological
cluster including visc eral fat, de pressive and meta bolic
disorders [15], the present study investigates the syner-
gistic effects of obesity, d epressedmoodanddiabetes
mellitus (as examples of chronic conditions) on physical
and mental H RQL in postmenopausal women from the
general population.
Methods
Population and sampling
The present sample of 983 postmenopausal women was
derivedasfollows.Tobeginwith,datacomefroma
general p opulation survey in the Augsburg region, Ger-
many. This survey (F3) was conducted in 2004-2005
within the Cooperative Health Research in the Region of
Augsburg (KORA [16]) as a follow-up to a 1994-1995
survey (S3). Central elements of data collection were a
computer-aided personal interview (CAPI), a self-
administered questionnaire, physical examination by
trained personal (including assessments of body weight
and height) and blood sampling.
The sampl e of the original 1994-1995 survey (S3) had
been selected from 394,756 German residents aged 25-
74 in 1994 via two-stage random cluster sampling. First,
17 communities were selected (probabilities proportional
to size): Augsburg city and 16 communities from the
two adjacent counties. In eac h community and within
each of 10 strata defined by sex and 10-year age gro ups,
a simple random sample was drawn from public registry
office listings.
In the follow-up (F3), 3,006 S3-respondents partici-
pated (response: 76%). Additionally, of former non-
responders, 178 (14%) participated, giving a total N of
3,184 (aged: 35-84). Approval of the responsible Ethics
Committee (Bayerische Landesärztekammer, Munich,
Germany) and informed consent of all survey partici-
pants was secured.
All participants of the follow-up F3 who were older
than 74 years were excluded since some measures rele-
vant to the present study had not been administered to
them to avoid undue burden (N = 371). Underweight
respondents (BMI in kg/m
2
<18.5, N = 1 5) as well as
participants living outside the study region (N = 30)
were excluded. Finally, 29 had refused and 7 had been
too ill or had no time to fill in the questionnaire.
Of the remaining 2,732 F3-participants, all men (N =
1,312), all premen opausal women (N = 4 33, see b elow)
and 4 women with no information on menopausal status
were excluded from the present analysis. Thus, even-
tually a samp le of N = 983 postmenopausal women was
available for analysis.
While a non-responder analysis is not available for the
KORA study F3, informationonnon-respondersfrom
the same population and a similar survey design can be
extrapolated from a non-responder analysis of the for-
mer KORA-study S4 [17]. In this analysis, 49% of the
initial non-responders had participated and - compared
with responders - more often had lower education
(maximally secondary school with low academic level
[German: “Hauptschule”]: 65% vs. 54%) and f air or poor
self-rated health (28% vs. 21%), were more often unmar-
ried (34% vs. 29%) and smokers (29% vs. 26%), and
more frequently reported physician visits in the last four
weeks (46% vs. 38%), myocardial infarction (6% vs. 3%),
and diabetes (7% vs. 4%).
Measures
HRQL
HRQL was assess ed via the first edition of German ver-
sion of the SF-12 (1998, self-administered versio n) [18],
a generic quality of life instrument with good reliability
and validity. It yields one continuous summary score
Heidelberg et al. Health and Quality of Life Outcomes 2011, 9:97
/>Page 2 of 10
each for subje ctive physical and mental health. Scores
range from 0 to 100, with higher values indicating better
HRQL.
Postmenopausal status
Postmenopausal status was assessed via self-report in a
computer-aided personal interview (CAPI) based on the
items “ Have you had menses within the last 12
months?” , “ Do you still have regular menstruation?” ,
and “At present, are you pregnant?”.Correspondingto
established definitions [1], “postmenopausal” was coded
given amenorrhea i n the preceding 12 months and no
current regular menses. Women with postmenopausal
status due to surgical procedur es such as oophorectomy
or hysterectomy were also included. Women with sys-
temic hormonal therapy (HT) were not automatically
classified as “postmenopa usal” , but only if they met the
indicated conditions. It was not focused on in the ana-
lyses, but considered as a confounder. HT has been
argued t o have the potential to improve HRQL in post-
menopausal women. In this sample, current HT users
(14%) reported poorer HRQL (as in [3]), especially in
the mental domain. Regarding the effects of obesity,
depressed mood and diabetes on HRQL, neither a ddi-
tional adjustment for current nor ever HT altered any
of the interaction effects reported below.
Obesity
Obesity was assessed by anthropometric examinations.
Body mass was indexed into BMI by dividing weight
(kg) by squared height (m
2
). Due to subsample sizes
(diabetes prevalence: 8.3%), only t wo BMI-groups were
contrasted (WHO-classification): “ non-obese”
(5≤BMI<30) and “obese” (BMI ≥ 30). Abdominal obesity
was defined as waist-to-hip ratio (WHR) of ≥0.85 [19].
WHR was selected since it is approximately equivalent
to waist circumference regarding its association with
diabetes among women [20]. Also, it is a mediator in
the relationship between obesity and depression [21],
and (following weight) the seco nd most important
anthropometric predictor of female bodily attractiveness
[22].
Diabetes mellitus
Diabetes was assessed via self-report and current anti-
diabetic medication. Regarding medication, participants
were asked to bring drug packages or package inserts of
drugs they currently use. Self-reports and medication
were compared and, given conflicting data, interviewer
notes and audio-recordings checked.
Depressed mood
Depressed mood was assessed by the Depression and
Exhaustion (DEEX) scale [23] based on the von-Zers-
sen-Symptom-List [24]. The scale combines eight items
(fatiguability, tiredness, irri tability, inner tension, ner-
vousness, anxiety, loss of energy, and difficulty in con-
centrating) leading to a Likert-l ike scale (scores from 0
to 24) normally distributed and with sufficient internal
consistency (a = 0.88). Subjects in the top tertile of the
distribution were considered as index group for subjects
with depressed mood [23].
Sociodemographic/-economic variables
Gender, age and place of residence (rural vs. urban)
were known via sampling. Family status and socioeco-
nomic status (SES) were assessed via interview. SES was
operationalised by school education, as in Germany it
relates stronger to obesity than income or occupational
status [25]. Respondents indicated their highest educa-
tion level: primary or secondary general school
("Grundschule” or “Hauptschule” in Germany), inter-
mediate secondary ("Realschule”), or grammar/upper
secondary school ("Gymnasium”).
Statistical analysis
Following descriptive and bivaria te analyses, general lin-
ear modelling (GLM) was conducted using the PASW-
Statistics-18 software. For each HRQL summary score,
one model was run t o test for differences by obesity (or
abdominal obesity), depressed mood, and diabetes.
Because of previously reported difficulties to detect
interactions in field studies [26], significance level for
interactions was set at p < .1, vs. p < .05 for main effects
(two-tailed). Given a significant interaction, stratified
analyses were conducted to clarify the underlying pat-
tern, i.e., with either obesity or abdominal obesity
defined as the focal independent variable, simple effects
or (given three-way interactions) simple simp le effects
[27] were tested. For stratified analysis, 95%-confidence
intervals for mean differences were calculated. Outlier
trimming was not applied. All models were adjusted for
age, education, family status, type of health insurance
(statutory vs. private), and place of residence (urban vs.
rural).
Results
Descriptive and bivariate analysis
Table 1 describes the sample. Overall, 29.5% of the 983
women were classified as obese, while 43.1% as having
abdominal obesity. Only a small minority was younger
than 45 years (4.4%). Almost two thirds had only low
school education. Nearly three-fourths lived with a part-
ner. About one eighth had private health insurance,
which is close to the overall German rate (10.5%).
Furthermore, 44.9% lived in the city of Augsburg, 8.3%
had diabetes, and 40% met the criteria for depressed
mood.
Bivariately, women with both general and abdominal
obesity were older than their non-obese counterparts,
and more often had completed secondary general school
only. Regarding diabetes, its prevalence was about three-
fold in the obese group, and about fourfold in those
Heidelberg et al. Health and Quality of Life Outcomes 2011, 9:97
/>Page 3 of 10
with abdominal obesity (15.5% vs. 5.3% and 14.6% vs.
3.6%, respectively).
Table 2 shows the mean scores of the SF -12 in differ-
ent subgroups. Physical HRQL decreases with age, lower
school education, and is lower in participants with statu-
tory health insurance. Additionally, it is significantly
lower in participants with obesity, abdominal obesity,
depressed mood, and diabetes. In contrast, mental
HRQL is significantly lower only in participants with
depressed mood, and marginally decreased in those not
living with a partner and those with statutory health
insurance.
GLM
In the four GLM, the hypotheses that the relations
between obesity defined by BMI or WHR and HRQL
are moderated by depressed mood and diabetes were
scrutinized. Table 3 shows the results for obesity (BMI
≥ 30) and Table 4 for abdominal obesity (WHR ≥ 0.85)
both for the physical sum score (left column) and the
mental sum score (right column) of the SF-12, re spec-
tively. Regarding physical HRQL (SF-12 Physical Sum
Score), for which results will be describ ed first, all main
effects (obesity, depression, and diabetes) as well a s the
three-way interaction are significant in the model with
BMI (Table 3, left column). As the adjusted means for
the main effects show, physical HRQL is lower in the
presence of obesity, depressed mood, or diabetes,
respectively (the pattern underlying the significant
three-way interaction will be described i n the next para-
graph). In contrast, only the main effects of depressed
mood and diabetes (and thus no interactions) are signifi-
cant in the model with WHR (Table 4, left column).
While here, the association of abdominal obesity w ith
impaired physical HRQL in bivariate analysis is attenu-
ated, adjusted means show that physical HRQL is
impaired given either depressed mood or diabetes melli-
tus. This indicates that the association of a bdominal
Table 1 Sample description: bivariate cross-tabulations of demographics, diabetes mellitus and depressed mood with
obesity and abdominal obesity
Total Non-
obesity
(BMI < 30)
(N = 693;
70.5%)
Obesity
(BMI ≥ 30)
(N = 290;
29.5%)
No
abdominal
obesity
(WHR < 0.85)
(N = 559;
56.9%)
Abdominal
obesity
(WHR ≥ 0.85)
(N = 424;
43.1%)
Characteristic n % n % n % c
2
Pn%n%c
2
p
Age (in years)
35-44 43 4.4 34 4.9 9 3.1 19.2 < .001 34 6.1 9 2.1 52.0 < .001
45-54 238 24.2 192 27.7 46 15.9 171 30.6 67 15.8
55-64 374 38.0 253 36.5 121 41.7 209 37.4 165 38.9
65-74 328 33.4 214 30.9 114 39.3 145 25.9 183 43.2
School education
High (grammar school [Gymnasium]) 102 10.4 90 13.0 12 4.2 40.8 < .001 77 13.8 25 5.9 38.1 < .001
Medium (intermediate school [Realschule]) 232 23.7 188 27.2 44 15.3 157 28.2 75 17.7
Low (maximally secondary general school
[Hauptschule])
645 65.9 413 59.8 232 80.6 322 57.9 323 76.4
Family status
Living with partner 712 72.5 501 72.4 211 72.8 0.0 < .908 408 73.0 304 71.9 0.2 .697
Not living with partner 270 27.5 191 27.6 79 27.2 151 27.0 119 28.1
Health insurance
Private 124 12.6 89 12.8 35 12.1 0.1 .739 75 13.4 49 11.6 0.8 .384
Statutory 859 87.4 604 87.2 255 87.9 484 86.6 375 88.4
Place of residence
Rural 542 55.1 381 55.0 161 55.5 0.0 .877 315 56.4 227 53.5 0.8 .380
Urban 441 44.9 312 45.0 129 44.5 244 43.6 197 46.5
Depressed mood (DEEX-scale)
Yes 392 40.0 272 39.4 120 41.7 0.5 .503 224 40.1 168 40 0.0 .982
No 587 60.0 419 60.6 168 58.3 335 59.9 252 60
Diabetes mellitus
Yes 82 8.3 37 5.3 45 15.5 27.7 < .001 20 3.6 62 14.6 38.5 < .001
No 901 91.7 656 94.7 245 84.5 539 96.4 362 85.4
Heidelberg et al. Health and Quality of Life Outcomes 2011, 9:97
/>Page 4 of 10
obesity is mediated by one or both of d epressed mood
or diabetes mellitus as given co-morbidities.
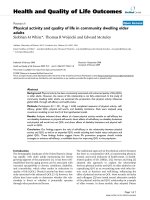
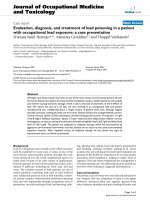
Figure 1 shows the pattern underlying the three-way
interaction in the model with obesity reported in Table 3
(F = 4.1, p = .044). Obesity is significantly associated with
lower levels of physical HRQL only among non-diabetic
women irrespective of depressed mood. Though among
non-depressed diabetic women, the difference between
obese vs. non-obese is numerically larger, it is statistically
insignificant. Simultaneously, among those with both
depressed mood and diabetes, the difference b etween obese
and non-obese women is smallest among all comparisons.
Further exploration of the three-way interaction (not
shown) revealed that while the two-way interaction of
obesity with diabetes was significant both among those
with and without depressed mood (F = 27.6 and F = 6.7,
both p ≤ .01), the two-way interaction of obesity with
depressed mood was significant only in the group with-
out but not in that with diabetes (F = 7.4, p = .007 vs. F
= 0.7, p = .405). In other words, in non-diabetic partici-
pants, the effect from BMI on physical HRQL is signifi-
cantly amplified given depressed mood, i.e. the mean
difference of -6.4 shown in Figure 1 is significantly
higher than the mean difference of -2.5.
Turning to mental HRQL, main effects of depressed
mood and diabetes are seen, with the effect of depressed
mood being considerably stronger (Table 3 and Table 4,
right columns). In contrast, neither obesity nor abdom-
inal obesity is significantly related to mental HRQL.
While in both models the interaction between depressed
mood and diabetes is significant, in the model with obe-
sity the interaction with d iabetes is significant as well.
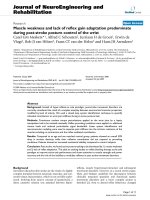
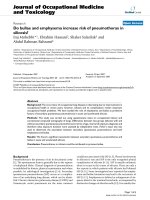
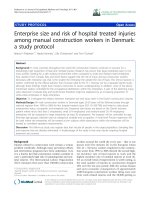
Figure 2 and Figure 3 show the un derlyin g patterns. On
one hand, obe sity is associated with a marginally signifi-
cant lower level of mental HRQL among women with
diabetes, with no difference among those without dia-
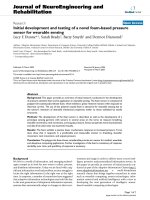
betes (see Figure 2). On the other hand, depressed
mood is associated with lower mental HRQL regardless
of diabetes status, however more strongly so in the dia-
betes group (see Figure 3; estimates are from the BMI-
model and equivalent to the WHR-model).
Discussion
Negative associations with physical but not mental
HRQL were found for gen eral and abdominal obesity in
a community sample of po stmenopausal women. Both
obesity-indicators were associated with diabetes but not
depressed m ood, the latter being in line with cross-sec-
tional studies from populations other than the US find-
ing no associations between obesity and depression [28].
Moderating effects of depressed mood and diabetes on
the relation between obesity and HRQL depended on
Table 2 Physical and mental health-related quality of life (SF-12) in different sub-groups: unadjusted bivariate analysis
SF-12 Physical Sum Score SF-12 Mental Sum Score
Source of variation Mean 95%-CI Mean 95%-CI
Age (in years) 35-44 48.7 45.9-51.5 F
(3,828)
= 6.8, p ≤ .001 50.0 46.8-53.1 F
(3,828)
= 1.5, p = .206
45-54 48.2 47.0-49.5 48.8 47.5-50.2
55-64 46.2 45.2-47.2 56.1 49.0-51.2
65-74 44.7 43.6-45.8 50.8 49.6-52.0
Education High (grammar school) 49.5 47.6-51.5 F
(2,825)
= 5.6, p = .004 49.4 47.2-51.6 F
(2,825)
= 0.6, p = .557
Medium (intermediate school) 46.2 44.9-47.4 49.5 48.2-50.9
Low (max. secondary general school) 46.0 45.2-46.7 50.3 49.4-51.2
Family status Living with partner 46.7 45.9-47.4 F
(1,829)
= 2.6, p = .110 50.4 49.6-51.2 F
(1,829)
= 3.7, p = .056
Not living with partner 45.5 44.3-46.7 48.9 47.5-50.2
Health insurance Private 48.1 46.3-49.8 F
(1,830)
= 4.2, p = .041 51.7 49.8-53.6 F
(1,830)
= 3.5, p = .061
Statutory 46.1 45.4-46.8 49.7 49.0-50.5
Place of residence Rural 46.7 45.9-47.5 F
(1,830)
= 1.5, p = .223 49.6 48.7-50.5 F
(1,830)
= 1.4, p = .232
Urban 45.9 44.9-46.9 50.5 49.4-51.5
Obesity (BMI ≥ 30) Yes 43.0 41.8-44.1 F
(1,830)
= 47.3, p ≤ .001 50.2 48.9-51.5 F
(1,830)
= 0.1, p = .759
No 47.7 47.0-48.5 50.0 49.1-50.7
Abdominal Obesity
(WHR ≥ 0.85)
Yes 45.4 44.4-46.4 F
(1,830)
= 6.1, p = .014 49.9 48.8-51.0 F
(1,830)
= 0.1, p = .823
No 47.0 46.2-47.9 50.1 49.2-51.0
Depressed mood
(DEEX-scale)
Yes 42.5 41.6-43.4 F
(1,829)
= 108.9, p ≤ .001 43.3 42.3-44.2 F
(1,829)
= 341.8, p ≤ .001
No 49.0 48.2-49.7 54.5 53.7-55.2
Diabetes mellitus Yes 42.4 40.1-44.6 F
(1,830)
= 13.1, p ≤ .001 48.5 46.0-51.0 F
(1,830)
= 1.6, p = .213
No 46.7 46.1-47.4 50.1 49.4-50.8
Heidelberg et al. Health and Quality of Life Outcomes 2011, 9:97
/>Page 5 of 10
the HRQL-dimension. Depressed mood significantly
reduced the score in physical HRQL, g iven no diabetes.
In contrast, reduced mental HRQL associated with o be-
sity was restricted to women with diabetes (independent
of depressed mood). Finally, the effect of depressed
mood in terms of reduced mental HRQL was found
both in diabetic and non-diabetic women, but was
stronger in the former group. Interactions between
Table 3 Physical and mental HRQL (SF-12) by obesity, diabetes mellitus, and depressed mood: GLM results
a
SF-12 Physical
Sum Score
SF-12 Mental
Sum Score
Source of variation Statistic Value 95%-CI Effect Value 95%-CI Effect
Obesity (BMI ≥ 30)
Yes Adjusted
mean
42.0 40.5-43.6 F
(1,825)
= 7.7, p = .006 47.7 46.2-49.3 F
(1,825)
= 0.3, p = .588
No Adjusted
mean
45.2 43.6-46.8 48.3 46.7-49.9
Depressed mood (DEEX-scale)
Yes Adjusted
mean
39.7 38.0-41.5 F
(1,825)
= 46.5, p < .001 41.7 39.9-43.5 F
(1,825)
= 122.4, p < .001
No Adjusted
mean
47.5 46.0-48.9 54.4 52.9-55.8
Diabetes mellitus
Yes Adjusted
mean
42.2 40.0-44.3 F
(1,825)
= 6.4, p = .012 46.7 44.5-48.9 F
(1,825)
= 5.3, p = .022
No Adjusted
mean
45.0 44.4-45.7 49.4 48.7-50.1
Obesity × Depressed Mood
b
F
(1,825)
= 0.1, p = .775 F
(1,825)
= 2.7, p = .104
Obesity × Diabetes mellitus
b
F
(1,825)
= 1.4, p = .236 F
(1,825)
= 3.2, p = .074
Depressed Mood × Diabetes mellitus
b
F
(1,825)
= 0.6, p = .431 F
(1,825)
= 3.7, p = .053
Obesity × Depressed Mood × Diabetes
mellitus
b
F
(1,825)
= 4.1, p = .044 F
(1,825)
= 0.6, p = .447
Notes:
a
Adjusted for age, school education, family status, type of health insurance (statutory vs. private), and place of residence (urban vs. rural)
b
To simplify
presentation, adjusted means for subgroups are not shown here (see below, interaction contrast analyses in figures 1 to 3)
Table 4 Physical and mental HRQL (SF-12) by abdominal obesity, diabetes mellitus, and depressed mood: GLM results
a
SF-12 Physical
Sum Score
SF-12 Mental
Sum Score
Source of variation Statistic Value 95%-C Effect Value 95%-CI Effect
Abdominal Obesity (WHR ≥ 0.85)
Yes Adjusted
mean
44.0 42.7-45.4 F
(1,825)
= 0.0, p = .978 47.7 46.4-49.1 F
(1,825)
= 0.0, p = .990
No Adjusted
mean
44.1 42.0-46.2 47.8 45.7-49.9
Depressed mood (DEEX-scale)
Yes Adjusted
mean
40.2 38.3-42.2 F
(1,825)
= 35.9, p < .001 40.9 38.9-42.8 F
(1,825)
= 118.0,
p < .001
No Adjusted
mean
47.9 46.3-49.5 54.6 53.0-56.2
Diabetes mellitus
Yes Adjusted
mean
42.2 39.7-44.6 F
(1,825)
= 8.6, p = .003 46.5 44.1-48.9 F
(1,825)
= 3.8, p = .051
No Adjusted
mean
46.0 45.0-46.6 49.0 48.4-49.6
Abdominal Obesity × Depressed Mood
b
F
(1,825)
= 0.4, p = .834 F
(1,825)
= 2.1, p = .144
Abdominal Obesity × Diabetes mellitus
b
F
(1,825)
= 0.3, p = .583 F
(1,825)
= 0.2, p = .670
Depressed Mood × Diabetes mellitus
b
F
(1,825)
= 1.2, p = .270 F
(1,825)
= 5.2, p = .022
Abdominal Obesity × Depressed Mood ×
Diabetes mellitus
b
F
(1,825)
= 0.6, p = .444 F
(1,825)
= 2.4, p = .125
Notes:
a
Adjusted for age, school education, family status, type of health insurance (statutory vs. private), and place of residence (urban vs. rural)
b
To simplify
presentation, adjusted means for subgroups are not shown here (see below, interaction contrast analyses in figures 1 to 3)
Heidelberg et al. Health and Quality of Life Outcomes 2011, 9:97
/>Page 6 of 10
Figure 1 Three-way interaction of obesity, diabetes and depressed mood on physical HRQL (SF-12)
a,b
.
a
adjusted for age, education,
family status, type of health insurance, and place of residence (urban vs. rural).
b
F-values represent simple simple effects of obesity within the
combinations of depressed mood and diabetes.
Heidelberg et al. Health and Quality of Life Outcomes 2011, 9:97
/>Page 7 of 10
abdominal obesity and depression or diabetes were not
observed.
These findings add observational evidence to the field
of postmenopause, HRQL, and chronic medical condi-
tions. In particular, that de pressed mood as a mental ill-
health state amplifies the negative impact of obesity on
physical HRQL (given a healthy state in terms of no dia-
betes), while diabetes (as a physical disease) turned out
to be a precondition for obesity-related impairments in
mental HRQL, reflects complex interrelations. Also, it is
intriguing that these patterns were found for general but
not abdominal obesity, especially given the latter’ ssig-
nificant role in the postmenopausal period [29]. Myint
et al. [30] found that an increase in WHR, but not in
BMI, was significantly associated with lower mental
health. The present finding that an elevated BMI was
associated with lower m ental HRQL in diabetic partici-
pants may refle ct that general obesity as a stressor may
potentiate its unfavourable effect on mental HRQL
when combined with a chronic condition.
Moreover, it is notable that the three-way interaction
between obesity, depressed mood and diabetes regarding
physical HRQL was driven more by the interaction of
obesity with depressed mood than with diabetes.
“Depressed mood” as defined by the DEEX-scale differs
from other measures as it detects physical, non-stigma-
tizing symptoms, and resembles the concept of vital
exhaustion [31]. This “general malaise” might prevent
coping with the strains obesity imposes on physical
HRQL. In contrast, diabetes may not only moderate, but
also mediate the association between obesit y and physi-
cal HRQL (similar to abdominal obesity), not least
because the etiological role of (abdominal) obesity for
diabetes is more clear-cut than for depressed mood
[13,14,20,21,28].
Strengths and limitations
A major strength of this study is the rigorous quality
assurance applied during data collection [1 6], allowing
to analyse a definite postmenopausal cohort with stan-
dardized, validated instruments. First, a limitation that
derives from the observational, cross-sectional design is
that reversed or bidirectional causality could not be
ruled out. However, effects of chronic conditions on the
relation between obesity and HRQL in postmenopausal
women have hardly been studied, warranting report of
the results.
Second, both the absolute sample size and observa-
tional approach implied an unbalanced design, of which
subsample sizes are indicative. While generally, small
subsamples tend to work against detecting significant
differences (thus testing conservatively), more sophisti-
cated analyses were unfeasible. Only two B MI- and
WHR-groups along could be differentiated (e.g., there
were only three normal weight women with diabetes).
Similarly, different diabetes types could not be con-
trasted since only one o f 82 had type 1 diabetes. Thus,
results by and large reflect effects of type 2 diabetes.
Also, factors such as othe r concomitant diseases, parity
or sexual activity could not be considered. The choice
of the DEEX-scale [23] in order to operationalise
depressed mood was influenced by subsample sizes as
well. This instrument has been shown to be useful to
identify depressed mood in otherwise apparently healthy
subjects in general populations. At the same time, unlike
the Hospital Anxiety and Depression Scale it is not
Figure 2 Two-way interaction of obesity and diabetes on
mental HRQL (SF-12)
a,b
.
a
adjusted for age, education, family
status, type of health insurance, and place of residence (urban vs.
rural).
b
F-values represent simple effects of obesity within groups
defined by diabetes status.
Figure 3 Two-way interaction of depressed mood and diabetes
on mental HRQL (SF-12)
a,b
.
a
adjusted for age, education, family
status, type of health insurance, and place of residence (urban vs.
rural).
b
F-values represent simple effects of depressed mood within
groups defined by diabetes status.
Heidelberg et al. Health and Quality of Life Outcomes 2011, 9:97
/>Page 8 of 10
specifically designed for groups with physical diseases,
and unlike the Patient Health Questionnaire-9 not
directly based on the diagnostic criteria for major
depressive disorders. However, in the present survey
using these alternatives would have resulted in one-digit
subsample sizes not suitable for analysis.
Third, the response rate (76%), though comparing well
to surveys with comparable participation time (in the
present survey this was, on average, 175 minutes, which
include all parts of the survey performed at one visit at
the study centre, and possible breaks during this visit),
may lead to selection biases, as healthier subjects are
more likely to parti cipate. Indeed, a non-responder sur-
vey in another KORA-study (S4) has revealed that
responders tend to be healthier (e.g. in terms of lower
diabetes rates; for details, see “ Population and sam-
pling” ). Yet, this rather reduces ability to detect
associations.
Fourth, HRQL-assessment by the SF-12 implies
restrictions. Unlike the SF-36 it does not allow to ana-
lyse sub-dimensions of physical and mental HRQL
(regarding its sum scores, however, it does compare well
to the SF-36 in the c ontext of obesity [32]]. Also, the
SF-12 is a generic instrument, and might not reflect
menopause-specific HRQL-dimensions as would e.g. the
Menopause-specific Quality of Life Questionnaire [33]
or the Menopause Rating Scale [34]. While the choice
of the SF-12 related to the fact that the KORA-survey
was not specifically designed to study menopausal
issues, using a generic instrument may also have advan-
tages in a study which scrutinizes different conditions
(obesity, diabetes, and depressed mood) as joint deter-
minants of postmenopausal HRQL. Thus, using a condi-
tion-specific instrument might have overlooked HRQL-
effects of o ther conditions, respectively. Also, generic
mental health-related quality of life has been shown to
be affected by the greatest reductions after weight gain
in a recent trial which included an obesity-specific mea-
sure (Impact of Weight on Quality of Life-Lite) [35].
Fifth, variances accounted for in GLM were 19% for
physical and 31% for mental HRQL in the models with
obesity, and 14% and 30% in those with abdominal obe-
sity. Those explained by significant interactions did not
exceed one percent. A lso, cross-validating the complex
interactions e.g. by partitioning was not possible, again
due to sample size restrictions. In terms of clinical sig-
nificance, however, the HRQL-impairments identified
are important. Subgroups reporting poorest physical
HRQL (obesity/depressed mood, and depressed mood/
diabetes) were worse off than those with either dia betes
or any cancer (excluding skin c arcinoma) in the SF-12
normative sample [18]. This also holds for the obesity-
associated impairment in mental HRQL among women
with diabetes.
Conclusions
This study provides observational evidence that
depressed mood significantly elevates obesity-associated
impairment in physical HRQL in postmenopausal
women in absence of a chronic condition (here: dia-
betes), and that a significant reducti on in mental HRQL
is restricted to obese women with diabetes. These effects
were not observed for abdominal obesity. By joint scru-
tiny of diff erent chronic conditions, this study follows
the call to c onsider clusters of symptoms, and mechan-
isms common to the clusters, in the context of develop-
ing a theoretical model of menopause, its symptoms,
and quality of life [36]. It may contribute to tailoring
interventions fostering HRQL in postmenopausal
women. Regarding physical HRQL, women most in
need may be those obese and feeling depressed. Regard-
ing mental HRQL, obesity and diabetes as interacting
factors seem worth of further scrutiny. In future studies,
the underlying p athophysiological mechanisms should
be investigated. Finally, lifestyle interventions should
take into account low HRQL associated with concomi-
tant depressed mood and diabetes, as it is a pre-treat-
ment predictor of unsuccessful weight control [37].
List of abbreviations
BMI: body mass index; GLM: General Linear Models; HRQL: health-related
quality of life; WHR: waist-to-hip ratio.
Acknowledgements
This research received no specific grant from any funding agency in the
public, commercial, or not-for-profit sectors. This research uses data from the
KORA Survey 2004-2005 (F3), a project conducted by the research platform
KORA (Cooperative Health Research in the Region of Augsburg). KORA was
initiated and financed by the Helmholtz Center Munich - German Research
Center for Environmental Health (formerly: GSF - National Research Center
for Environment and Health), Neuherberg, Germany, which is financed by
the German Federal Ministry of Education and Research and the State of
Bavaria.
Author details
1
Hannover Medical School, Medical Psychology Unit (OE 5430), Carl-
Neuberg-Str. 1, 30625 Hannover, Germany.
2
Helmholtz Center Munich -
German Research Center for Environmental Health, Institute of Health
Economics and Health Care Management, Ingolstädter Landstr. 1, 85764
Neuherberg, Germany.
3
Helmholtz Center Munich - German Research Center
for Environmental Health, Institute of Epidemiology II, Ingolstädter Landstr. 1,
85764 Neuherberg, Germany.
Authors’ contributions
DAH participated in the statistical analyses and the writing of the article. RH
participated in the preparation and conduct of the study and the editing of
the article. MEL participated in the conduct of the study and the editing of
the article. KHL participated in the preparation and conduct of the study
and the editing of the article. TvL participated in the preparation and
conduct of the study, the statistical analyses and the writing of the article.
All authors read and approved the final manuscript.
Competing interests
The authors declare that they have no competing interests.
Received: 13 May 2011 Accepted: 4 November 2011
Published: 4 November 2011
Heidelberg et al. Health and Quality of Life Outcomes 2011, 9:97
/>Page 9 of 10
References
1. National Institutes of Health: State-of-the-Science Conference Statement:
Management of Menopause-Related Symptoms. Ann Intern Med 2005,
142:1003-1013.
2. Utian WH: Psychosocial and socioeconomic burden of vasomotor
symptoms in menopause: a comprehensive review. Health Qual Life
Outcomes 2005, 3:47.
3. Avis NE, Colvin A, Bromberger JT, Hess R, Matthews KA, Ory M, Schocken M:
Change in health-related quality of life over the menopausal transition
in a multiethnic cohort of middle-aged women: study of women’s
health across the nation. Menopause 2009, 16:860-869.
4. Williams RE, Levine KB, Kalilani L, Lewis J, Clark RV: Menopause-specific
questionnaire assessment in US population-based study shows negative
impact on health-related quality of life. Maturitas 2009, 62:153-159.
5. Timur S, Sahin NH: Effects of sleep disturbance on the quality of life of
Turkish menopausal women: a population-based study. Maturitas 2009,
64:177-181.
6. Van Dole KB, Williams RE, Brown RS, Gaynes B, Devellis R, Funk MJ:
Longitudinal association of vasomotor symptoms and psychosocial
outcomes among postmenopausal women in the United States: a
population-based study. Menopause 2010, 17:917-923.
7. Sanfélix-Genovés J, Hurtado I, Sanfélix-Gimeno G, Reig-Molla B, Peiró S:
Impact of osteoporosis and vertebral fractures on quality of life: a
population-based study in Valencia, Spain (The FRAVO Study). Health
Qual Life Outcomes 2011, 9:20.
8. Schwarz S, Völzke H, Alte D, Schwahn C, Grabe HJ, Hoffmann W, John U,
Dören M: Menopause and determinants of quality of life in women at
midlife and beyond: the study of health in Pomerania (SHIP). Menopause
2007, 14:123-134.
9. Jones GL, Sutton A: Quality of life in obese postmenopausal women.
Menopause Int 2008, 14:26-32.
10. von Lengerke T, Stehr M: [Are obese adults limited in their mental
health-related quality of life? A systematic review of recent studies].
German (incl. English abstract) Adipositas 2011, 5:30-36.
11. Stunkard AJ, Faith MS, Allison KC: Depression and obesity. Biol Psychiatry
2003, 54:330-337.
12. Myers A, Rosen JC: Obesity stigmatization and coping: relation to mental
health symptoms, body image, and self esteem. Int J Obes Relat Metab
Disord 1999, 23:221-230.
13. Banegas JR, López-García E, Graciani A, Guallar-Castillón P, Gutierrez-Fisac JL,
Alonso J, Rodríguez-Artalejo F: Relationship between obesity,
hypertension and diabetes, and health-related quality of life among the
elderly. Eur J Cardiovasc Prev Rehabil 2007, 14:456-462.
14. Ladwig K-H, Marten-Mittag B, Löwel H, Döring A, Wichmann H-E:
Synergistic effects of depressed mood and obesity on long-term
cardiovascular risks in 1510 obese men and women: results from the
MONICA-KORA Augsburg Cohort Study 1984-1998. Int J Obes 2006,
30:1408-1414.
15. Everson-Rose SA, Lewis TT, Karavolos K, Dugan SA, Wesley D, Powell LH:
Depressive symptoms and increased visceral fat in middle-aged women.
Psychosom Med 2009, 71:410-416.
16. Holle R, Happich M, Löwel H, Wichmann HE, MONICA/KORA Study Group:
KORA - A Research Platform for Population Based Health Research.
Gesundheitswesen 2005, 67:19-25.
17. Hoffmann W, Terschüren C, Holle R, Kamtsiuris P, Bergmann M, Kroke A,
Sauer S, Stang A, Latza U: The problem of response in epidemiologic
studies in Germany (part II) (in German). Gesundheitswesen 2004,
66:482-491.
18. Bullinger M, Kirchberger I: SF-36 Fragebogen zum Gesundheitszustand
German. Göttingen: Hogrefe; 1998.
19. Qiao Q, Nyamdorj R: The optimal cutoff values and their performance of
waist circumference and waist-to-hip ratio for diagnosing type II
diabetes. Eur J Clin Nutr 2010, 64:23-29.
20. Vazquez G, Duval S, Jacobs DR, Silventoinen K: Comparison of body mass
index, waist circumference, and waist/hip ratio in predicting incident
diabetes: a meta-analysis. Epidemiol Rev 2007, 29:115-128.
21. Rivenes AC, Harvey SB, Mykletun A: The relationship between abdominal
fat, obesity, and common mental disorders: results from the HUNT
study. J Psychosom Res 2009, 66:269-275.
22. Singh D, Randall PK: Beauty is in the eye of the plastic surgeon: waist-hip
ratio (WHR) and women’s attractiveness. Pers Individ Dif 2007, 43:329-340.
23. Ladwig KH, Marten-Mittag B, Baumert J, Löwel H, Döring A, KORA
investigators: Case-finding for depressive and exhausted mood in the
general population: reliability and validity of a symptom-driven
diagnostic scale. Results from the prospective MONICA/KORA Augsburg
study. Ann Epidemiol 2004, 14:332-338.
24. Von Zerssen D, Koeller D-M: Die Beschwerden-Liste: Parallelformen B-L u. B-L’,
Ergänzungsbogen B-L* German. Weinheim: Beltz; 1976.
25. Nocon M, Keil T, Willich SN: Education, income, occupational status and
health risk behaviour. J Public Health 2007, 15:401-405.
26. McClelland GH, Judd CM: Statistical difficulties of detecting interactions
and moderator effects. Psychol Bull 1993, 114:376-390.
27. Page MC, Braver SL, MacKinnon DP: Levine’s guide to SPSS for analysis of
variance. 2 edition. New York: Lawrence Erlbaum; 2003.
28. Atlantis E, Baker M: Obesity effects on depression: systematic review of
epidemiological studies. Int J Obes 2008, 32:881-891.
29. Genazzani AR, Gambacciani M: Effect of climacteric transition and
hormone replacement therapy on body weight and body fat
distribution. Gynecol Endocrinol 2006, 22:145-150.
30. Mynt PK, Welch AA, Luben RN, Wainwright NWJ, Surtees PG, Bingham SA,
Wareham NJ, Smith RD, Harvey IM, Khaw KT:
Obesity indices and self-
reported functional health in men and women in the EPIC-Norfolk.
Obesity 2006, 14:884-893.
31. Appels A, Mulder P: Excess fatigue as a precursor of myocardial
infarction. Eur Heart J 1988, 9:758-764.
32. Wee CC, Davis RB, Hamel MB: Comparing the SF-12 and SF-36 health
status questionnaires in patients with and without obesity. Health Qual
Life Outcomes 2008, 6:11.
33. Hilditch JR, Lewis J, Peter A, van Maris B, Ross A, Franssen E, Guyatt GH,
Norton PG, Dunn E: A menopause-specific quality of life questionnaire:
development and psychometric properties. Maturitas 2008, 61:107-121.
34. Heinemann K, Ruebig A, Potthoff P, Schneider HP, Strelow F,
Heinemann LA, Do MT: The Menopause Rating Scale (MRS) scale: a
methodological review. Health Qual Life Outcomes 2004, 2:45.
35. Kolotkin RL, Norquist JM, Crosby RD, Suryawanshi S, Teixeira PJ,
Heymsfield SB, Erondu N, Nguyen AM: One year health-related quality of
life outcomes in weight loss trial participants: comparison of three
measures. Health Qual Life Outcomes 2009, 7:53.
36. Wood NF: Menopause, symptoms, and quality of life: time for a
theoretical framework. Menopause 2010, 17:892-893.
37. Teixeira PJ, Going SB, Sardinha LB, Lohman TG: A review of psychosocial
pre-treatment predictors of weight control. Obes Rev 2005, 6:43-65.
doi:10.1186/1477-7525-9-97
Cite this article as: Heidelberg et al.: Do diabetes and depressed mood
affect associations between obesity and quality of life in
postmenopause? Results of the KORA-F3 Augsburg population study.
Health and Quality of Life Outcomes 2011 9:97.
Submit your next manuscript to BioMed Central
and take full advantage of:
• Convenient online submission
• Thorough peer review
• No space constraints or color figure charges
• Immediate publication on acceptance
• Inclusion in PubMed, CAS, Scopus and Google Scholar
• Research which is freely available for redistribution
Submit your manuscript at
www.biomedcentral.com/submit
Heidelberg et al. Health and Quality of Life Outcomes 2011, 9:97
/>Page 10 of 10