báo cáo hóa học:" The relationship of oral health literacy with oral health-related quality of life in a multi-racial sample of low-income female caregivers" doc
Bạn đang xem bản rút gọn của tài liệu. Xem và tải ngay bản đầy đủ của tài liệu tại đây (258.54 KB, 9 trang )
RESEARCH Open Access
The relationship of oral health literacy with oral
health-related quality of life in a multi-racial
sample of low-income female caregivers
Kimon Divaris
1,2*
, Jessica Y Lee
1,3
, A Diane Baker
1
and William F Vann Jr
1
Abstract
Background: To investigate the association between oral health literacy (OHL) and oral health-related quality of
life (OHRQoL) and explore the racial differences therein among a low-income community-based group of female
WIC participants.
Methods: Participants (N = 1,405) enrolled in the Carolina Oral Health Literacy (COHL) study completed the short
form of the Oral Health Impact Profile Index (OHIP-14, a measure of OHRQoL) and REALD-30 (a word recognition
literacy test). Socio-demographic and self-reported dental attendance data were collected via structured interviews.
Severity (cumulative OHIP-14 score) and extent of impact (number of items reported fairly/very often) scores were
calculated as measures of OHRQoL. OHL was assessed by the cumulative REALD-30 score. The association of OHL
with OHRQoL was examine d using descriptive and visual methods, and was quantified using Spearman’s rho and
zero-inflated negative binomial modeling.
Results: The study group included a substantial number of African Americans (AA = 41%) and American Indians
(AI = 20%). The sample majority had a high school education or less and a mean age of 26.6 years. One-third of
the participants reported at least one oral health impact. The OHIP-14 mean severity and extent scores were 10.6
[95% confidence limits (CL) = 10.0, 11.2] and 1.35 (95% CL = 1.21, 1.50), respectively. OHL scores were distributed
normally with mean (standard deviation, SD) REALD-30 of 15.8 (5.3). OHL was weakly associated with OHRQoL:
prevalence rho = -0.14 (95% CL = -0.20, -0.08); extent rho = -0.14 (95% CL = -0.19, -0.09); severity rho = -0.10 (95%
CL = -0.16, -0.05). “Low” OHL (defined as < 13 REALD-30 score) was associated with worse OHRQoL, with increases
in the prevalence of OHIP-14 impacts ranging from 11% for severity to 34% for extent. The inverse association of
OHL with OHIP-14 impacts persisted in multivariate analysis: Problem Rate Ratio (PRR) = 0.91 (95% CL = 0.86, 0.98)
for one SD change in OHL. Stratification by race revealed effect-measure modification: Whites–PRR = 1.01 (95% CL
= 0.91 , 1.11); AA–PRR = 0.86 (95% CL = 0.77, 0.96).
Conclusions: Although the inverse association between OHL and OHRQoL across the entire sample was weak,
subjects in the “low” OHL group reported significantly more OHRQoL impacts versus those with higher literacy. Our
findings indicate that the association betw een OHL and OHRQoL may be modified by race.
Keywords: oral health literacy, oral health-related quality of life, OHIP-14, racial differences, effect measure
modification
* Correspondence: u
1
Department of Pediatric Dentistry. 228 Brauer Hall, CB#7450, UNC School of
Dentistry. University of North Carolina at Chapel Hill. Chapel Hill. North
Carolina, 27599, USA
Full list of author information is available at the end of the article
Divaris et al. Health and Quality of Life Outcomes 2011, 9:108
/>© 2011 Divaris et al; licensee BioMed Central Ltd. This is an Open Access article distri buted under the terms of the Creative Commons
Attribution License ( which permits unrestricted use, distribution, and reproduction in
any medium, pro vided the original work is properly cited.
Background
The importance of subjective measures of oral health is
well-recognized in dental research [1-3]. Theoretical
models have provided the framework that links clinical
conditions with patient perceptions and impacts on
their oral health-related quality of life (OHRQoL) [4,5].
Evidence shows that individua ls’ perceptions of their
dental condition is closely related to OHRQoL, [6] and
may confer greater impacts than the actual clinical con-
ditions [1]. The United States (US) Surgeon General’s
report on Oral Health in America underscores and
emphasizes the importance of OHRQoL, and its
improvement on a population-level is defined as a goal
[7]. For these reasons, subjective oral health (SOH)
instruments have been used to capture the multi-dimen-
sional concept of OHRQoL [8,9] and are used to quan-
tify patient outcome experiences, monitor oral health
status on national level, and identify dental public health
goals [10,11].
During this past decade the critical role of health lit-
eracy in medicine and public health has gained consid-
erable attention [12,13]. The multi-level consequences
of low health literacy have been reviewed extensively
and include negative health behaviors, reduced utiliza-
tion of prevent ive health services, and poorer adherence
to therapeutic protocols [14,15]. Data from the most
recent National Adult Literacy Survey (2003) indicate
that an alarming proportion of US adults are function-
ally illiterate [16], and there exists evidence connecting
low literacy with poorer health-related quality of life
[17]. Health literacy is now considered an underlying
cause of health disparities and has become a national
health priority [18,19].
Although much is known about health literacy in the
medical context, little is known about oral healt h lit-
eracy (OHL) and its relationship to clinical conditions,
patients’ subjective assessments, and OHL’sperceived
impacts on daily life in the community. A working
group of the National Institutes of Dental and Craniofa-
cial Research (NIDCR) defined OHL as “thedegreeto
which individuals have the capacity to obtain, process,
and understand basic oral health information and ser-
vices needed to make appropriate health decisions” [20].
Horowitz and Kleinman recently proposed that “oral
health literacy is the new imperative for better oral
health” as health literacy is now considered a determi-
nant of health [21].
An accumulating body of evidence links low OHL
with worse oral health outcomes such as oral health sta-
tus [22,23], dental neglect [24] as well as sporadic dental
attendance [25]. In a investigation among a group of
Indi genous Australians, Parker and Jamieson [26] found
that although low OHL was not associated with self-
reported oral health status, it was associated with
increased prevalence of OHIP-14 impacts (proportion of
items reported fairly/very often). Noteworthy, in a recent
study among child-caregiver dyads in the US, caregivers’
OHL modified the association between children’soral
health status and child OHRQoL impacts, with low-lit-
eracy caregivers reporting less impacts [27].
Previous pilot studies have explored the patterns of
association between OHL and measures of OHRQoL
using the Test of Functional Health Literacy in Dentistry
(TOFHLiD) [28] and the Rapid Estimate of Adult Lit-
eracy in Dentistry (REALD-99) [29]. Interestingly, as in
the Parker and Jamieson study, Richman and colleagues
reported that whi le OHL was not associated with dental
health status, higher OHL scores were significantly asso-
ciated with less perceived OHIP-14 impacts, indicating
better OHRQoL [29].
In the validation study of the short form of the
REA LD (REALD-30) among patients in a medical clini c
setting, Lee et al [24] reported an inverse association of
REALD-30 with OHIP-14 scores; however, the authors
noted that because the data were collected on a conve-
nience sample of health care-seeking subjects, future
work is warranted on a larger, more diverse sample, as
rec ommended by t he NIDCR proposed research agenda
[20]. To this end, the aims of the present study were to
investigate the association b etween OHL and OHRQoL
using REALD-30 in a large and more diverse and non-
care seeking sample of subjects, and to explore any dif-
ferences in this association between racial groups.
Methods
Study population and recruitment
This investigation relied upon interview data from the
Carolina Oral Health Literacy (COHL) Project [30], a
study exploring OHL in a low-income population of
caregivers in the Women, Infants, and Children’ sSup-
plemental Nutrition Program (WIC) in North Carolina
(NC). Non- random WIC sites in 7 counties in NC were
selected using certain criteria including geographic
region, rural/urban makeup, population demographics,
active WIC clinics and established working relationships.
Study staff members were deployed in the selected
WIC clinics and approached consecutive individuals to
ask if the y would answer eight questions from the study
eligibility screening instrument. Eligibility criteria
included being: a) the primary caregiver of a healthy
(ASA I or II) and Medicaid-eligible infant/child 60
months old or y ounger, or expecting a newborn within
the next 8 months, b) 18 years or older and c) English-
speaking. Caregivers that met these criteria and agreed
to participate were accompanied to a private area for a
30-minute in-person interview with one of the two
trained study interviewers. Purposeful quota sampling
[31] was employed to ensure that minority groups
Divaris et al. Health and Quality of Life Outcomes 2011, 9:108
/>Page 2 of 9
would be well-represented in the study sample. In this
approach, individuals in pre-determined minority groups
(African Americans and American Ind ians in the COHL
study) are targeted preferentially and recruited into the
study until adequate representation in the final sample
is achieved. From 1,658 subjects that were screened and
determined eligible 1,405 (85%) participated and pro-
vided data in the domains of socio-demographic infor-
mation, dental health and behaviors, OHRQoL, self-
efficacy, and OHL. For the current analysis we excluded
men (n = 49 or 3.5% of total), Asians (n = 12, or 0.9%),
those who did not have English as their primary lan-
guage at home (n = 79 or 5.6%), and those who had not
yet reached age 18 (n = 2 or 0.1%). Theref ore , our ana-
lytic sample included White, African American (AA) or
American Indian (AI) female caregivers, whose primary
language was English (N = 1,278).
Variable Measurements
Additional demographic characteristics included age and
education. Age was mea sured in ye ars and coded as a
quintile-categorical indicator variable. Education was
coded as a four-level categorical variable where 1: did
not finish high school, 2: high school or General Educa-
tion Diploma (GED), 3: some technical education or
some college, 4: college or higher education. Dental
attendance was self-reported as the time since the last
dental visit and coded as a four-level categorical variable
where 1: < 1 year, 2: 12-23 months, 3: 2-5 ye ars, 4: > 5
years or never.
OHRQoL impacts were assessed with the use of the
short form of the Oral Health Impact Profile (OHIP-14)
index [32]. Consistent with previo us investigations [11],
three OHIP-14 estimates were derived from subjects’
responses: Severity (cumulative OHIP-14 score), preva-
lence (proportion of subjects reporting fairly/very often
oneormoreitems)andextent (number of items
reported fairly/very often) of impacts were calculated as
measures of OHRQoL. In terms of interpretation, the
authors acknowledge Locker’s critique that the OHIP
may not fu lly satisfy the criteria for ‘quality of life’ mea-
sures [33], to be consistent with previous publications,
however, have adopted the widely used term of OHR-
QoL in this manuscript.
OHL was measured with the previously validated word
recognition test (REALD-30) [23]. The REALD-30
includes 30 words of dental context (e.g. fluoride, pla-
que, cari es, halitosis, temporomandibular, etc.) arranged
in order of increasing difficulty. The criteria used to
determine word difficulty were based on word length,
number of syllables, and difficult sound combinations,
as well a s results from 10 pre-test interviews that had
been conducted prior to the REALD-30 validati on study
[23]. The study participant is asked to read each word
out loud with one point given for each word that is pro-
nounced correctly, resulting in a 0-30 cumulative score
where 0: lowest and 30: highest literacy. Although the
REALD-30 is a word recognition test and may be cap-
turing only some aspe cts of liter acy skills, it has been
shown to be highly correlated with functional health lit-
eracy [28] and to possess good psychometric properties
[23]. Norms or thresholds for what constitutes “low
OHL” have not been established, however in previous
investigations [27,34] a threshold of < 13 on the 30-
point REALD-30 scale was used to define a “low OHL”
group.
Analytical Strategy
We used bivariate tabular methods to display the distri-
bution of the three OHRQoL estimates (severity, preva-
lence and extent) by strata of socio-demographic
variables. We calculated Spearman’s correlation coeffi-
cients (rho) and 95% confidence limits (CL; obtained
with bootstrapping, N = 1,000 repetitions) to quantify
the associations between OHL scores and prevalence,
severity, and extent.
Although the inverse association between OHL and
OHRQoL has been shown in previous investigations
[23,26], no i nformation has been reported regardi ng the
shape and gradient characteristics of this relationship.
For this reason, we used polynomial smoothing func-
tions (LPSF) and corresponding 95% CL to illustrate the
relationship between the OHL scores and OHIP-14 esti-
mates. LPSF are non-parametric and data-adaptive func-
tions [35,36] that are flexible in displaying an
association without prior assumptions about its shape,
gradient, or monoto nicity, while minimizing biases from
misspecification that could be introduced by traditional
modeling applications. Further, to examine the associa-
tion between “low” OHL and OHRQoL we used the <
13 REALD-30 score threshold, representing the lowest
quartile of the distribution, to define the “low OHL”
stratum. We obtained crude and adjusted differences
and ratios of OHIP-14 impacts using Poisson models.
Because severity is the OHIP-14 estimate that arguably
carries the most information (no items or scoring
schemes are arbitrarily collapsed) and the entire range
of the instrument scale (0-56) [11], we chose this mea-
sure for subsequent analytical iterations. To further
quantify the association between OHL and severity,we
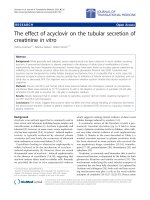
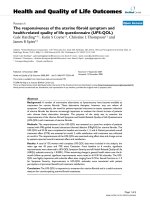
used Zero-Inflated Negative Binomial modeling (ZINB).
This analytical approach was used because of the distri-
bution characteristics of severity, which followed a nega-
tive binomial type distribution with “excess zeros”
(Figure 1).
The ZINB explicitly specifies two models that are fit
simultaneously, one that models the “probability of
zero” and one that models the count outcome, using a
Divaris et al. Health and Quality of Life Outcomes 2011, 9:108
/>Page 3 of 9
negative binomial distribution. These models have
gained popularity in analyses of count outcomes with
high proportion of zeros, but their selection and applic-
ability can be data-specific [37,38]. For this reason and
to determine the best fit, we consider ed oth er analytical
approaches including the negative binomial (NB) and
the zero inflated Poisson (ZIP) model. The appropriate-
ness of ZINB versus the NB or the ZIP model was tested
and confirmed with diagnostic model-fit statistics, using
a Vuong test (ZINB favored over NB, P < 0.05) and a
likelihood ratio test (ZINB favored over ZIP, P < 0 .05)
[39].
The exponentiated coefficient of the negative binomial
component of the mo del corresponds to a Prevalence
Rate Ratio, which in this analysis we interpret as ratio of
reported impacts (problems), or “Problem Rate Ratio”
(PRR) as in a previous study [40]. To facilitate interpre-
tation, w e report model coefficients that correspond to
one standard deviation change in OHL, which in our
study was 5.3 units on the 30 unit REALD-30 scale. In
other words, the PRR correspond to the change in
reported cumulative OHIP-14 impacts that is associated
with one standard deviation change in REALD-30
(expressed as ratio). Inclusion of confounders in the
Poisson and the ZINB models was determined by likeli-
hood ratio tests, comparing nested (reduced) models
with the referent (full) m odel using a criterion of P <
0.1. Interpretation of the model coefficients was based
on effect estimation rather than hypothesis testing [41].
We employed three (race-specific) multivariate models
to explore the possible heterogeneity of the association
between OHL and OHRQoL between racial groups.
Consistent with our aims, we considered race as an a
priori modifier of the examined association and there-
fore, these three models were identical to the “main
effects” model but were restricted to strata o f Whites,
AAs and AIs. To dete rmine whether race modified t he
association between literacy and quality of life, we com-
pared these model-obtained race-specific estimates of
the association between OHL and severity. The rationale
for conducting comparisons of stratum-specific esti-
mates as opposed to testing the hypothesis in the con-
text of statistical interaction is based on the fact that the
former approach does not assume covariate effect-
homogeneity across racial groups. This could be a
source of non-negligible bias when quantifying a weak
main effect (e.g. OHL) in the presence of strong con-
founders (e.g. education), unless all potential interaction
terms are included. To that end, we first conducted a
globa l Wald X
2
test of homogene ity or “a common PRR
across racial groups” using a conservative criterion of P
< 0.2. We further examined post hoc differences in
0 5 10 15 20 25
% of subjects
0.0 10.0 20.0 30.0 40.0 50.0
OHIP−14 severity (cumulative score)
Figure 1 Distribution of OHIP-14 severity (cumulative score) among the female caregivers participating in the COHL study (N = 1,278).
Divaris et al. Health and Quality of Life Outcomes 2011, 9:108
/>Page 4 of 9
estimates between racial groups by calculating three
pairwise homogeneity Z-sco res (Z
homog
)usingthefor-
mula: Z
homog
=|b
x
-b
y
|/(se
x
2
+se
y
2
)
1/2
,whereb
x/y/z
and
se
x/y/z
are the ZINB model-obtained race-specific coeffi-
cients and standard errors respectively [42]. Two-tailed
P-values corresponding to the Z-scores w ere obtained
using the normal distribution function of the Stata 12.0
(StataCorp LP, College Station, TX) statistical program.
A P < 0.05 criterion was used for the pairwise tests.
Results
The demographic characteristics of our final analytic
sample (N = 1,280) with corresponding OHIP-14 preva-
lence, extent,andseverity scores are presented in Table
1. Participants’ mean age in years was 26.6 (median =
25). Sixty percent had a high school education or less.
Seventy-five percent reported a dental visit within the
last two years.
The OHL score was distributed normally [30] with a
mean (SD) REALD-30 of 15.8 (5.3), with 25% of partici-
pants (N = 316) scoring less than 13, classified as “low
OHL”. Pronounced OHL gradients were noted relative
to education as follows: less than high school–13.0 (4.8),
high school or GED–15.0 (4.9), some technical or col-
lege–18.0 (4.7) and college degree or higher –20.1 (4.8).
Differences by race were also evident: whites–17.4 (4.9),
AA–15.3 (5.1), AI–13.7 (5.3). The mean OHIP-14 sever-
ity and extent scores were 10.6 (95% CI = 10.0, 11.2)
and 1.35 (95% CI = 1.21, 1.50), respectively. Thirty-
seven percent reported at least one oral health impact
fairly or ver y often (prevalence), while AIs had the high-
est severity score. A strong gradient was found with
decreasing age and OHIP-14 scores. Some age and racial
differences were noted, with older subjects and AIs
reporting more impacts.
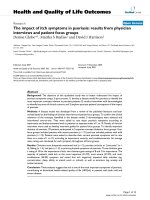
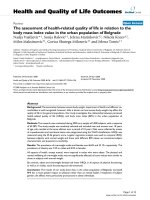
OHL showed weak correlations with all three OHIP-
14 estimates: prevalence rho= -0.14 (95% CI = -0.20,
-0.08), extent rho = -0.14 (95% CI = -0.19, -0.09), and
severity rho = -0.10 (95% CI = -0.16, -0.05). These
bivariate associations are illustrated in Figures 2a, b, and
2c with local polynomial smoothing functions and 95%
confidence intervals. In these illustrations the inverse,
non-linear association between OHL and the OHRQoL
estimates was evident. Although the negative gradient
was more apparent for prevalence, the inverse relation-
ship of all three OHRQoL measures with OHL was
more “prof ound” at the lower end of the OHL range.
This was confirmed by the contrast of the “low” versus
the “ high OHL” group (Table 2), where the former
group had consistently worse OHRQoL estimates. “Low
Table 1 Distribution of oral health-related quality of life (OHRQoL) measures [OHIP-14 estimates and corresponding
95% confidence limits (CL)] by demographic characteristics among the Carolina Oral Health Literacy study participants
(N = 1,278)
Subjective oral health impacts estimates (OHIP14)
N (%) Prevalence
(95% CL)
Severity
(95% CL)
Extent
(95% CL)
Race
White 503 39 36.6 (32.4, 40.8) 10.6 (9.6, 11.6) 1.39 (1.15, 1.62)
African American 522 41 34.7 (30.6, 38.8) 10.4 (9.4, 11.3) 1.24 (1.04, 1.45)
American Indian 253 20 39.1 (33.1, 45.2) 11.2 (9.8, 12.6) 1.53 (1.19, 1.87)
Education
Less than high school 305 24 49.5 (43.9, 55.2) 13.6 (12.1, 15.0) 2.10 (1.74, 2.45)
High school diploma/GED 479 37 35.1 (30.8, 39.4) 10.3 (9.3, 11.3) 1.23 (1.01, 1.45)
Some technical or college 429 34 31.5 (27.1, 35.9) 9.4 (8.5, 10.4) 1.10 (0.88, 1.31)
College or higher 65 5 15.4 (6.4, 24.4) 7.1 (4.9, 9.2) 0.45 (0.15, 0.74)
Dental attendance
< 12 months 726 57 34.7 (31.2, 38.2) 10.4 (9.6, 11.2) 1.30 (1.12, 1.48)
12-23 months 217 17 31.3 (25.1, 37.6) 9.5 (8.0, 11.0) 1.24 (0.91, 1.57)
2-5 years 177 14 45.8 (38.4, 53.2) 11.2 (9.5, 12.9) 1.52 (1.16, 1.88)
> 5 years 151 12 39.9 (32.2, 47.6) 12.6 (10.7, 14.4) 1.58 (1.11, 2.04)
Age (years; quintiles) Mean(SD)
Entire sample 1,278 26.6(6.9)
Q1 range: 18.0, 20.9 256 19.6(0.8) 28.9 (23.3-34.5) 8.3 (7.1-9.6) 1.04 (0.77, 1.32)
Q2 range: 20.9, 23.4 256 22.1(0.7) 40.6 (34.6-46.7) 11.2 (9.8-12.5) 1.47 (1.16, 1.79)
Q3 range: 23.4, 26.5 255 24.8(0.9) 34.5 (28.6-40.4) 10.4 (9.1-11.7) 1.22 (0.92, 1.53)
Q4 range: 26.5, 30.9 256 28.6(1.3) 37.1 (31.2-43.1) 10.8 (9.5-12.1) 1.35 (1.04, 1.66)
Q5 range: 30.9, 65.6 255 37.7(6.1) 40.4 (34.3-46.5) 12.5 (10.8-14.1) 1.69 (1.32, 2.06)
Divaris et al. Health and Quality of Life Outcomes 2011, 9:108
/>Page 5 of 9
0 10 20 30 40
OHIP−14 severity score
0 10 20 30
OHL (REALD−30 score)
95% CI polynomial smoothing function
20 40 60 80 100
% of subjects reporting impacts
0 10 20 30
OHL (REALD−30 score)
95% CI polynomial smoothing function
0 2 4 6 8 10
OHIP−14 extent score
0 10 20 30
OHL (REALD−30 score)
95% CI polynomial smoothing function
Figure 2 Relationship between OHL and oral health related quality of life estimates [OHIP-14 severity (a), prevalence (b) and extent
(c)] illustrated by polynomial smoothing functions and corresponding 95% confidence limits, among the female caregivers
participating in the COHL study (N = 1,278).
Divaris et al. Health and Quality of Life Outcomes 2011, 9:108
/>Page 6 of 9
OHL” was associated with significant absolute and r ela-
tive increases in all OHRQoL dimensions, with relative
prevalence estimates ran ging from +11 % for severity to
+34% for extent.
Multivariate analysis adjusting for age, race, and edu-
cation revealed that the weak inverse association
between OHL and severity across the en tire sample per-
sisted: PRR = 0.91 (95% CL = 0 .86, 0.98). Table 2 pre-
sents estimates obtained from the stratified (race-
specific) multivariate models, where: Whites–PRR =
1.01 (95% CL = 0.91, 1.11), AA–PRR = 0.86 (95% CL =
0.77, 0.96) and AI–PRR = 0.92 (9 5% CL = 0.80, 1.05).
By comparing these estimates ensemble we rejected the
assumption of homogeneity (Wald X
2
= 4.6; degrees of
freedom = 2; P < 0.2). Subsequen t pairwise comparisons
of the race-specific estimates confirmed that the mea-
sures of a ssociation among AAs a nd Whites depart ed
from homogeneity (Z
homog
= 2.06; P < 0.05). In fact, no
association between OHL and OHIP-14 severity was
found among Whites whereas weak associations were
found among AAs and AIs.
Discussion
This investigation provides the first report of the asso-
ciation between OHL and OHRQoL (as measured by
OHIP-14) in a multi-racial community-based sample.
This study was restricted to a non-pro bability sample of
low-income female caregive rs participating in the WIC
program in NC; however, we believe that this homoge-
neity is advantageous because strong income-gradients
have been identified in oral health impacts on the popu-
lation level [43,44]. Moreover, recruitment of subjects
from a non-dental clinical environment reduces the
potential for se lection bias and, within the limita tions of
the sampling procedures and target population,
increases the generalizability of our findings. It is note-
worthy but not surprising that the OHL levels in this
study were considerably lower than those reported for
dental patients seeking ca re in private practice [REALD-
30 (SD): 23.9 (1.3)] [22] or a dental school setting [20.7
(5.5)] [45], and comparable to those found among a
community-based sample of indigenous Australians
[15.0 (7.8)] [26].
It has been acknowledged that minority individuals
and those towards the lowest end of the literacy distri-
bution may be underrepresented in o ral health research
[46] and this can be even more exacerbated in literacy
investigations. Inter estingly, the m ost profound negative
gradients between OHL and OHRQoL measures were
observed at the lower end of the OHL s pectrum, with
subjects scoring < 13 on the 30-point REALD-30 scale
reporting significantly more OHRQoL impacts versus
those with higher literacy. This finding is consistent
with conceptual frameworks that consider skills such as
conceptual knowledge and OHL as pre-requisites of
appropriate decision-making [47]. It is likely that OHL
exerts strong influences on ora l health-related outcomes
when below a certain threshold, but it may be a le ss
impactful determinant at higher levels.
The high representationofAAsandAIsthatwere
enrolled in COHL offered us an opportunity to examine
for any underlying heterogeneity in the association of
OHL with SOH between racial groups. We found a weak
negative association between OHL and OHIP-14 severity
for AAs and AIs, but not Whites. While AAs have been
shown to report worse OHIP scores in the US [10] and
patterns of OHRQoL changes have been shown to differ
by race [48,49], this finding warrants further investiga-
tion; race may be a proxy of unmeasured mediating fac-
tors between OHL, oral health status, and perceived
impacts [50]. The fact that the dimensionality of OHR-
QoL [8] may differ between diverse populations or ethnic
groups may amplify this phenomenon; therefore, we
acknowledge the limitation of our analytical sample that
was restricted to low-income WIC-participating female
caregivers. Replication of our main as well as race-speci-
fic findings should be undertaken on a population-based
representative sample.
Lawrence et al [51] recently demonstrated that OHIP-
14 scores show good correlation with clinical oral health
Table 2 Oral health-related quality of life (OHRQoL) differences [mean difference and prevalence ratios (PR) with
corresponding 95% confidence limits (CL)] between participants with “ low ” (< 13 REALD-30; referent category) and
“high” (≥ 13 REALD-30) oral health literacy in the Carolina Oral Health Literacy study (N = 1,278)
“Low” literacy
(< 13 REALD-30)
“High” literacy
(≥ 13 REALD-30)
Difference
1
[mean (95% CL)] Prevalence Ratio
1
[(PR (95% CL)]
N = 316 (25%) N = 962 (75%) Crude Adjusted
2
Adjusted
2
OHRQoL
(OHIP-14 estimates)
Prevalence 45.3 (39.7, 50.8) 33.4 (30.4, 36.4) 11.9 (0.04, 0.20) 7.4 (-1.4, 16.2) 1.17 (1.00, 1.37)
Severity 12.4 (11.0, 13.8) 10.1 (9.4, 10.7) 2.3 (1.9, 2.8) 1.2 (0.7, 1.6) 1.11 (1.07, 1.16)
Extent 1.87 (1.52, 2.22) 1.19 (1.04, 1.33) 0.68 (0.52, 0.85) 0.36 (0.19, 0.54) 1.34 (1.20, 1.50)
1: Mean differences and ratios of OHIP-14 impacts were calculated using the “high literacy” category as referent.
2: Adjusted differences and ratios were obtained using a Poisson model controlling for race, age, education level and dental attendance.
Divaris et al. Health and Quality of Life Outcomes 2011, 9:108
/>Page 7 of 9
status, independent of gender and socioeconomic
inequalities in oral health. Among our community-based
caregivers, the prevalence of oral health i mpacts (36.5%)
was higher compared to nationally representative sam-
ples from other studies including the US (15.3%) [10],
Australia(dentatesubjects-18.2%), United Kingdom
(dentate subjects-1 5.9%) [11] and New Zealand (23.4%)
[51]. However, the extent and severity estimates reported
here are lower compared to these samples. One possible
interpretation of this finding is that our study group was
limited to young, low-income, poorly educated, WIC
participants with relatively low education. The young
mean age (26.6 years) may explain the low severity and
extent estimates while the low-income and low-educa-
tion level status may explain the high prevalence of at
least one impact reported as fairly/very often.
Considering the high prevalence of impacts revealed in
the study population, the significance of lower OHL is
demonstrative. Using our “main effects” model coeffi-
cients, we estimate that a one standard deviation
increase in OHL (5.3 REALD-30 units) corresponds to a
9% decrease in OHIP-14 severity [PRR (95% CL) = 0.91
(0.86, 0.98)], whereas (using race-specific estimates from
Table 3) this decrease is more pronounced (14%) among
AA [PRR (95% CL) = 0.86 (0.77, 0.96)]. On the other
hand, this finding provides afoundationtoconsider
interventions t o enhance OHL, or rather improve the
readability of written materials and accessibility to den-
tal services to an appropriate literacy level [30]. It
remains uncertain whether improvement in OHL is fea-
sible and if so, whether this would lead to better oral
health status and subjective oral health. Although educa-
tion and income arguably remain the strongest corre-
lates of oral health and disease, and literacy is one of
numerous other distal determinants, OHL may be part
of causal mechanisms that lead to worse oral health
[21]. Accumulating evidence linking poor OHL with
adverse oral health outcomes among caregivers [24] and
their young children [27,34] supports the introduction
and implementation of rapid OHL screening tools [52]
in clinical practice, dental research and public health
surveillance. Moreover, we suggest that more studies
exploring the association between OHL and OHRQoL
be undertaken in multi-racial community based samples
to confirm or reject this study’s finding of effect mea-
sure modification by race.
Conclusions
We found a high prevalence of perceived oral health
impacts in this sample of low-income female WIC partici-
pants. Although the inverse association between OHL and
OHRQoL across the entire sample was weak, subjects in
the “low” OHL group reported signific antly more OHR-
QoL impacts versus those with higher literacy. Within the
limitations of our study among low-income female care-
givers, our findings indicate that the association between
OHL and OHRQoL appears to be modified by race.
Acknowledgements
The COHL Project is supported by the NIDCR Grant RO1DE018045.
Author details
1
Department of Pediatric Dentistry. 228 Brauer Hall, CB#7450, UNC School of
Dentistry. University of North Carolina at Chapel Hill. Chapel Hill. North
Carolina, 27599, USA.
2
Department of Epidemiology. 228 Brauer Hall,
CB#7450, UNC School of Dentistry. University of North Carolina at Chapel
Hill. Chapel Hill. North Carolina, 27599, USA.
3
Department of Health Policy
and Management. CB#7411. University of North Carolina at Chapel Hill.
Chapel Hill. North Carolina, 27599, USA.
Authors’ contributions
KD conducted the data analysis and prepared the first draft of the
manuscript. JL conceived the study, overviewed the data analysis,
contributed to the interpretation of results and assisted in preparation of the
first draft of the manuscript. ADB participated in data collection, and critically
revised the manuscript. WFV contributed to the interpretation of results and
critically revised the manuscript. All authors read and approved the final
manuscript.
Competing interests
The authors declare that they have no competing interests.
Received: 6 July 2011 Accepted: 1 December 2011
Published: 1 December 2011
References
1. Lee IC, Shieh TY, Yang YH, Tsai CC, Wang KH: Individuals’ perception of
oral health and its impact on the health-related quality of life. J Oral
Rehabil 2007, 34:79-87.
2. Allen PF: Assessment of oral health related quality of life. Health Qual Life
Outcomes 2003, 1:40.
3. Gift HC, Atchison KA: Oral health, health, and health-related quality of
life. Med Care 1995, 33(11 Suppl):NS57-77.
4. Locker D: Measuring oral health: a conceptual framework. Community
Dent Health 1988, 5:3-18.
5. Wilson IB, Cleary PD: Linking clinical variables with health-related quality
of life. A conceptual model of patient outcomes. JAMA 1995, 273:59-65.
6. Brennan DS, Spencer AJ: Mapping oral health related quality of life to
generic health state values. BMC Health Serv Res 2006, 6:96.
7. Department of Health and Human Services: Oral Health in America: A
Report of the Surgeon General. Rockville, Md: National Institute of Dental
and Craniofacial Research, National Institutes of Health, US Dept of Health
Table 3 Adjusted
1
’problem’ rate ratios (PRR) of OHIP-14
severity (cumulative score) corresponding to one
standard deviation change in OHL (5
PRR
2
95% CL
Entire sample 0.91 0.86, 0.98
Race
White 1.01 0.91, 1.11
African American 0.86 0.77, 0.96
American Indian 0.92 0.80, 1.05
1: Zero-inflated negative binomial model, including terms for age, education
level and dental attendance.
2: Estimates corresponds to the relative change in OHIP-14 cumulative score
for one standard deviation increase in OHL.
Divaris et al. Health and Quality of Life Outcomes 2011, 9:108
/>Page 8 of 9
and Human Services; 2000:7:158-168[ />sgrohweb/home.htm].
8. Montero J, Bravo M, Vicente MP, Galindo MP, López JF, Albaladejo A:
Dimensional structure of the oral health-related quality of life in healthy
Spanish workers. Health Qual Life Outcomes 2010, 8:24.
9. John MT: Exploring dimensions of oral health-related quality of life using
experts’ opinions. Qual Life Res 2007, 16:697-704.
10. Sanders AE, Slade GD, Lim S, Reisine ST: Impact of oral disease on quality
of life in the US and Australian populations. Community Dent Oral
Epidemiol 2009, 37:171-81.
11. Slade GD, Nuttall N, Sanders AE, Steele JG, Allen PF, Lahti S: Impacts of oral
disorders in the United Kingdom and Australia. Br Dent J 2005,
198:489-493.
12. Protheroe J, Wallace LS, Rowlands G, DeVoe JE: Health literacy: setting an
international collaborative research agenda. BMC Fam Pract 2009, 10:51.
13. Nutbeam D: The evolving concept of health literacy. Soc Sci Med 2008,
67:2072-2078.
14. Dewalt DA, Berkman ND, Sheridan S, Lohr KN, Pignone MP: Literacy and
health outcomes: a systematic review of the literature. J Gen Intern Med
2004, 19:1228-1239.
15. Andrus MR, Roth MT: Health literacy: a review. Pharmacotherapy 2002,
22:282-302.
16. Kutner M, Greenberg E, Jin Y, Boyle B, Hsu Y, Dunleavy E: Literacy in
Everyday Life: Results from the 2003 National Assessment of Adult
Literacy. Washington, DC: US Department of Education; 2007, 2007-4800
[ NCES.
17. Wallace LS, Rogers ES, Weiss BD: Relationship between health literacy and
health-related quality of life among Tennesseans. Tenn Med 2008,
101:35-39.
18. Baker DW: The meaning and the measure of health literacy. J Gen Intern
Med 2006, 21:878-883.
19. Patrick DL, Lee RS, Nucci M, Grembowski D, Jolles CZ, Milgrom P: Reducing
oral health disparities: a focus on social and cultural determinants. BMC
Oral Health 2006, 6(Suppl 1):S4.
20. National Institute of Dental and Craniofacial Research, National Institute of
Health, U.S. Public Health Service, Department of Health and Human
Services: The invisible barrier: literacy and its relationship with oral
health. A report of a workgroup sponsored by the National Institute of
Dental and Craniofacial Research, National Institute of Health, U.S. Public
Health Service, Department of Health and Human Services. J Public
Health Dent 2005, 65:174-182.
21. Horowitz AM, Kleinman DV: Oral health literacy: the new imperative to
better oral health.
Dent Clin North Am 2008, 52:333-344.
22. Jones M, Lee JY, Rozier RG: Oral health literacy among adult patients
seeking dental care. J Am Dent Assoc 2007, 138:1199-1208.
23. Lee JY, Rozier RG, Lee SY, Bender D, Ruiz RE: Development of a word
recognition instrument to test health literacy in dentistry: the REALD-30
– a brief communication. J Public Health Dent 2007, 67:94-98.
24. Lee JY, Divaris K, Baker D, Rozier RG, Vann WF Jr: The Relationship of Oral
Health Literacy with Oral Health Status and Dental Neglect. Am J Public
Health 2011, e1-e7.
25. Sabbahi DA, Lawrence HP, Limeback H, Rootman I: Development and
evaluation of an oral health literacy instrument for adults. Community
Dent Oral Epidemiol 2009, 37:451-462.
26. Parker EJ, Jamieson LM: Associations between Indigenous Australian oral
health literacy and self-reported oral health outcomes. BMC Oral Health
2010, 10:3.
27. Divaris K, Lee JY, Baker AD, Vann WF Jr: Caregivers’ oral health literacy
and their young children’s oral health related quality of life. Acta Odont
Scand .
28. Gong DA, Lee JY, Rozier RG, Pahel BT, Richman JA, Vann WF Jr:
Development and testing of the Test of Functional Health Literacy in
Dentistry (TOFHLiD). J Public Health Dent 2007, 67:105-112.
29. Richman JA, Lee JY, Rozier RG, Gong DA, Pahel BT, Vann WF Jr: Evaluation
of a word recognition instrument to test health literacy in dentistry: the
REALD-99. J Public Health Dent 2007, 67:99-104.
30. Lee JY, Divaris K, Baker D, Rozier RG, Lee SY, Vann WF Jr: Oral health
literacy levels among a low-income WIC population. J Public Health Dent
2011, 71:152-160.
31. Kalton G: Models in the practice of survey sampling. International
Statistical Review 1983, 51:175-188.
32. Slade GD: Derivation and validation of a short-form oral health impact
profile. Community Dent Oral Epidemiol 1997, 25:284-290.
33. Locker D, Allen F: What do measures of ‘oral health-related quality of life’
measure? Community Dent Oral Epidemiol 2007, 35:401-411.
34. Vann WF Jr, Lee JY, Baker D, Divaris K: Oral health literacy among female
caregivers: impact on oral health outcomes in early childhood. J Dent
Res 2010, 89
:1395-1400.
35. Fan J, Gijbels I: Local Polynomial Modelling and its Applications. London:
Chapman & Hall; 1996, 14-22.
36. Cleveland WS: Robust locally weighted regression and smoothing
scatterplots. Journal of the American Statistical Association 1979, 74:829-836.
37. Lee AH, Wang K, Scott JA, Yau KK, McLachlan GJ: Multi-level zero-inflated
poisson regression modelling of correlated count data with excess
zeros. Stat Methods Med Res 2006, 15:47-61.
38. Lewsey JD, Thomson WM: The utility of the zero-inflated poisson and
zero-inflated negative binomial models: a case study of cross-sectional
and longitudinal DMF data examining the effect of socio-economic
status. Community Dent Oral Epidemiol 2004, 32:183-189.
39. Vuong QH: Likelihood Ratio Tests for Model Selection and Non-Nested
Hypotheses. Econometrica 1989, 57:307-333.
40. John MT, Slade GD, Szentpétery A, Setz JM: Oral health-related quality of
life in patients treated with fixed, removable, and complete dentures 1
month and 6 to 12 months after treatment. Int J Prosthodont 2004,
17:503-511.
41. Poole C: Beyond the confidence interval. Am J Public Health 1987,
77:195-199.
42. Greenland S, Rothman KJ: Introduction to stratified analysis. In Modern
epidemiology. Edited by: Rothman KJ, Greenland S, Lash TL. New York:
Lippincott, Williams and Wilkins; 2008:258-282.
43. Sanders AE, Slade GD, John MT, Steele JG, Suominen-Taipale AL, Lahti S,
Nuttall NM, Allen PF: A cross-national comparison of income gradients in
oral health quality of life in four welfare states: application of the Korpi
and Palme typology. J Epidemiol Community Health 2009, 63:569-574.
44. Sanders AE, Slade GD, Turrell G, John Spencer A, Marcenes W: The shape
of the socioeconomic-oral health gradient: implications for theoretical
explanations. Community Dent Oral Epidemiol 2006, 34:310-319.
45. Miller E, Lee JY, DeWalt DA, Vann WF Jr: Impact of caregiver literacy on
children’s oral health outcomes. Pediatrics 2010, 126:107-114.
46. Simon MA, Dong X, Nonzee N, Bennett CL: Heeding our words:
complexities of research among low-literacy populations. J Clin Oncol
2009, 27:1938-1940.
47. Macek MD, Haynes D, Wells W, Bauer-Leffler S, Cotten PA, Parker RM:
Measuring conceptual health knowledge in the context of oral health
literacy: preliminary results. J Public Health Dent 2010, 70:197-204.
48. Hyde S, Satariano WA, Weintraub JA: Welfare dental intervention
improves employment and quality of life. J Dent Res 2006, 85:79-84.
49. Gilbert GH: Racial and socioeconomic disparities in health from
population-based research to practice-based research: the example of
oral health. J Dent Educ 2005, 69:1003-1014.
50. Manly JJ: Deconstructing race and ethnicity: implications for
measurement of health outcomes. Med Care 2006, 44(11 Suppl 3):S10-6.
51. Lawrence HP, Thomson WM, Broadbent JM, Poulton R: Oral health-related
quality of life in a birth cohort of 32-year olds. Community Dent Oral
Epidemiol 2008, 36:305-316.
52. Stucky BD, Lee JY, Lee SY, Rozier RG: Development of the Two-Stage
Rapid Estimate of Adult Literacy in Dentistry. Community Dent Oral
Epidemiol 2011.
doi:10.1186/1477-7525-9-108
Cite this article as: Divaris et al.: The relationship of oral health literacy
with oral health-related quality of life in a multi-racial sample of low-
income female caregivers. Health and Quality of Life Outcomes 2011 9:108.
Divaris et al. Health and Quality of Life Outcomes 2011, 9:108
/>Page 9 of 9