báo cáo hóa học:" Mapping of the Insomnia Severity Index and Other Sleep Measures to EuroQol EQ-5D Health State Utilities" ppt
Bạn đang xem bản rút gọn của tài liệu. Xem và tải ngay bản đầy đủ của tài liệu tại đây (692.04 KB, 37 trang )
This Provisional PDF corresponds to the article as it appeared upon acceptance. Fully formatted
PDF and full text (HTML) versions will be made available soon.
Mapping of the Insomnia Severity Index and Other Sleep Measures to EuroQol
EQ-5D Health State Utilities
Health and Quality of Life Outcomes 2011, 9:119 doi:10.1186/1477-7525-9-119
Ning Y Gu ()
Marc F Botteman ()
Xiang Ji ()
Christopher F Bell ()
John A Carter ()
Ben van Hout ()
ISSN 1477-7525
Article type Research
Submission date 17 October 2011
Acceptance date 30 December 2011
Publication date 30 December 2011
Article URL />This peer-reviewed article was published immediately upon acceptance. It can be downloaded,
printed and distributed freely for any purposes (see copyright notice below).
Articles in HQLO are listed in PubMed and archived at PubMed Central.
For information about publishing your research in HQLO or any BioMed Central journal, go to
/>For information about other BioMed Central publications go to
/>Health and Quality of Life
Outcomes
© 2011 Gu et al. ; licensee BioMed Central Ltd.
This is an open access article distributed under the terms of the Creative Commons Attribution License ( />which permits unrestricted use, distribution, and reproduction in any medium, provided the original work is properly cited.
1
Mapping of the Insomnia Severity Index and Other Sleep Measures to
EuroQol EQ-5D Health State Utilities
Ning Y Gu,
1
Marc F Botteman,
1
Xiang Ji,
1
Christopher F Bell,
2
John A Carter,
1
Ben van Hout
3,4
AFFILIATIONS:
1
Pharmerit North America, LLC,4350 East West Highway, Suite 430,Bethesda,
MD 20814,United States of America
2
GlaxoSmithKline, Global Health Outcomes, Five Moore Drive, RTP, NC 27709,
United States of America
3
Pharmerit Ltd., Tower House, Suite 8, Fishergate - York, YO10 4UA, United
Kingdom
4
Department of Health Economics, HEDS, ScHARR, The University of Sheffield,
Regent Court, 30 Regent Street, Sheffield S1 4DA, United Kingdom
E-MAIL ADDRESSES
NYG:
MFB:
XJ:
CFB:
JAC:
BvH:
ADDRESS FOR CORRESPONDENCE:
Ning Yan Gu, PhD
Pharmerit North America, LLC
4350 East West Highway, Suite 430
Bethesda, MD 20814
United States of America
Direct line: +1-240-821-1271
Main line: +1-240-821-1265 (ext. 306)
Fax: +1-240-821-1296
Cell: 626-807-9528
2
ABSTRACT
Background: This study sought to map the Insomnia Severity Index (ISI) and
symptom variables onto the EQ-5D.
Methods: A cross-sectional survey was conducted among adult US residents
with self-reported sleep problems. Respondents provided demographic,
comorbidity, and sleep-related information and had completed the ISI and the
EQ-5D profile. Respondents were classified into ISI categories indicating no,
threshold, moderate, or severe insomnia. Generalized linear models (GLM) were
used to map the ISI's 7 items (Model I), summary scores (Model II), clinical
categories (Model III), and insomnia symptoms (Model IV), onto the EQ-5D. We
used 50% of the sample for estimation and 50% for prediction. Prediction
accuracy was assessed by mean squared errors (MSEs) and mean absolute
errors (MAEs).
Results: Mean (standard deviation) sleep duration for respondents (N=2,842)
was 7.8 (1.9) hours, and mean ISI score was 14.1 (4.8). Mean predicted EQ-5D
utility was 0.765 (0.08) from Models I-III, which overlapped with observed utilities
0.765 (0.18). Predicted utility using insomnia symptoms was higher (0.771(0.07)).
Based on Model I, predicted utilities increased linearly with improving ISI (0.493 if
ISI=28 vs. 1.00 if ISI=0, p<0.01). From Model II, each unit decrease in ISI
summary score was associated with a 0.022 (p<0.001) increase in utility.
Predicted utilities were 0.868, 0.809, 0.722, and 0.579, respectively, for the 4
clinical categories, suggesting that lower utility was related to greater insomnia
severity. The symptom model (Model IV) indicated a concave sleep-duration
function of the EQ-5D; thus, utilities diminished after an optimal amount of sleep.
The MSEs/MAEs were substantially lower when predicting EQ-5D >0.40, and
results were comparable in all models.
Conclusions: Findings suggest that mapping relationships between the EQ-5D
and insomnia measures could be established. These relationships may be used
to estimate insomnia-related treatment effects on health state utilities.
Key Words: Insomnia, Mapping, Insomnia Severity Index, EQ-5D
3
INTRODUCTION
Insomnia is a disorder broadly defined by difficulty with sleeping. It may be
characterized by 1) primary insomnia, without underlying medical cause; 2)
secondary insomnia, with presence of an underlying medical cause; 3) acute
insomnia, symptoms with a short duration or; 4) chronic insomnia, symptoms with
a long duration [1,2]. Patients with insomnia commonly complain of difficulties
initiating/maintaining sleep, early awakening, and non-restorative or poor quality
sleep [3].
The prevalence of insomnia in the adult population ranges from 10% to
30% [1,4-6]. Insomnia is associated with substantial burden to patient and
society. Persistent or prolonged sleeping problems have been associated with
worsened health outcomes including reduced productivity or physical/social
functioning, increased risk of occupational accidents or major depression/anxiety
disorders, poorer health-related quality-of-life (HRQoL) and, increased health
care costs [7-13]. Meanwhile, sleep-related conditions have often been under-
diagnosed and under-treated [14].
A number of insomnia-related generic and disease-specific instruments
have been used to identify and describe the condition. These instruments
include, but are not limited to, the 36-Item Short-Form Health Survey [15], the
Leeds Sleep Evaluation Questionnaire [16], the Medical Outcomes Study Sleep
Scale 12 [17], the Epworth Sleepiness Scale [18,19], the Functional Outcomes of
Sleep Questionnaire [20], the Pittsburgh Sleep Quality Index [21], and the
Insomnia Severity Index (ISI) [22]. In addition to these instruments, insomnia
4
symptom variables such as total sleep duration, sleep latency, number of
nighttime awakenings, and the affect of prior night’s sleep on next-day-
sleepiness are predominant indicators of insomnia severity and are routinely
collected in clinical studies of insomnia [7].
Among the various instruments used for describing insomnia, the ISI is
one of the most commonly used disease-specific measures for self-perceived
insomnia severity [23]. The ISI has 7 items describing insomnia-related health
impairments concerning 1) difficulty falling asleep; 2) difficulty staying asleep; 3)
waking up too early; 4) satisfaction with one’s current sleep pattern; 5) self-
perceived noticeability of current sleep problems to others with regard to patient’s
quality-of-life; 6) psychological burdens, and; 7) interference of sleep problems
with one’s daily functioning. Each item is rated on a 5-point Likert scale with
scores ranging from 0 to 4, indicting “none”, “mild”, “moderate”, “severe” and
“very severe” sleep problems, respectively. The total ISI score is calculated by
summing the scores from the 7 items, and range from a minimum of 0 to a
maximum of 28, with higher scores reflecting more severe sleep problems. In
clinical assessments, the ISI total summary score falls into 1 of 4 ISI categories;
with scores 0-7, 8-14, 15-21, and 22-28 indicating no clinically significant
insomnia, sub-threshold insomnia, moderate insomnia and, clinically severe
insomnia, respectively. The psychometric properties of the ISI have been
evaluated in earlier studies and have been reported to have sound measurement
quality for measuring perceived insomnia severity and the impact of insomnia in
different populations [22,24,25].
5
To quantify the impact of insomnia severity in economic studies such as
cost utility analyses (CUA), preference-based measures are required to capture
patient preferences for a particular health state [26]. Preference-based measures
can be used to generate health state utilities based on a continuous scale
whereby a utility of 1.00 represents “full” health and a utility score of 0.00
corresponds to “death”. Such anchored scores are necessary to calculate quality-
adjusted life-years (QALYs), a measure of life adjusted for the quality of that life,
so that cross comparisons of different health care outcomes are permitted in
health economic evaluations [26-28]. Following guidance issued by the National
Institute for Health and Clinical Excellence (NICE, 2004) [29] in the United
Kingdom, preference-based measures such as the EuroQol EQ-5D [30-32] or the
Health Utility Indices [33] have become common means of generating health
state utilities.
In particular, the EQ-5D is cognitively simple and takes only a few minutes
to complete without imposing excessive response burden. It consists of five items
describing health in terms of mobility, self care, usual activities, pain/discomfort,
and anxiety/depression. Each item has 3 levels whereby higher levels indicate
greater health deficits (1=no problem, 2=some problem and 3=extreme problem).
Hence, the EQ-5D descriptive system defines a total of 243 (3
5
) health states.
Utility values can be computed from EQ-5D item responses using scoring
algorithms [31,34]. Earlier studies have used the EQ-5D in insomnia-related
studies for different populations, but mostly for secondary insomnia involving
comorbid medical conditions such as depression or cancer [35,36].
6
CUAs have recently been conducted in the field of insomnia research
[7,37-41]. Nonetheless, the evidence regarding the relationship between
objective and subjective sleep measures and quantifiable insomnia-related health
economic outcomes remains limited. In cases where direct evidence elicited by
preference-based measures is not available, establishing a mapping relationship
between descriptive clinical measures on insomnia and quantitative effects of
insomnia on HRQoL can be useful.
The purpose of the present study was therefore to establish such a
mapping relationship between insomnia-related measures and the EQ-5D. We
aimed to estimate the associations between the EQ-5D health state utilities and
insomnia severity measures by mapping the ISI and/or predominant indicators of
insomnia onto the EQ-5D.
METHODS
Survey
The analysis was based on a cross-sectional internet survey of
approximately 3,000 US residents with signs and symptoms suggestive of
chronic insomnia. This was an observational study designed to explore the
relationship between subject-reported sleep measurements and outcomes (i.e.
quality of life, functionality, and impact of sleep) in the US community. The survey
was fielded by Harris Interactive which maintains a proprietary web-enabled
panel of research subjects in the US who have agreed to participate in ongoing
survey research.
7
Prior to the screening of any potential subjects, a central Institutional
Review Board (IRB) approved the protocol (GHO-2008-008, 1/5/09), informed
consent form, survey instruments, and all other subject information and/or
recruitment materials. To recruit participants, e-mail invitations were sent to
approximately 90,000 panel members representative of the general public. It was
estimated that approximately 20% of the panel members in the specified subset
would respond to the e-mail invitation. Of those, a 60% qualification rate was
assumed among those insomnia-diagnosed patients. Overall, approximately
3,000 subjects were expected to enroll and complete the study. The study
duration was estimated to be roughly 8 weeks, which included time for subject
recruitment and completion of the questionnaire.
Data
Subjects completed a questionnaire that collected information on
demographics, comorbidities, and previous-night sleep symptoms. Subjects also
provided responses to the ISI and the EQ-5D. Subjects with complete responses
on the EQ-5D and the ISI questionnaire were included in the study if they a) were
at least 18 years of age; b) provided informed consent to participate in the
survey; c) were at least moderately bothered by their sleep problems; d) had
reported problems with (i) falling asleep at the beginning of the night (ii) staying
asleep throughout the night or (iii) not feeling refreshed upon waking following
what was expected to be an adequate night’s sleep for at least 3 times per week,
or (iv) at least 2 of the problems listed above at least once per week.
8
Subjects were excluded from the study if they 1) were employed in full-
time or part-time jobs that involved night shifts or day-night rotating shifts; 2) had
children under 1 year old; or 3) reported a physician-diagnosis of competing
symptoms of sleep such as obstructive sleep apnea, narcolepsy, periodic limb
movement disorder, or restless leg syndrome.
Models and Variables
A series of generalized linear models (GLM) was used for the present
analysis. Based on the distribution of the variables, we indentified a gamma
family distribution and a log link using the Modified Park tests for model
specifications [42,43]. The dependent variable was the EQ-5D utilities computed
based on the responses to the 5 items using a US algorithm [34]. While the
gamma family was selected to account for the skewed dependent variable
distribution, to respect its distribution for real values on a positive space (from 0
to ∞) [43], the modeled dependent variable was constructed as the disutility
values of the EQ-5D (=1-utility) computed using the following equation:
Utility = 1-Disutility =
∑
+− )exp(1
βα
Xi (1)
Four GLM functional forms were used (Table 1). For Models I-III the
predictors for the EQ-5D disutility values were the 7 ISI items, a continuous (0-
28) ISI summary score, and the 4 ISI clinical categories, respectively. For Model
IV, we used sleep symptom variables identified from the existing literature on
insomnia [7,44-46], namely, previous night’s sleep duration, sleep quality, sleep
latency, next-day-sleepiness as an effect of prior night’s sleep, and the number of
9
wakeup times during the night. Predictors in Model IV were supplemented with
patient characteristics such as age, gender, and the presence/absence of
comorbidities.
The comorbidity predictor was constructed as a binary variable
representing the presence (=1) or absence (=0) of any of the 17 chronic non-
insomnia-competing conditions reported by the respondents based on prior
physician diagnoses. The chronic conditions included: anxiety disorder, arthritis,
bipolar disorder, cancer, cardiovascular condition, chronic fatigue syndrome,
chronic pain, depression, diabetes, drug/alcohol abuse, fibromyalgia, HIV/AIDS,
insomnia, irritable bowel syndrome, neuropathic pain, respiratory condition, and
schizophrenia.
The decision to use a single binary(yes/no) comorbidity presence indicator
rather than one variable per condition or counting the sum of the total number of
conditions was made, primarily, to impose a minimal burden on future data
collection. Specifically, it should be emphasized that the objective of this study
was not to predict utility levels using a large number of clinical and demographic
variables. Rather, we sought to construct a simple—if not generic—tool that
would allow researchers to predict utility in a community-based population of
individuals exhibiting insomnia symptoms using as few variables as possible.
Ultimately, we hope that the algorithm generated in this process can be used by
researchers who either could not collect utilities in previous research or, for other
reasons, will not be able to do so in the future. Hence, the focus of this analysis
was on external rather than internal validity. The approach selected herein with
10
regard to comorbidity was consistent with the broader sleep-research literature
which emphasizes insomnia without comorbidities (i.e., primary insomnia) from
insomnia with comorbidities (i.e., secondary insomnia).
For the sleep duration variable used in the Model IV, based on preliminary
analysis of the predictors, observed EQ-5D health state utility was found to be
optimal when the amount of sleep was approximately 7-9 hours (mean [standard
deviation, SD] sleep duration=7.8 [1.9] hours). EQ-5D utility decreased when one
slept more/less than that optimal amount or extreme hours, which gave a
concave sleep duration function of EQ-5D utility/disutility. Thus, a squared term
of the sleep duration variable was included in the model.
Moreover, the sleep quality-rating variable ranged from 0, indicating poor
sleep quality to 10, indicating excellent sleep quality. The next-day-sleepiness
item also used a rating ranging from 0 suggesting not feeling sleepy due to prior
night’s sleep pattern to 10 for feeling extremely sleepy. Sleep latency was
captured using total minutes of delay to sleep and the total number of wake up
times during the night ranged from minimum of 1 time to a maximum of 5 times.
We treated these predictors as continuous for simplicity.
Analyses
We used 50% of the sample to generate the mapping function (i.e.,
estimation sample) and, the other 50% to validate the model performance (i.e.,
validation sample). Samples were randomly split for each process. Predictions in
the validation process were made based on parameters estimated from
11
estimation sample. The validation process was repeated 30 times to ensure we
obtained a sufficient number of predictions to account for variability. Average
values from the 30 validations were calculated for each of the 4 models.
To determine the predictive precision of the models, we computed model
mean square error (MSE) and mean absolute error (MAE). The MSE was given
by:
K
N
YY
MSE
−
−
=
∑
2
)
ˆ
(
where Y=observed EQ-5D values,
Y
ˆ
=predicted EQ-5D
values, N=total or subgroup sample sizes and, K=degrees of freedom. Hence,
the MSEs were computed by adjusting the number of independent variables
included in the model. Thus, a perfect prediction would be indicated by a zero
MSE and, smaller MSEs indicated lower prediction errors. Since MSEs penalized
larger errors by using the squared term of errors, we also computed the MAE.
The MAE was given by:
N
YY
MAE
∑
−
=
ˆ
, again, Y=observed EQ-5D values,
Y
ˆ
=predicted EQ-5D values N=total or subgroup sample sizes, The MAEs
provided error statistics that did not give greater weight to larger errors.
The overall model performance was also assessed by examining the
distributional qualities of the predicted EQ-5D scores compared with the
observed ones with regard to mean, median, min/max, and range. SAS 9.2 was
used for data preparation, STATA11 was used for regression and statistical tests,
and Microsoft Excel was used for prediction error computations.
12
RESULTS
Of the 3,034 survey participants, 2,842 (93.67%) met all
inclusion/exclusion criteria and were included in the present analyses. Table 2
reports respondents’ socio-demographic characteristics. The mean (±SD) age of
the total sample was 42.9 (±15.7) years. Nearly two thirds of respondents were
female and 83.7% were Caucasian. The mean (±SD) observed EQ-5D utility
score was 0.765 (±0.20) and was lowest for individuals aged 50 to 59 (0.749
[±0.20]). On average, respondents reported 7.8 (±1.9) hours of sleep during the
previous night. The mean (±SD) ISI summary score was 14.1 (±4.8). According
to the ISI clinical classification, 6.19%, 52.08%, 33.57%, and 8.16% of
respondents were categorized as having no clinically significant insomnia, sub-
threshold insomnia, moderately severe insomnia, and severe insomnia,
respectively. Individuals aged 40 to 59 reported the least mean (±SD) amount of
sleep duration (7.5 [±1.8]) and higher scores on ISI items, suggesting greater
sleep problems. In addition, compared with male respondents, females reported
longer mean sleep durations (7.9 vs. 7.5 hours) and higher mean EQ-5D scores
(0.766 vs. 0.762) despite higher ISI summary scores (14.3 vs. 13.7). In this
particular sample 62.4% of respondents reported ≥1 comorbid medical conditions
and, for those who reported ≥1 comorbid conditions, mean EQ-5D scores were
lower compared with those who reported no comorbid conditions (0.723 vs.
0.835). ISI summary scores decreased (i.e., insomnia improved) as sleep quality
improved, and increased (i.e., insomnia worsened) with rating increases of next-
day-sleepiness, sleep latency, and number of wake-up times. Therefore, a longer
13
time to fall asleep and a greater number of wake-up times during a night were
associated with higher ISI scores and lower the EQ-5D utility values.
Table 3 exhibits the model regression estimates using the different set of
predictors on EQ-5D disutility. For Model I, except for ISI item 4 (i.e., degree of
satisfaction with sleep pattern) and item 7 (extent of interference with daily
functioning due to sleep pattern), ISI items showed significant associations with
EQ-5D scores (p<0.05). Higher levels of ISI items were associated with greater
health deficit (greater disutility values). ISI summary scores in Model II and
clinical classification scores in Model III also showed significant associations with
EQ-5D disutility values (p<0.001). In Model IV, except for age and gender, all
other predictors were able to provide substantial explanations of EQ-5D scores
(p<0.05). The signs of model coefficients were as expected.
Table 4 compares the mean, median, min/max, and range of observed
and predicted EQ-5D values for both estimation and validation sample estimates.
EQ-5D utility values were computed using equation (1). The observed EQ-5D
mean (±SD) utility value was 0.765 (±0.18), with a median value of 0.800 and a
range of [-0.040-1.000]. Mean predicted scores were identical with those
observed for three ISI models (Models I-III). The predicted mean was slightly
higher for Model IV, when insomnia symptoms were used for prediction
(0.771(±0.07)), compared with Models I-III using ISI (0.765 (±0.08)). Similar
results were found in validation sample estimates.
Table 5 shows the model prediction errors. The MSEs and MAEs were
lower for EQ-5D utilities greater than 0.40. This suggested that predictions were
14
more robust for higher health state utilities (i.e., >0.4), which were reported by
94.02% of the respondents in the sample. At the same time, relatively poorer
predictions at tail end of utilities have been reported as a common problem
associated with mapping [47]. Owing to the very small sample size (0.63%) of
respondents who had observed utilities <0.2, MSEs for EQ-5D utilities less than
0.2 could not be computed in Models I and IV. Similar results were found using
the validation samples.
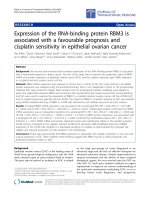
Figure 1 depicts observed and predicted EQ-5D utility values for Models I-
IV along the ISI scores (ranging from 0 to 28), which showed negative
correlations between the two instruments. The predicted EQ-5D utility values
followed more closely with observed ones for mid-range scores, especially for
Models I-III. For Model IV, EQ-5D utility values were under-predicted for ISI
scores less than 14 (no insomnia or threshold insomnia) and over-predicted for
ISI scores greater than 14 (moderate or severe insomnia). Nevertheless, the
association between greater insomnia symptom severity and lower health utilities
was observed in all models.
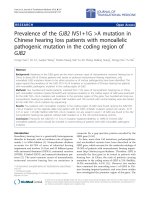
Figure 2 shows the observed and predicted EQ-5D values along sleep
duration using half-hour intervals. Again, predicted and observed EQ-5D utilities
followed each other closely along sleep durations except for the higher and lower
ends of sleep hours (i.e., extreme hours). The concave function of sleep duration
of the EQ-5D utility was preserved, suggesting that health state utilities increase
at a decreasing rate along sleep durations.
15
DISCUSSION
The extent of association between a disease-specific instrument (i.e., ISI)
and a generic preference-based instrument (i.e., EQ-5D) is affected by the
amount of correspondence between the two measures with regard to the
underlying HRQoL [48]. Findings from this analysis suggest there was sufficient
overlapping of underlying HRQoL between insomnia measures and EQ-5D
health state utilities. While the ISI is commonly used in clinical trials and was
specifically designed to describe and evaluate insomnia severity, it does not
provide the preference-based measures necessary for health economic
evaluations quantifying the impact of insomnia on patients’ health state utilities.
To the best of our knowledge, the present study is the first to map an insomnia-
specific instrument and/or sleep variables to EQ-5D utility values. Hence, the
cross-walk conducted herein establishes a preliminary mapping relationship and
link between these measures.
Findings from this analysis were consistent with earlier studies wherein
poorer sleep outcomes (e.g., sleep quality, next-day-sleepiness, and extreme
sleep hours) were significantly associated with declining HRQoL [8,12,49]. Such
associations were observed in the present analysis, especially for individuals with
greater sleep difficulties (Figure 1) or extreme sleep durations (Figure 2).
With respect to sleep duration for example, a recent study by Faubel et al.
(2009) reported that for older men and women, extreme sleep durations (≤5
hours or ≥10 hours) were indicators of worse HRQoL, compared with those who
sleep 7-8 hours per night [8]. Studies of different populations have also reported
16
this same effect: that short-duration sleep [50] or long-duration sleep [51] or both
[52], were associated with worse HRQoL. This association was noted in our
model predictions by taking other factors into consideration (Model IV).
Quantifying the effect of insomnia on HRQoL is essential for targeting
effective treatments, and comparing treatment cohorts in clinical practice. The
mapping relationship established between the ISI and the EQ-5D in this analysis
provides a necessary cross-walk when a preference-based measure such as
EQ-5D was not administered. For example, using a hypothetical scenario where
a 36-year old female had ISI item scores of 0, 3, 1, 4, 3, 3, and 2, which would
result in an ISI summary score of 16 and a ISI class of 3. Further, she also
reported 8.58 hours of sleep, ≥1 comorbidity, 1 on overall sleep quality, 5
minutes of sleep onset latency during previous night, 8 on next day sleepiness,
and 5 wake-up times. Using the algorithms provided (Table 1, equation (1)), her
estimated EQ-5D utility values would be 0.772, 0.748, 0.723, and 0.690 using
Models I-IV, respectively (see Table 6 for sample computations).
For this particular scenario, compared with Model I, the estimated utilities
using Models II and III were decreased by approximately 3% and 6%,
respectively (0.772 vs. 0.748 and 0.723). When Model IV was used, the
estimated utility was lower by 10% (0.772 vs. 0.690). These discrepancies were
associated with different model specifications as each model incorporated
different assumptions. In Model I, the predictions based on 7 distinctive item
scores were able to capture more precise information for describing the EQ-5D
and different items categories were assumed to have their own weight on the
17
EQ-5D scores. Conversely, in Model II a continuous summary score ranging from
0 to 28 was used. This assumed that each unit increment/decrement in total ISI
score would give the same impact on the EQ-5D regardless of which item. The
case is similar for Model III, where the clinical categories were constructed based
on the summary scores. One way to conceptualize this is to understand that
Models II and III penalized the estimated utilities by placing more weight on the
items that had more impact on the EQ-5D. Model IV is a different model
specification aimed to estimate the same outcome. It captured more disease-
specific information in explanatory variables, and therefore the estimated EQ-5D
utilities were penalized the most. Alternatively, these discrepancies could be
lowered by using a sample scenario with all best levels of ISI items where no
problems were reported on all items, i.e., score=0 on all items. Using the same
computation, the estimated utilities for Models I-III would be approximately 0.914,
0.905 and 0.868, respectively, resulting 1% and 5% differences in estimated
utilities using Models II and III, respectively compared with Model I. Given these
findings, Model I should be used when data for all ISI items are available.
Based on the findings, marginal changes on treatment effects on insomnia
could also be estimated. If the same respondent had improved her sleep pattern
somehow and decreased her ISI score to 14 (from 16), then by using Model II,
her predicted EQ-5D utility score would be 0.776 (=1-exp(-2.34909+ 0.06077*
14) instead of 0.748, corresponding to a difference of approximately 0.0289 unit
of utility. On the other hand, holding other variables constant and assuming
changes to ISI item 5 (e.g., if she thought her sleep problem was noticed “a little
18
by others” (level 1)); then using the Model I algorithm, her health utility would be
0.761 (=1-exp(-2.45614+0.04681+0.14380-
0.04075+0.13552+0.41963+0.24329+0.0766)), instead of 0.772. Similar
magnitudes of health disutility gains and losses could be estimated if changes
had taken place on other ISI items. From a health policy standpoint, such
quantification is useful for assessing the effect of treatment on health utility
values. Thus, the findings provided herein make it possible to estimate EQ-5D
utility values when direct evidence is absent from the primary research, but when
ISI or insomnia-related symptoms data are available.
It is important to note the limitations of this study. First, while significant
associations were noted between insomnia measures and EQ-5D utilities in the
current study, the mapping technique implicitly assumes that the EQ-5D covers
all important aspects of the latent health construct that the ISI is intended to
measure. Hence, the strength of the mapping function is underpinned by the
degree of overlap between the two measures. While all model estimates
rendered very close approximations of the EQ-5D observed scores, the
regression-based transformation presented herein is self-contained in that
disease-specific scores are permitted to be transformed to a generic utility
measure without referencing additional data and aimed for repeated uses on
secondary data analysis from other clinical trials [48]. Therefore, the external
validity of the study should be verified using other data sets.
Second, since different models control for different predictors, each entails
a different magnitude of effects. At the group level, predicted mean utility values
19
closely estimated observed values. At the individual level, algorithms presented
in this study may include some discrepancies from one model to another, as was
indicated in the above example. Therefore, our algorithms may more accurately
predict individual EQ-5D values for a group level evaluation for CUA studies in
making group level comparisons.
Third, regression-based mapping from one measure to another inevitably
results in floor and ceiling effects for predicted values [48]. We noted higher
MSEs in all models for lower EQ-5D utility values (EQ-5D<0.4) Thus, our
algorithms were less reliable for respondents with EQ-5D scores <0.4.
Fourth, QALYs implicitly involve the concept of survival, but we estimated
health utility values with a cross-sectional data set. Hence, the directional effects
of insomnia on patients’ utility over time, or, the responsiveness of the estimates
could not be assessed in the present study. It is therefore unclear whether the
mathematical links reported in this study would vary over time.
Fifth, the current study relied on respondents’ self-reported health status
and not on physician assessment or medical records. Hence, the aim was not to
identify cause-and-effect relationships between sleep problems and other
specific conditions or parameters. Interestingly, findings based on responses
from such a convenient sample and not from a controlled clinical study were
strikingly consistent with the study hypotheses, which provided vital validity of the
analyses.
Sixth, treating the sleep quality variable in Model IV as continuous was a
simplistic approach which assumed that each unit increase in sleep quality
20
equally impacted the EQ-5D. Comparisons on the prediction results using the
continuous and the categorical sleep quality showed that both approaches had
equivalent predicted outcomes; although, the trade-off was that distinctive effects
on each sleep quality categories on the EQ-5D could not be separated under the
continuous approach. Since the purpose of this study was to obtain the best
estimates of the EQ-5D based on pre-defined predictors, we reported our
findings under the continuous approach in Model IV.
Finally, the binary indicator of comorbidity used herein disregarded the
possibility that a respondent with more than one comorbidity would likely report a
worse utility, all other things being equal, than a respondent with one
comorbidity. Likewise, this approach did not take into account which comorbidity
was present, thus ignoring the possibility that some condition may have had a
stronger impact on utility than others. It was beyond the scope of the present
analysis to capture a more detailed quantification of these effects. Rather, an
approximation of the EQ-5D utility values based on included parameters could be
implemented using Model IV. Based on our findings, such approximation or
estimation could be carried out in patients with either no comorbidities (i.e.,
primary insomnia) or in patients with one or more comorbidities (i.e., secondary
insomnia). More importantly, the model was implementable regardless of
whether the comorbidity conditions were listed in the current survey.
21
CONCLUSION
Estimating EQ-5D health state utility values using the algorithms
presented herein permits comparisons of health outcomes in the absence of
preference-based measures. Despite the aforementioned limitations, these
algorithms give flexibility of computing EQ-5D health state utilities using different
types of empirical insomnia data. Meanwhile the mapping relationship explored in
this study serves as a “second-best” approach relative to direct elicitation of
preference-based measures in clinical studies. Out-of-sample validation of these
algorithms is encouraged to further establish the relationship between insomnia
measures and the EQ-5D. This is especially true among patient groups with
relatively lower observed health state utility values.
22
COMPETING INTERESTS:
This manuscript was funded by GlaxoSmithKline. CFB is an employee of
GlaxoSmithKline. NYG, MFB, XJ, JAC, and BvH are employees of Pharmerit
which was paid a consulting fee by GlaxoSmithKline related to the development
of this manuscript.
AUTHORS’ CONTRIBUTIONS:
NYG, MFB, and BvH contributed to study design, analysis, interpretation, and
manuscript writing. XJ and CFB contributed to study design, analysis, and
interpretation. JAC contributed to analysis, interpretation, and manuscript writing.
All authors have read and approved the final manuscript.
23
REFERENCES
1. American Psychiatric Association, American Psychiatric Association, Task
Force on DSM-IV: Diagnostic and statistical manual of mental disorders
DSM-IV-TR, 4th ed., text revision edn. Washington, DC: American
Psychiatric Association; 2000.
2. Moul DE, Hall M, Pilkonis PA, Buysse DJ: Self-report measures of
insomnia in adults: rationales, choices, and needs. Sleep Med Rev
2004, 8: 177-198.
3. Ancoli-Israel S, Roth T: Characteristics of insomnia in the United States:
results of the 1991 National Sleep Foundation Survey. I. Sleep 1999, 22
Suppl 2: S347-S353.
4. Drake CL, Roehrs T, Roth T: Insomnia causes, consequences, and
therapeutics: an overview. Depress Anxiety 2003, 18: 163-176.
5. Roth T, Roehrs T: Insomnia: epidemiology, characteristics, and
consequences. Clin Cornerstone 2003, 5: 5-15.
6. Roth T: Insomnia: definition, prevalence, etiology, and consequences.
J Clin Sleep Med 2007, 3: S7-10.
7. Botteman MF, Ozminkowski RJ, Wang S, Pashos CL, Schaefer K, Foley DJ:
Cost effectiveness of long-term treatment with eszopiclone for primary
insomnia in adults: a decision analytical model. CNS Drugs 2007, 21:
319-334.
8. Faubel R, Lopez-Garcia E, Guallar-Castillon P, Balboa-Castillo T, Gutierrez-
Fisac JL, Banegas JR et al.: Sleep duration and health-related quality of
life among older adults: a population-based cohort in Spain. Sleep
2009, 32: 1059-1068.
9. Gibson GJ: Obstructive sleep apnoea syndrome: underestimated and
undertreated. Br Med Bull 2004, 72: 49-65.
10. Martin SA, Aikens JE, Chervin RD: Toward cost-effectiveness analysis in
the diagnosis and treatment of insomnia. Sleep Med Rev 2004, 8: 63-72.
11. Merlino G, Fratticci L, Lenchig C, Valente M, Cargnelutti D, Picello M et al.:
Prevalence of 'poor sleep' among patients with multiple sclerosis: an
independent predictor of mental and physical status. Sleep Med 2009,
10: 26-34.
12. Silva GE, An MW, Goodwin JL, Shahar E, Redline S, Resnick H et al.:
Longitudinal evaluation of sleep-disordered breathing and sleep
24
symptoms with change in quality of life: the Sleep Heart Health Study
(SHHS). Sleep 2009, 32: 1049-1057.
13. Siriwardena AN, Apekey T, Tilling M, Harrison A, Dyas JV, Middleton HC et
al.: Effectiveness and cost-effectiveness of an educational intervention
for practice teams to deliver problem focused therapy for insomnia:
rationale and design of a pilot cluster randomised trial. BMC Fam Pract
2009, 10: 9.
14. Botteman M: Health economics of insomnia therapy: implications for
policy. Sleep Med 2009, 10 Suppl 1: S22-S25.
15. Ware JE, Jr., Sherbourne CD: The MOS 36-item short-form health survey
(SF-36). I. Conceptual framework and item selection. Med Care 1992, 30:
473-483.
16. Parrott AC, Hindmarch I: Factor analysis of a sleep evaluation
questionnaire. Psychol Med 1978, 8: 325-329.
17. Stewart AL, Ware JE: Measuring functioning and well-being the medical
outcomes study approach. Durham: Duke University Press; 1992.
18. Johns MW: A new method for measuring daytime sleepiness: the
Epworth sleepiness scale. Sleep 1991, 14: 540-545.
19. Miletin MS, Hanly PJ: Measurement properties of the Epworth
sleepiness scale. Sleep Med 2003, 4: 195-199.
20. Weaver DR: Reproductive safety of melatonin: a "wonder drug" to
wonder about. J Biol Rhythms 1997, 12: 682-689.
21. Buysse DJ, Reynolds CF, III, Monk TH, Berman SR, Kupfer DJ: The
Pittsburgh Sleep Quality Index: a new instrument for psychiatric
practice and research. Psychiatry Res 1989, 28: 193-213.
22. Bastien CH, Vallieres A, Morin CM: Validation of the Insomnia Severity
Index as an outcome measure for insomnia research. Sleep Med 2001,
2: 297-307.
23. Morin CM, Espie CA: Insomnia: A Clinician's Guide to Assessment and
Treatment. New York: Kluwer Academic/Plenum; 2003.
24. Sierra JC, Guillen-Serrano V, Santos-Iglesias P: [Insomnia Severity Index:
some indicators about its reliability and validity on an older adults
sample]. Rev Neurol 2008, 47: 566-570.
25. Yu DS: Insomnia Severity Index: psychometric properties with Chinese
community-dwelling older people. J Adv Nurs 2010, 66: 2350-2359.