báo cáo hóa học:" Mapping of the EQ-5D index from clinical outcome measures and demographic variables in patients with coronary heart disease" pptx
Bạn đang xem bản rút gọn của tài liệu. Xem và tải ngay bản đầy đủ của tài liệu tại đây (906.15 KB, 13 trang )
Goldsmith et al. Health and Quality of Life Outcomes 2010, 8:54
/>Open Access
RESEARCH
© 2010 Goldsmith et al; licensee BioMed Central Ltd. This is an Open Access article distributed under the terms of the Creative Com-
mons Attribution License ( which permits unrestricted use, distribution, and reproduc-
tion in any medium, provided the original work is properly cited.
Research
Mapping of the EQ-5D index from clinical outcome
measures and demographic variables in patients
with coronary heart disease
Kimberley A Goldsmith*
1,2,3
, Matthew T Dyer
4,5
, Martin J Buxton
4
and Linda D Sharples
1,2
Abstract
Background: The EuroQoL 5D (EQ-5D) is a questionnaire that provides a measure of utility for cost-effectiveness
analysis. The EQ-5D has been widely used in many patient groups, including those with coronary heart disease. Studies
often require patients to complete many questionnaires and the EQ-5D may not be gathered. This study aimed to
assess whether demographic and clinical outcome variables, including scores from a disease specific measure, the
Seattle Angina Questionnaire (SAQ), could be used to predict, or map, the EQ-5D index value where it is not available.
Methods: Patient-level data from 5 studies of cardiac interventions were used. The data were split into two groups -
approximately 60% of the data were used as an estimation dataset for building models, and 40% were used as a
validation dataset. Forward ordinary least squares linear regression methods and measures of prediction error were
used to build a model to map to the EQ-5D index. Age, sex, a proxy measure of disease stage, Canadian Cardiovascular
Society (CCS) angina severity class, treadmill exercise time (ETT) and scales of the SAQ were examined.
Results: The exertional capacity (ECS), disease perception (DPS) and anginal frequency scales (AFS) of the SAQ were
the strongest predictors of the EQ-5D index and gave the smallest root mean square errors. A final model was chosen
with age, gender, disease stage and the ECS, DPS and AFS scales of the SAQ. ETT and CCS did not improve prediction in
the presence of the SAQ scales. Bland-Altman agreement between predicted and observed EQ-5D index values was
reasonable for values greater than 0.4, but below this level predicted values were higher than observed. The 95% limits
of agreement were wide (-0.34, 0.33).
Conclusions: Mapping of the EQ-5D index in cardiac patients from demographics and commonly measured cardiac
outcome variables is possible; however, prediction for values of the EQ-5D index below 0.4 was not accurate. The newly
designed 5-level version of the EQ-5D with its increased ability to discriminate health states may improve prediction of
EQ-5D index values.
Background
The EuroQoL 5D (EQ-5D) is a widely used generic mea-
sure of health related quality of life (HRQoL) and can be
used to generate a single index value or utility [1-3]. This
utility value is used for the calculation of quality-adjusted
life years (QALYs) for cost-effectiveness analysis. The
EQ-5D is currently recommended by the UK's National
Institute for Health and Clinical Excellence (NICE) as a
tool for quantifying utility in adults [3,4]. Quality of life
and cost-effectiveness analyses are important for trials of
interventions in cardiac patients and the EQ-5D has been
used to calculate QALYs for cost-effectiveness analyses in
several such trials [5-9].
Patients participating in clinical trials and other studies
often have to complete many questionnaires, sometimes
at multiple points in time. The EQ-5D is a short survey
that has been shown to have good acceptability and feasi-
bility in the general public and in cardiac patients [10-12].
However, in many studies it may not have been adminis-
tered, for reasons of perceived patient burden from mul-
tiple questionnaires or because the study has not initially
focused on economic questions. With the growing
importance of cost-effectiveness estimation to inform
* Correspondence:
1
Papworth Hospital NHS Trust, Cambridge, UK
Full list of author information is available at the end of the article
Goldsmith et al. Health and Quality of Life Outcomes 2010, 8:54
/>Page 2 of 13
Government and health insurers' policy decisions, it
would be useful to be able to predict, or map, the EQ-5D
index from other commonly collected demographics and
clinical outcome variables.
Mapping of preference based measures using non-pref-
erence based tools is a growing area of study [13]. Such
models could be used to predict the EQ-5D index in cases
where it was not administered. Mapping of the EQ-5D
index requires development of multiple variable regres-
sion models that predict the EQ-5D index with the mini-
mum amount of error possible, so that predicted values
give a reasonable estimate of the unobserved EQ-5D
index. Mapping models may need to be derived sepa-
rately for different disease groups, since the most effec-
tive predictors may vary between diseases. Also, mapping
models need to incorporate variables that are commonly
measured when studying the disease in question. For
example, in studies of cardiac interventions, demograph-
ics and one or more common cardiac outcome measures,
such as treadmill exercise time (ETT), Canadian Cardio-
vascular Society Angina Classification (CCS) and the
Seattle Angina Questionnaire (SAQ), are generally gath-
ered. Such variables would be obvious candidates for
inclusion in models for mapping the EQ-5D index in car-
diac patients.
Consistency in relationships between the EQ-5D index,
patient characteristics and cardiac outcome measures
across different studies/disease severity groups have
recently been assessed using both aggregate and patient
level data by our group [7,14]. The study using patient
level data looked at the individual relationship between
each of the cardiac measures described above and the
EQ-5D index using data from several studies. Type of
treatment and study variables were included to adjust for
disease severity and type of population (ie. those selected
for a clinical trial versus those entered into a cohort
study) in order to get more accurate estimates of the mag-
nitude of the relationship between the measures and the
EQ-5D index. In the current study, the aim was to take
these clinical measures in combination in a single model
to predict the EQ-5D index. In this case, disease severity
was taken into account using a single variable, and more
implicitly from the point of view of stage of disease, as we
felt this would be an important contributor to accurately
predicting the EQ-5D index. The previous study found
the relationship between the cardiac measures and the
EQ-5D index were of different magnitudes and differed
across patients having different treatments [14]. The
treatments patients have roughly correspond to their dis-
ease severity, so it was important to take the disease stage
into account when trying to map from disease specific
variables to the EQ-5D index.
Several studies have looked at mapping using other
generic or disease-specific HRQoL measures, with one
other using clinical measures to map to the EQ-5D index
[13,15]. This study aimed to use individual patient data to
derive mapping models for the EQ-5D index in cardiac
patients with different levels of disease severity by incor-
porating into these models multiple demographic factors
and clinical cardiac measures commonly used when
treating and studying these patients.
Methods
Data
The authors had access to individual patient data from 5
major studies in patients with cardiovascular disease in
which both the EQ-5D and one or more commonly-used
cardiac measurements were available, which were a sub-
set of the studies used in our previous study [14]. A main
dataset was created using data measured at multiple time
points on patients participating in 4 randomised clinical
trials [5,6,8,16], and 1 cohort study [17]. The studies cov-
ered diagnosis of cardiac disease and interventions in
patients ranging from early disease managed medically to
end-stage heart failure and are described briefly in Table
1. Measurements in the different studies were divided
into baseline and post-treatment measurements and
these were used as separate records to provide informa-
tion about patient variables at different stages of disease.
Further details of the studies used, the clinical measures,
the use of measurements from different time points, and
the individual relationship between each of these clinical
measures and the EQ-5D index can be found in our ear-
lier paper [14]. The dataset was then divided in two by
taking a random sample of 60% of the data and separating
that data from the remaining 40% to provide an estima-
tion dataset and a validation dataset, respectively. There
were similar proportions of records from each study in
each of the two datasets (Table 1).
Measurements assessed
The EQ-5D questionnaire consists of 5 questions cover-
ing health domains of mobility, self-care, usual activity,
pain and anxiety/depression [1-3]. Each domain has three
levels of severity: no problems, some or moderate prob-
lems and severe problems. Utility weights can then be
attached to the EQ-5D health state provided by the ques-
tionnaire [18]. Utility values range from 1 (best possible
health), through 0 (death) to -0.59 (worse than death)
[19]. The UK algorithm for calculating the EQ-5D index
was used in this study [18].
Total exercise time was available from a modified Bruce
protocol treadmill test (ETT). The Bruce protocol
requires walking on a treadmill at a given speed and with
a given grade, both of which increase through three
stages [14,20].
Angina class was measured by the Canadian Cardiovas-
cular Society Angina Scale. The CCS was recorded as a 5-
Goldsmith et al. Health and Quality of Life Outcomes 2010, 8:54
/>Page 3 of 13
point score according to the amount of exercise required
to bring on angina from 0 (no angina even on strenuous
or prolonged physical exertion) to IV (angina with mini-
mal exertion or at rest).
The disease-specific Seattle Angina Questionnaire
(SAQ) has five dimensions related to angina: the exer-
tional capacity scale (ECS), anginal stability scale (ASS),
anginal frequency scale (AFS), treatment satisfaction
scale (TSS) and the disease perception scale (DPS). Each
scale has a range of 0 to 100 with higher values represent-
ing greater functioning/satisfaction and fewer limitations.
Statistical analysis
Continuous variables were summarized using the mean
and standard deviation. Relationships between the EQ-
5D index and continuous explanatory variables were
explored by studying scatter plots and correlations
between the variables. Categorical variables were sum-
marized using frequencies and proportions. The relation-
ship between the EQ-5D index and categorical variables
was explored by summarizing the mean and standard
deviation of the EQ-5D index for different levels of these
variables, and using the Student's t-test or analysis of
variance for comparisons.
For mapping, a base linear model was fitted using ordi-
nary least squares (OLS) estimation with EQ-5D index as
the dependent variable and age, sex and a proxy for dis-
ease stage as explanatory variables in the model using the
estimation dataset. The proxy 'disease stage' variable was
created by taking into account both the procedures
patients had undergone and the time point of the EQ-5D
index measurement. Patients were classified as a) having
had only medical management (MM, ie. a baseline mea-
surement in a patient with no prior procedures and who
was randomised to MM during the study), b) being pre-
balloon angioplasty +/- stent (PTCA) (ie. a baseline mea-
surement for a patient who went on to have a balloon
angioplasty with or without a stent during the study), c)
pre-coronary artery bypass graft (CABG), or d) post-
PTCA or e) post-CABG, if the patient had one of these
procedures before the study began. This variable consti-
tuted a proxy for disease stage because patients that only
had medical management were likely to be the least ill,
but those that entered a study and then had PTCA or
CABG were probably at a more advanced stage of disease
upon presentation. Furthermore, if patients had one or
more revascularisation procedures before entering the
study, they are likely to have even further advanced dis-
ease. In a situation where a patient could conceivably fit
into two categories, for example, if they had both a PTCA
and a CABG before the study, or they had a PTCA before
the study but would go on to have a CABG during the
study, they were put in the category of the most invasive
procedure, for example, post-CABG in the first instance,
pre-CABG in the second. For the Percutaneous Myocar-
dial Revascularization (PMR), Transmyocardial Laser
Revascularization (TMR) and SpiRiT studies, the inter-
ventions were PMR, TMR or spinal cord stimulation
(SCS) rather than CABG. These were grouped together
with CABG since all of these trials involved patients with
angina that was not controlled by medical management
and for whom conventional revascularisation (PTCA or
CABG) had failed or was not possible. Age, sex and dis-
ease stage proxy variables were retained in all models. To
Table 1: Distribution of records selected for estimation and validation of models by study
Study n (%) in 60% estimation dataset n (%) in 40% validation dataset
CeCAT - Cost-effectiveness of functional cardiac testing in the
diagnosis and management of CHD [8]
1061 (37.2) 664 (35.2)
ACRE - Appropriateness for coronary revascularization [17] 1449 (50.8) 970 (51.4)
PMR - Percutaneous myocardial revascularization compared to
continued medical therapy in patients with refractory angina [6]
69 (2.4) 52 (2.8)
TMR - Transmyocardial laser revascularization compared to
continued medical therapy in patients with refractory angina [5]
200 (7.0) 148 (7.8)
SPiRiT - Spinal cord stimulation (SCS) compared to PMR in patients
with refractory angina [16]
76 (2.7) 53 (2.8)
Angina total (PMR, TMR, SPiRiT) 345 (12.1) 253 (13.4)
Total 2855 1887
Goldsmith et al. Health and Quality of Life Outcomes 2010, 8:54
/>Page 4 of 13
this base model ETT, CCS class and individual SAQ
scales were each added in a stepwise fashion to the model
each as an additional explanatory variable. A range of
multiple variable models was constructed using the esti-
mation dataset with a combination of these variables
depending upon their importance based on adjusted R
2
values. The variable that gave the largest increase in
adjusted R
2
was added first, and then all remaining vari-
ables were tested again one at a time. Variables were
added until there was no appreciable change in adjusted
R
2
(less than 5%). The root mean square error (RMSE)
and mean absolute error (MAE) were also calculated to
assess model fit and prediction ability [13]. The RMSE
was calculated by taking the square root of the mean
square error from the models. MAE was calculated as the
sum of the absolute differences between the predicted
and observed values, divided by the sample size. Adjusted
R
2
was used for choosing models rather than one of these
measures of prediction accuracy because it is penalised
for larger models, with the use of the less than 5% change
criterion further contributing to a parsimonious model.
Only two of the five SAQ scales were available for the
Appropriateness for Coronary Revascularization (ACRE)
study, so interaction terms were used to examine whether
there were differences in the effect of these scales in the
ACRE data as compared to the other studies. Interaction
terms between ETT, CCS and SAQ and the disease stage
proxy variable were also pre-specified. This allowed for
different relationships between these variables and the
EQ-5D index in different disease stage groups, which was
important given that a high degree of heterogeneity in
these relationships has previously been shown [14].
One of the multiple variable models was chosen as the
mapping model based upon explanation of the maximum
amount of variability in the EQ-5D index with the fewest
variables, as well as relatively low RMSE and MAE values.
To validate this model the regression equation was
applied to the data in the validation dataset, predicted
values of the EQ-5D index were obtained for each person,
and these predicted values compared to the observed val-
ues. Standardised residuals and fitted EQ-5D index val-
ues from fitting the final model in both the estimation
and validation datasets were plotted against one another.
A Bland-Altman analysis was performed, both in the esti-
mation and validation datasets, to see how well the
observed and predicted EQ-5D index agreed and if there
appeared to be any systematic measurement bias in the
predicted index. The intraclass correlation coefficient
(ICC) for the observed and predicted values was calcu-
lated as a further measure of agreement. The final model
was also fitted to the data in the validation dataset to
obtain the adjusted R
2
, RMSE and MAE.
The study includes secondary analysis of results from a
range of studies. All primary studies had ethical approval
from Local Research Ethics committees between 1993
and 2001.
Results
There were 2855 records in the estimation dataset and
1887 in the validation dataset. The estimation and valida-
tion datasets had similar distributions of the variables of
interest (Tables 2 and 3). The EQ-5D index was slightly
higher for men than for women and significantly lower
for higher CCS angina classifications (Table 3). The EQ-
5D index was also significantly lower in patients that were
post-CABG/other serious intervention compared to
patients in the other disease stage proxy groups (Table 3).
Table 4 shows that the ECS of the SAQ had a marked cor-
relation (correlation coefficient > 0.6) with the EQ-5D
index, while most of the other correlations were low or
moderate. Age was not correlated with the EQ-5D index
in the estimation dataset.
Results of the mapping model constructed from the
estimation dataset are described in Tables 5 and 6. There
were 1106 records in the estimation data with non-miss-
ing covariates in the final model. The variables in the base
model - age, sex and disease stage proxy - only explained
4% of the variation in the EQ-5D index and gave an
RMSE of 0.288. When either of ETT or CCS alone was
added to the base model, this was reduced to 0.226 or
0.249, respectively, and just under 30% of the variability
was explained. The addition of the ECS scale of the SAQ
to the model accounted for the greatest variability in the
EQ-5D index (43%) and gave the lowest RMSE (0.179) of
all the variables when added singly. As the ASS and AFS
scales were the only SAQ scales available from the ACRE
study, and the ACRE data were therefore no longer
included in the multiple variable models once the other
scales were added, their relationship to the EQ-5D index
was compared in ACRE and the other studies using an
interaction term. The results for models with ASS and
AFS have also been presented with the ACRE data
excluded (Tables 5 and 6). The interaction term was sig-
nificant for ASS, suggesting a different relationship
between ASS and EQ-5D index in ACRE as compared to
the other studies. There was little difference in the
amount of variability explained, by ASS, however,
whether ACRE data were included or not. The error was
reduced when the ACRE data were excluded. In the case
of the AFS scale, the interaction term was not significant.
AFS appeared to provide greater error reduction and to
explain more variability in the EQ-5D index when the
ACRE data were removed. Other interaction terms did
not improve the fit of the model appreciably.
The model equations for the chosen prediction model,
Model 11, which has the base variables plus ECS, DPS
and AFS of the SAQ is shown below. This model
explained 48% of the variation in the EQ-5D index in the
Goldsmith et al. Health and Quality of Life Outcomes 2010, 8:54
/>Page 5 of 13
estimation dataset and had an RMSE of 0.170. The equa-
tion for Model 12, which has all of the SAQ scales
included, is also shown. The RMSE for this model was
0.169, so the prediction error from these two models was
not appreciably different.
Model 11: EQ-5D index = 0.147 + 0.002*age - 0.009(if
male) + 0.021(if MM) + 0.048(if pre-PCI) + 0.018(if post-
PCI) + 0.073(if pre-CABG) + 0.0036*(ECS) + 0.0021*
(DPS) + 0.0015*(AFS)
Model 12: EQ-5D index = 0.071 + 0.002*age - 0.009(if
male) + 0.023(if MM) + 0.047(if pre-PCI) + 0.015(if post-
PCI) + 0.071(if pre-CABG) + 0.0036*(ECS) + 0.0004*
(ASS) + 0.0018*(DPS) + 0.0014*(AFS) + 0.0010*(TSS)
There were 702 records with non-missing covariates in
the final model in the validation dataset. The ICC for the
observed and predicted values of the EQ-5D index was
0.64 (95% CI 0.59, 0.68). When the mapping model was
applied to the validation dataset it produced an adjusted
R
2
of 0.44, RMSE of 0.167 and an MAE of 0.123, which
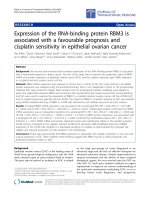
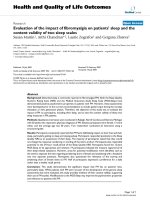
were similar to the results in the estimation dataset. Fig-
ure 1 shows plots of standardised residuals versus fitted
EQ-5D index values in both the estimation and validation
datasets, showing evidence of the partly discrete nature
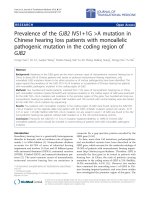
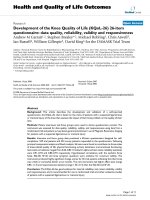
of the EQ-5D index at its upper end. The Bland-Altman
analysis (Figure 2) shows reasonable agreement for higher
values of the EQ-5D index, but poor agreement for peo-
ple with EQ-5D index values of approximately 0.4 or less
in both the estimation and validation datasets. Table 7
shows that an observed EQ-5D of 0.4 or less was associ-
ated with a larger RMSE. The lowest predicted value
obtained for EQ-5D index in the validation set was 0.25,
while the lowest value in the data was -0.24. The 95% lim-
its of agreement in the validation dataset were (-0.34,
0.33). The mean difference between predicted and
observed EQ-5D index values for the three trials that
measured the covariates in the final model were (pre-
dicted - observed): 0.004 (95% CI -0.009, 0.016) for
CeCAT, -0.078 (-0.149, -0.007) for PMR and -0.035 (-
0.094, 0.025) for SpiRiT.
Discussion
This study aimed to build a model to map from cardiac
patients' demographic and outcome measures to the EQ-
5D index. The SAQ ECS was the strongest predictor of
the EQ-5D index, and had the lowest RMSE as compared
to other variables available. The SAQ DPS and AFS scores
also entered the model, indicating that a disease-specific
measure of patient health and disease perception was an
important predictor of the generic measure of HRQoL. If
interest centres on mapping the EQ-5D index in another
disease area, disease specific measures for the disease in
question may also be important. The mapping exercise
was initially performed with the EQ-5D index bounded to
a 0-1 scale and logit transformed as the outcome variable
for the OLS models. There was little difference in predic-
tion results whether these transformations were applied
or not, and so the non-transformed EQ-5D index was
used as the outcome for simplicity. The residual plots
show some potential difficulties with using OLS (Figure
1). The ceiling effect of EQ-5D index values close to 1 was
Table 2: Summary of continuous variables in estimation and validation datasets
Variable Estimation dataset
sample size
Validation dataset
sample size
Estimation dataset mean
(SD)
Validation dataset mean
(SD)
EQ-5D 2855 1887 0.68 (0.29) 0.67 (0.30)
Age 2855 1887 63.8 (9.7) 64.0 (9.2)
ETT 1356 883 10.1 (4.6) 10.1 (4.4)
SAQ ECS 1119 712 70.4 (24.4) 71.9 (25.4)
SAQ ASS 1812 1200 53.3 (24.5) 53.4 (24.9)
SAQ AFS 2314 1491 74.2 (27.6) 73.7 (28.3)
SAQ DPS 1200 764 62.4 (25.2) 63.7 (25.8)
SAQ TSS 1200 764 88.7 (15.5) 89.2 (14.4)
Key: SD = standard deviation, EQ-5D = EuroQol 5D index, ETT = exercise treadmill time, SAQ = Seattle Angina Questionnaire, ECS = exertional
capacity scale, ASS = anginal stability scale, AFS = anginal frequency scale, DPS = disease perception scale, TSS = treatment satisfaction scale
Goldsmith et al. Health and Quality of Life Outcomes 2010, 8:54
/>Page 6 of 13
apparent as well as patterns that are probably partly due
to EQ-5D index not taking all values on the continuum.
Others have acknowledged this issue and explored other
models with similar findings [21]. Tsuchiya et al. men-
tioned the option of transforming the data, but suggested
that it may be less important for prediction as opposed to
when modelling for explanatory purposes, and also that
transformation may make prediction models less applica-
ble in situations where the distribution of the data may be
different [21]. We feel the use of OLS models was reason-
able in this study, given that there was a large amount of
data available. This suggests that mean values could be
assumed to have an asymptotic Normal distribution and
unbiased estimators were obtained. Also, we found that
the results were robust to the different forms of the out-
come variable used.
The final mapping model explained 48% of the variabil-
ity in EQ-5D index and provided essentially the lowest
RMSE at 0.17. This RMSE was, however, higher than the
minimal important difference for the EQ-5D index of
0.05 [22,23] and high compared to some RMSEs found in
other similar studies of mapping the EQ-5D index [13].
The ICC was consistent with a moderate to good correla-
tion between observed and predicted EQ-5D scores.
However, using the model to predict the observed EQ-5D
index in the validation dataset did not indicate good pre-
diction on average and the Bland-Altman plot showed
that the mapping model over-estimated the EQ-5D index
Table 3: Summary of categorical variables in estimation and validation datasets
Variable Estimation dataset, n
(%)
Validation dataset, n
(%)
Mean (SD) EQ-5D
(estimation dataset)
p-value (estimation
dataset)
Gender 0.04
Male 2059 (72) 1361 (72) 0.69 (0.30)
Female 796 (28) 526 (28) 0.66 (0.29)
CCS class <0.001
0 499 (18) 319 (17) 0.81 (0.24)
I 513 (18) 306 (16) 0.78 (0.21)
II 801 (28) 509 (27) 0.70 (0.23)
III 364 (13) 252 (13) 0.49 (0.29)
IV 326 (11) 265 (14) 0.38 (0.33)
Disease stage proxy <0.001
MM 1241 (44) 815 (43) 0.71 (0.28)
Pre PCI 116 (4) 63 (3) 0.77 (0.21)
Post PCI 428 (15) 259 (14) 0.70 (0.29)
Pre CABG/SCS/laser 66 (2) 47 (3) 0.76 (0.20)
Post CABG/SCS/laser 993 (35) 698 (37) 0.61 (0.31)
Key: SD = standard deviation, EQ-5D = EuroQol 5D index, CCS = Canadian Cardiovascular Society Angina Classification, MM = medical
management, PCI = balloon angioplasty ± stent, CABG = coronary artery bypass graft, SCS = spinal cord stimulation, laser = percutaneous or
transmyocardial laser revascularization
Goldsmith et al. Health and Quality of Life Outcomes 2010, 8:54
/>Page 7 of 13
for people with observed values of approximately 0.4 and
below in both the estimation and validation datasets. The
plot had relatively wide 95% agreement limits of approxi-
mately ± 0.3, which again are much larger than the mini-
mal important difference for the EQ-5D index [22,23].
The RMSEs were also higher for EQ-5D <= 0.4 in both
datasets. A similar result has been seen before for
patients with stable angina, where a model mapping clini-
cal measures on to the EQ-5D index explained 37% of the
variability in the EQ-5D index and also performed poorly
in individuals with EQ-5D index values of about 0.4 or
less [15]. Other studies mapping other HRQoL measures
on to EQ-5D have had similar findings [21,24]. One pos-
sible reason for the poorer prediction could be sparse
data; Table 7 shows there were few people in the data
with an observed EQ-5D index of <= 0.4. Using data
where there are more patients with low EQ-5D index val-
ues might help better predict values across the range.
Several different strategies for improving the predictive
ability of the model were explored. These included adding
the ETT and CCS variables back into the final model,
even though they did not enter the model under the pre-
specified criterion. These two variables were tried in the
final model as their lack of importance in the mapping
model was somewhat surprising. This is perhaps espe-
cially true for the CCS, which was found in a previous
study to have a strong relationship with the EQ-5D index
[14]. These variables did not improve prediction, possibly
due to the inclusion of disease stage. A model with higher
order SAQ terms was also tested, as were several models
with interaction terms between the disease stage proxy
variable and the other variables in the final model.
Although the model with higher order SAQ scale terms
allowed for the prediction of lower values of the EQ-5D
index, none of these strategies improved the agreement
between the predicted and observed values appreciably.
Similar findings have been published in the wider map-
ping literature [13]. It is possible that an important pre-
dictor of HRQoL, such as the patient's social isolation
and/or mental state, was missing. Such information
might contribute to explaining the difference between
two patients with the same level of disease severity but
very different EQ-5D index values.
Finally, the mean difference in observed and predicted
values was smallest for patients from the CeCAT study,
which was the study that contributed the most data and
also that had the healthiest participants. This may mean
the prediction model derived here is more applicable to
patients early in the course of disease and that further
study using data with more patients across the spectrum
of disease could improve prediction, perhaps especially
towards the lower end of the EQ-5D index range. There
was a further nuance in prediction of the EQ-5D index
between studies shown by these estimates - the predic-
tion model under-predicted values of the EQ-5D index
overall in the PMR study, and to some extent in the
SpiRiT study - the Bland-Altman analysis shows over-
prediction for the few people with an observed EQ-5D
index below 0.4 for all three studies, but some under-pre-
diction for people with EQ-5D index measurements of
greater than 0.4 in the PMR and SpiRiT studies.
Another potential explanation for the poor prediction
is that while the 5-question, 3-response format makes the
EQ-5D easy to administer and complete, it describes a
relatively small number of possible health states and does
not discriminate well, especially towards the end of the
Table 4: Correlation of continuous variables with EQ-5D index from estimation dataset
Variable Correlation coefficient p-value
Age, n = 2855 0.05 0.008
ETT, n = 1356 0.42 <0.001
SAQ ECS, n = 1119 0.63 <0.001
SAQ ASS, n = 1812 0.30 <0.001
SAQ AFS, n = 2314 0.45 <0.001
SAQ DPS, n = 1200 0.57 <0.001
SAQ TSS, n = 1200 0.30 <0.001
Key: EQ-5D = EuroQol 5D index, ETT = exercise treadmill time, SAQ = Seattle Angina Questionnaire, ECS = exertional capacity scale, ASS =
anginal stability scale, AFS = anginal frequency scale, DPS = disease perception scale, TSS = treatment satisfaction scale
Goldsmith et al. Health and Quality of Life Outcomes 2010, 8:54
/>Page 8 of 13
Table 5: Results of multiple variable modelling in the estimation dataset
Model 123456789101112
Sample
size
2844 1345 2492 1108 1801 1186 2303 1186 1189 1189 1106 1104
Age per
year
0.002 0.008 0.001 0.003 0.002 0.003 0.0004 0.002 -0.001 0.002 0.002 0.002
(0.001,
0.004)
(0.006,
0.009)
(0.0002,
0.002)
(0.002,
0.005)
(0.0004,
0.003)
(0.001,
0.004)
(-0.001,
0.002)
(0.001,
0.003)
(-0.002,
0.001)
(0.0004,
0.003)
(0.001,
0.003)
(0.001,
0.003)
Sex = male 0.054 -0.031 0.038 -0.012 0.031 0.034 0.035 0.019 0.013 0.029 -0.009 -0.009
(0.029,
0.078)
(-0.061,
-0.002)
(0.015,
0.061)
(-0.037,
0.012)
(0.003,
0.059)
(0.004,
0.064)
(0.013,
0.058)
(-0.007,
0.046)
(-0.013,
0.039)
(-0.001,
0.059)
(-0.033,
0.014)
(-0.033,
0.014)
MM 0.117 0.111 0.043 0.016 0.123 0.133 0.053 0.049 0.089 0.132 0.021 0.023
(0.091,
0.142)
(0.079,
0.142)
(0.018,
0.068)
(-0.015,
0.046)
(0.091,
0.154)
(0.098,
0.169)
(0.027,
0.078)
(0.016,
0.083)
(0.057,
0.121)
(0.095,
0.168)
(-0.009,
0.050)
(-0.007,
0.052)
Pre PCI 0.165 0.134 0.107 0.022 0.181 0.130 0.152 0.089 0.117 0.120 0.048 0.047
(0.110,
0.221)
(0.086,
0.181)
(0.057,
0.157)
(-0.020,
0.064)
(0.127,
0.235)
(0.079,
0.181)
(0.103,
0.200)
(0.043,
0.135)
(0.072,
0.161)
(0.069,
0.172)
(0.008,
0.088)
(0.007,
0.087)
Post PCI 0.101 0.127 0.036 0.027 0.084 0.116 0.037 0.047 0.076 0.129 0.018 0.015
(0.068,
0.134)
(0.082,
0.172)
(0.004,
0.067)
(-0.013,
0.067)
(0.043,
0.125)
(0.068,
0.165)
(0.006,
0.068)
(0.003,
0.092)
(0.033,
0.119)
(0.080,
0.178)
(-0.021,
0.056)
(-0.023,
0053)
Pre CABG* 0.151 0.146 0.132 0.048 0.178 0.124 0.186 0.120 0.113 0.117 0.073 0.071
(0.079,
0.223)
(0.087,
0.205)
(0.069,
0.195)
(-0.004,
0.100)
(0.108,
0.248)
(0.060,
0.188)
(0.122,
0.249)
(0.063,
0.177)
(0.057,
0.169)
(0.053,
0.182)
(0.024,
0.123)
(0.022,
0.121)
ETT per
minute
0.027
(0.024,
0.030)
CCS**
0 0.426
(0.391,
0.461)
I 0.395
(0.360,
0.430)
II 0.307
(0.274,
0.340)
III 0.114
(0.077,
0.152)
Goldsmith et al. Health and Quality of Life Outcomes 2010, 8:54
/>Page 9 of 13
scale describing good health [25,26]. In addition, the sec-
ond level on the EQ-5D (some or moderate problems)
could include people with quite a wide range of problems
in a given domain, corresponding to widely different lev-
els of HRQoL. A 5-level version of the EQ-5D has been
created and piloted and shows evidence of feasibility and
greater face validity for patients [27], less of a ceiling
effect, and better health state discrimination [27,28].
Besides potentially improving the discriminatory proper-
ties of the EQ-5D, the 5-level EQ-5D index will allow for
more variability in the measure and may more accurately
reflect some health states, possibly making mapping of
the EQ-5D index from other measures more successful
across all severity levels.
Limitations
One limitation of the study was that only three out of the
five studies that were available had all of the necessary
covariates. This limits the external validity of the findings
and may have other unknown effects that users of the
mapping algorithm should bear in mind. For example, the
ACRE study only included two of the five SAQ scales and,
when interaction terms were used to compare the effect
of these two scales in ACRE versus the other studies,
there was some evidence of a difference, meaning the
effects might have been different had we had such infor-
mation from ACRE patients or had data from more stud-
ies. Future work should include further development and
validation of potential mapping models on datasets with
more complete information on covariates and more data
on patients with more severe cardiac disease. Secondly,
ECS** 0.0062 0.0036 0.0036
(0.0057,
0.0066)
(0.0030,
0.0042)
(0.0030,
0.0042)
ASS 0.0032
(0.0027,
0.0037)
ASS (ACRE
excluded)
0.0031 0.0004
(0.0025,
0.0036)
(-0.0001,
0.0008)
AFS 0.0046
(0.0043,
0.0050)
AFS (ACRE
excluded)
0.0047 0.0015 0.0014
(0.0043,
0.0051)
(0.0010,
0.0020)
(0.0008,
0.0020)
DPS 0.0055 0.0021 0.0018
(0.0050,
0.0060)
(0.0015,
0.0027)
(0.0012,
0.0024)
TSS 0.0043 0.0010
(0.0035,
0.0052)
(0.0002,
0.0017)
*CABG also includes SCS (spinal cord stimulation) and laser (percutaneous or transmyocardial laser revascularization ) treatments. Reference
category - Post CABG.
**Reference category, class IV.
***All SAQ score parameter estimates are for a one point increase in the score for the given scale.
Key: MM = medical management, PCI = balloon angioplasty ± stent, CABG = coronary artery bypass graft, ETT = exercise treadmill time, CCS =
Canadian Cardiovascular Society Angina Classification, ECS = exertional capacity scale, ASS = anginal stability scale, ACRE = Appropriateness for
coronary revascularization, AFS = anginal frequency scale, DPS = disease perception scale, TSS = treatment satisfaction scale
Table 5: Results of multiple variable modelling in the estimation dataset (Continued)
Goldsmith et al. Health and Quality of Life Outcomes 2010, 8:54
/>Page 10 of 13
the UK algorithm for calculating the EQ-5D index was
used, so the models may not be applicable to cardiac
patients from other countries. Thirdly, we have not
explicitly accounted for the correlation between baseline
and treatment measurements on individuals since base-
line measurements will not always be available and the
models should only be used for patients with similar clin-
ical and demographic profiles. Future work should
include validating the model on an independent sample
[13], and for patients with different characteristics,
undergoing different cardiological procedures. Validating
the model in a completely independent dataset would
lend further support to the findings.
Conclusions
In conclusion, it was possible to construct mapping mod-
els for the EQ-5D index using demographic, disease stage
and cardiac outcome measures for a group of cardiac
patients that performed better in predicting the EQ-5D
index for values above 0.4, and less well for values below
Table 6: Measures of prediction from multiple variable modelling in the estimation dataset
Model Variables in model (in addition to age, sex and disease stage) RMSE MAE
Adjusted R2
1 0.288 0.209 0.04
2ETT 0.226 0.169 0.29
3CCS 0.249 0.185 0.28
4 SAQ ECS 0.179 0.130 0.43
5 SAQ ASS 0.264 0.193 0.13
6 SAQ ASS with ACRE data excluded 0.228 0.163 0.15
7 SAQ AFS 0.243 0.175 0.23
8 SAQ AFS with ACRE data excluded 0.204 0.148 0.32
9 SAQ DPS 0.199 0.144 0.35
10 SAQ TSS 0.230 0.165 0.13
11 SAQ ECS, AFS, DPS 0.170 0.122 0.48
12 SAQ ECS, ASS, AFS, DPS, TSS 0.169 0.121 0.49
Key: RMSE = root mean square error, MAE = mean absolute error, ETT = exercise treadmill time, CCS = Canadian Cardiovascular Society Angina
Classification, SAQ = Seattle Angina Questionnaire, ECS = exertional capacity scale, ASS = anginal stability scale, AFS = anginal frequency
scale, DPS = disease perception scale, TSS = treatment satisfaction scale
Table 7: Performance of prediction model in estimation and validation datasets by observed EQ-5D level
Model 11 in estimation dataset Model 11 in validation dataset
RMSE, n 0.170, 1106 0.167, 702
RMSE - EQ-5D <= 0.4, n 0.130, 86 0.126, 44
RMSE - EQ-5D > 0.4, n 0.110, 1020 0.110, 658
Key: EQ-5D = EuroQol 5D index, RMSE = root mean square error
Goldsmith et al. Health and Quality of Life Outcomes 2010, 8:54
/>Page 11 of 13
Figure 1 Plots of standardised residuals against fitted EQ-5D index values for Model 11 in estimation and validation datasets. Key: EQ-5D =
EuroQol 5D index
Estimation
Validation
Goldsmith et al. Health and Quality of Life Outcomes 2010, 8:54
/>Page 12 of 13
Figure 2 Bland-Altman plots of agreement between predicted and observed EQ-5D index from Model 11 in estimation and validation
datasets. Key: EQ-5D = EuroQol 5D index, CeCAT = Cost-effectiveness of functional cardiac testing in the diagnosis and management of CHD study,
Spirit = Spinal cord stimulation (SCS) compared to PMR in patients with refractory angina study, PMR = Percutaneous myocardial revascularization
compared to continued medical therapy in patients with refractory angina study
Estimation
Validation
Goldsmith et al. Health and Quality of Life Outcomes 2010, 8:54
/>Page 13 of 13
that level, where the EQ-5D index was over-estimated.
The root mean square error derived from fitting the final
model in the validation dataset was larger that the mini-
mal important clinical difference for EQ-5D. Prediction
of the EQ-5D index is possible, however, due to the rela-
tively poor prediction across the range, inclusion of a
preference-based measure in a study where cost-effec-
tiveness analysis is an aim would be a better approach
than prediction of the EQ-5D index from other measures.
Competing interests
The authors declare that they have no competing interests.
Authors' contributions
KG performed the analysis and drafted and edited the manuscript. MD edited
the manuscript. MB designed the study and edited the manuscript. LS
designed the study and edited the manuscript.
All authors have read and approved the final manuscript.
Acknowledgements
The authors would like to acknowledge the EuroQoL group for funding for this
project and the patients for participating in the studies.
Author Details
1
Papworth Hospital NHS Trust, Cambridge, UK,
2
MRC Biostatistics Unit, Institute
of Public Health, Cambridge, UK,
3
Institute of Psychiatry, King's College
London, London, UK,
4
Health Economics Research Group, Brunel University,
Uxbridge, UK and
5
National Collaborating Centre for Mental Health, The Royal
College of Psychiatrists, London, UK
References
1. EuroQol Group: EuroQol a new facility for the measurement of health-
related quality of life. The EuroQol Group. Health Policy 1990,
16:199-208.
2. The EQ-5D website: [ />3. Rabin R, de Charro F: EQ-5D: a measure of health status from the
EuroQol Group. Ann Med 2001, 33:337-343.
4. Guide to the methods of technology appraisal, National Institute for
Health and Clinical Excellence website [ />niceMedia/pdf/TAP_Methods.pdf]
5. Campbell HE, Tait S, Buxton MJ, Sharples LD, Caine N, Schofield PM,
Wallwork J: A UK trial-based cost utility analysis of transmyocardial
laser revascularization compared to continued medical therapy for
treatment of refractory angina pectoris. Eur J Cardiothorac Surg 2001,
20:312-318.
6. Campbell HE, Tait S, Sharples LD, Caine N, Gray TJ, Schofield PM, Buxton
MJ: Trial-based cost-utility comparison of percutaneous myocardial
laser revascularisation and continued medical therapy for treatment of
refractory angina pectoris. Eur J Health Econ 2005, 6:288-297.
7. Dyer MT, Goldsmith KA, Sharples LS, Buxton MJ: A review of health
utilities using the EQ-5D in studies of cardiovascular disease. Health
Qual Life Outcomes 2010, 8:13.
8. Sharples L, Hughes V, Crean A, Dyer M, Buxton M, Goldsmith K, Stone D:
Cost-effectiveness of functional cardiac testing in the diagnosis and
management of coronary artery disease: a randomised controlled trial.
The CECaT trial. Health Technol Assess 2007, 11:iii-115.
9. Sharples LD, Dyer M, Cafferty F, Demiris N, Freeman C, Banner NR, Large
SR, Tsui S, Caine N, Buxton M: Cost-effectiveness of ventricular assist
device use in the United Kingdom: results from the evaluation of
ventricular assist device programme in the UK (EVAD-UK). J Heart Lung
Transplant 2006, 25:1336-1343.
10. Badia X, Schiaffino A, Alonso J, Herdman M: Using the EuroQoI 5-D in the
Catalan general population: feasibility and construct validity. Qual Life
Res 1998, 7:311-322.
11. Ellis JJ, Eagle KA, Kline-Rogers EM, Erickson SR: Validation of the EQ-5D in
patients with a history of acute coronary syndrome. Curr Med Res Opin
2005, 21:1209-1216.
12. Schweikert B, Hahmann H, Leidl R: Validation of the EuroQol
questionnaire in cardiac rehabilitation. Heart 2006, 92:62-67.
13. Brazier JE, Yang Y, Tsuchiya A, Rowen DL: A review of studies mapping (or
cross walking) non-preference based measures of health to generic
preference-based measures. Eur J Health Econ 2009, 11(2):215-25.
14. Goldsmith KA, Dyer MT, Schofield PM, Buxton MJ, Sharples LD:
Relationship between the EQ-5D index and measures of clinical
outcomes in selected studies of cardiovascular interventions.
Health
Qual Life Outcomes 2009, 7:96.
15. Longworth L, Buxton MJ, Sculpher M, Smith DH: Estimating utility data
from clinical indicators for patients with stable angina. Eur J Health Econ
2005, 6:347-353.
16. McNab D, Khan SN, Sharples LD, Ryan JY, Freeman C, Caine N, Tait S, Hardy
I, Schofield PM: An open label single-centre, randomized trial of spinal
cord stimulation vs. percutaneous myocardial laser revascularization in
patients with refractory angina pectoris: the SPiRiT trial. Eur Heart J
2006, 27:1048-1053.
17. Griffin SC, Barber JA, Manca A, Sculpher MJ, Thompson SG, Buxton MJ,
Hemingway H: Cost effectiveness of clinically appropriate decisions on
alternative treatments for angina pectoris: prospective observational
study. BMJ 2007, 334:624.
18. Dolan P: Modeling valuations for EuroQol health states. Med Care 1997,
35:1095-1108.
19. Kind P, Hardman G, Macran S: UK Population Norms for EQ-5D: York Centre
for Health Economics Discussion Paper 172 1992.
20. Bruce RA, McDonough JR: Stress testing in screening for cardiovascular
disease. Bull N Y Acad Med 1969, 45:1288-1305.
21. Tsuchiya A, Brazier J, McColl E, Parkin D: Deriving preference-based
single indices from non-preference based condition specific
instruments: converting AQLQ into EQ-5D indices. Sheffield Health
Economics Group Discussion Paper 02/1 2002.
22. Dolan P, Gudex C, Kind P, Williams A: The time trade-off method: results
from a general population study. Health Econ 1996, 5:141-154.
23. Walters SJ, Brazier JE: Comparison of the minimally important difference
for two health state utility measures: EQ-5D and SF-6D. Qual Life Res
2005, 14:1523-1532.
24. Gray AM, Rivero-Arias O, Clarke PM: Estimating the association between
SF-12 responses and EQ-5D utility values by response mapping. Med
Decis Making 2006, 26:18-29.
25. Brazier J, Deverill M, Green C, Harper R, Booth A: A review of the use of
health status measures in economic evaluation. Health Technol Assess
1999, 3:i-164.
26. McDowell I, Newell C: General Health Status and Quality of Life. In
Measuring Health: A guide to rating scales and questionnaires 2nd edition.
Oxford: Oxford University Press; 1996:480-483.
27. Janssen MF, Birnie E, Haagsma JA, Bonsel GJ: Comparing the standard
EQ-5D three-level system with a five-level version. Value Health 2008,
11:275-284.
28. Pickard AS, De Leon MC, Kohlmann T, Cella D, Rosenbloom S:
Psychometric comparison of the standard EQ-5D to a 5 level version in
cancer patients. Med Care 2007, 45:259-263.
doi: 10.1186/1477-7525-8-54
Cite this article as: Goldsmith et al., Mapping of the EQ-5D index from clini-
cal outcome measures and demographic variables in patients with coronary
heart disease Health and Quality of Life Outcomes 2010, 8:54
Received: 4 November 2009 Accepted: 4 June 2010
Published: 4 June 2010
This article is available from: 2010 Go ldsmith et a l; licensee BioMed Cent ral Ltd. This is an Open Access article distributed under the terms of the Creative Commons Attribution License ( ), which permits unrestricted use, distribution, and reproduction in any medium, provided the original work is properly cited.Health and Quality of Life Outcomes 2010, 8:54