báo cáo hóa học:" Psychometric evaluation of a visual analog scale for the assessment of anxiety" pdf
Bạn đang xem bản rút gọn của tài liệu. Xem và tải ngay bản đầy đủ của tài liệu tại đây (584.05 KB, 8 trang )
Williams et al. Health and Quality of Life Outcomes 2010, 8:57
/>Open Access
RESEARCH
© 2010 Williams et al; licensee BioMed Central Ltd. This is an Open Access article distributed under the terms of the Creative Commons
Attribution License ( which permits unrestricted use, distribution, and reproduction in
any medium, provided the original work is properly cited.
Research
Psychometric evaluation of a visual analog scale for
the assessment of anxiety
Valerie SL Williams*
1
, Robert J Morlock
2
and Douglas Feltner
3
Abstract
Background: Fast-acting medications for the management of anxiety are important to patients and society.
Measuring early onset, however, requires a sensitive and clinically responsive tool. This study evaluates the
psychometric properties of a patient-reported Global Anxiety - Visual Analog Scale (GA-VAS).
Methods: Data from a double-blind, randomized, placebo-controlled study of lorazepam and paroxetine in patients
with Generalized Anxiety Disorder were analyzed to assess the reliability, validity, responsiveness, and utility of the GA-
VAS. The GA-VAS was completed at clinic visits and at home during the first week of treatment. Targeted psychometric
analyses—test-retest reliabilities, validity correlations, responsiveness statistics, and minimum important
differences—were conducted.
Results: The GA-VAS correlates well with other anxiety measures, at Week 4, r = 0.60 (p < 0.0001) with the Hamilton
Rating Scale for Anxiety and r = 0.74 (p < 0.0001) with the Hospital Anxiety and Depression Scale - Anxiety subscale. In
terms of convergent and divergent validity, the GA-VAS correlated -0.54 (p < 0.0001), -0.48 (p < 0.0001), and -0.68 (p <
0.0001) with the SF-36 Emotional Role, Social Function, and Mental Health subscales, respectively, but correlated much
lower with the SF-36 physical functioning subscales. Preliminary minimum important difference estimates cluster
between 10 and 15 mm.
Conclusions: The GA-VAS is capable of validly and effectively capturing a reduction in anxiety as quickly as 24 hours
post-dose.
Single-item visual analog scales (VASs) have been used in
psychological assessment since the early 20th century and
have subsequently been employed successfully in the
assessment of a wide variety of health-related constructs
including pain [1-3], quality-of-life [4,5], and mood [6-8].
VASs are brief and simple to administer and minimal in
terms of respondent burden. These characteristics make
them ideal for use in a diary format questionnaire where
patients frequently record symptoms and outcomes.
VASs are particularly useful when assessing a single
construct with many perceptible gradations and research
has shown that unipolar VASs ("Not at all Anxious" to
"Extremely Anxious") are more easily understood than
bipolar VASs ("Extremely Calm" to "Extremely Anxious")
[9]. Although a VAS may be oriented vertically, the most
common form is a horizontal line. In fact, horizontal
scales have been shown to produce a more uniform dis-
tribution of scores and to be more sensitive than vertical
scales [3,10]. Multiple-item VASs are often shown to have
high internal consistency [10]; however, there is wide
variability in test-retest reliabilities—VAS test-retest reli-
ability is generally not uniform across the scale contin-
uum, but better at the middle and extremes [11].
Although VAS differences appear larger than differences
on 7-point ordinal response items, when standardized
there is generally no difference between VAS and ordinal
ratings [12]. Similarly, VAS standard errors of measure-
ment are proportionally larger than those for rating scales
[12].
The present study was motivated by the need for a brief
validated measure for assessing onset of improvement in
the symptom of anxiety in subjects with GAD sooner
than one week, especially in light of the need to evaluate
newer fast-acting medications for the management of
anxiety. The Hamilton Rating Scale for Anxiety (HAM-A)
[13] is considered the "gold standard" and commonly
* Correspondence:
1
RTI Health Solutions, 3040 Cornwallis Road, Research Triangle Park NC 27707
USA
Full list of author information is available at the end of the article
Williams et al. Health and Quality of Life Outcomes 2010, 8:57
/>Page 2 of 8
used in clinical trials to assess response to anxiolytic
treatment in patients with GAD. However, three impor-
tant disadvantages of the HAM-A are that it is relatively
lengthy (14 items), it must be completed by a trained cli-
nician during the course of a clinical interview, and it has
not been validated for use sooner than one week. In the
context of GAD, treatment with fast-acting benzodiaz-
epines has been shown to be effective at one week when
measured by the HAM-A [14,15]; in the context of panic
disorder [16] and anticipatory anxiety [17,18], self-report
VASs and other measures have demonstrated efficacy
within hours. As there are no validated single-item scales
to assess onset of anxiety relief in patients with GAD, it
seemed important to us to validate a VAS assessing aver-
age anxiety (over the past 24 hours), which could be easily
incorporated into a daily diary. The present study
describes the psychometric evaluation of a patient-
reported VAS for the daily assessment of anxiety when
used in a clinical trial assessing pharmaceutical treat-
ments for GAD.
Methods
Preliminary Qualitative Study
As part of a preliminary qualitative study, cognitive inter-
views were conducted with 22 GAD patients (77.3%
female), ranging in age from 21 to 59, to better under-
stand the interpretation of the GA-VAS and the GA-VAS
response process from the patient perspective. Patients
were asked to think aloud while completing the GA-VAS
so that the interviewer could hear how it was interpreted
and how a response was selected.
Psychometric Study Design
After cognitive testing, the GA-VAS was included in a
clinical trial assessing two approved pharmaceutical
treatments for anxiety. Analyses were aimed at providing
evidence of the reliability, responsiveness, validity, and
utility of the GA-VAS.
Data were collected during a randomized, 4-week, dou-
ble-blind, multi-center, fixed-dose, placebo-controlled,
parallel-group clinical study conducted in the United
States. Lorazepam was selected as a fast-acting benzodi-
azepine, and paroxetine, a selective serotonin reuptake
inhibitor, was chosen as a slower-acting GAD pharmaco-
therapy. There were three treatment arms—lorazepam
(1.5 mg TID), paroxetine (20 mg QD), and placebo—and
three phases to the study: (1) a 1-week screening phase
(Days -7 to -1) during which eligibility was determined;
(2) a 4-week double-blind treatment phase (Day 1 or
baseline through Week 4); and (3) a 5-day double-blind
treatment phase (Week 5) during which therapy was
down-titrated. Patients completed the GA-VAS during
six clinic visits (screening, baseline, Weeks 1, 2, 4, and 5)
and at home each night during the screening week and
first week of treatment.
Participants
Otherwise healthy individuals, aged 18 to 65 with a pri-
mary diagnosis of GAD as determined by a structured
clinical interview, and a HAM-A total score ≥ 20 were eli-
gible for inclusion. To ensure prominence of anxiety
symptoms over depression symptoms, patients were
required to have a Covi Anxiety Scale [19] score ≥ 9 and a
Raskin Depression Scale [20] score ≤ 7. These psychiatric
rating scales have long been used in clinical trials and
have been shown to be valid tools for differentiating anx-
ious and depressed patient subgroups [21,22]. Subjects
were excluded from study participation if they had signif-
icant suicidal risk, had failed treatment with lorazepam or
paroxetine in the past, required daily benzodiazepine use
in the three months prior to study participation, or if they
had most other concurrent DSM-IV mental disorders,
including major depressive disorder, panic disorder with
or without agoraphobia, acute stress disorder, obsessive
compulsive disorder, dissociative disorder, posttraumatic
stress disorder, social anxiety disorder, anorexia, bulimia,
caffeine-induced anxiety disorder, alcohol or substance
abuse or dependence, premenstrual dysphoric disorder,
or antisocial or borderline personality disorder. Subjects
with current or past diagnoses of schizophrenia, psy-
chotic disorders, delirium, dementia, amnestic disorders,
clinically significant cognitive disorders, bipolar or
schizoaffective disorder, benzodiazepine abuse or depen-
dence, or factitious disorder were also excluded. Patients
were not permitted to use any psychotropic medications
and could not have initiated any psychodynamic or
behavioral psychotherapy for anxiety within the 3 months
prior to the study.
Instruments
General Anxiety - Visual Analog Scale
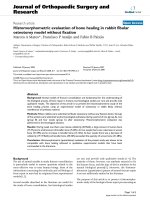
The 100 mm GA-VAS, shown in Figure 1 (not to scale),
was administered at all clinic visits and at home in a daily
diary format. The distance from the left edge of the line
to the mark placed by the patient is measured to the near-
est millimeter and used in analyses as the patient GA-
VAS score.
A number of additional measures were included in the
present psychometric evaluation study to help assess the
construct validity of the GA-VAS. Both the HAM-A [13]
and the Hospital Anxiety and Depression Scale (HADS)
[23,24] were completed during clinic visits. The HAM-A
is a clinician-reported measure of 14 items assessing both
psychic or cognitive (anxious mood, fears, intellectual
impairment, etc.) and somatic or physical symptoms of
anxiety (muscular complaints, cardiovascular symptoms,
gastrointestinal symptoms, etc.) on a 5-point severity
scale (0 = "Not present" to 4 = "Very severe"). The HADS
Williams et al. Health and Quality of Life Outcomes 2010, 8:57
/>Page 3 of 8
is a 14-item self-report measure designed to screen for
mood disorders in medically ill patients. Seven HADS
items assess anxiety and seven assess depression on a 0-
to-3 response scale; anxiety and depression are scored
separately. Like the GA-VAS, higher scores on the HAM-
A and HADS reflect greater severity.
Two self-report instruments gathered generic informa-
tion about patient quality-of-life, the 36-item Medical
Outcomes Study Short Form - 36 (SF-36) [25,26] and the
14-item General Activity subscale of the Quality of Life
Enjoyment and Satisfaction Questionnaire (QLES-Q)
[27]. For each item of the QLES-Q, the respondent uses a
5-point scale ranging from 1 = "Very poor" satisfaction to
5 = "Very good" satisfaction; higher scores indicate
greater quality-of-life and satisfaction. The SF-36 assesses
eight dimensions of health-related functioning and qual-
ity-of-life: Physical Functioning, Physical Role, Bodily
Pain, Social Functioning, General Mental Health, Emo-
tional Role, Vitality, and General Health Perceptions.
Each subscale is scored from 0 to 100, with higher scores
indicating better functioning and quality-of-life.
The Clinician Global Impression of Severity (CGIS)
[28] is a single-item rating that asks the clinician to evalu-
ate the severity of the patient's GAD symptoms on a 7-
point scale (1 = "Not at all ill" to 7 = "Among the most
extremely ill patients"): "Considering your total clinical
experience, how severe are the patient's symptoms now,
compared to your experience with other patients with the
same diagnosis?" The Clinician Global Impression of
Change (CGIC) and Patient Global Impression of Change
(PGIC) are two additional items that address change in
the severity of a patient's illness over a particular time
interval, in the present context "since the start of the
study." The CGIC, like the CGIS, is completed by the cli-
nician, whereas the PGIC is patient-reported. Both items
employ a 7-point response scale (1 = "Very Much
Improved" to 4 = "No Change" to 7 = "Very Much
Worse").
Statistical Methods
Reliability At-home test-retest reliabilities were com-
puted using stable patients whose HAM-A change scores
from screening to baseline (randomization) was 1 point
or less. Data from Day -6 were used as the initial or "test"
administration and Day -5 as the "retest" administration;
reliabilities were also calculated for Day -5 to -4, Day -4 to
-3, Day -3 to -2, and Day -2 to -1. Intraclass correlation
coefficients (ICCs) were computed using a two-way (sub-
jects × time) random effects analysis of variance
(ANOVA) model as recommended by Schuck [29] and
Shrout and Fleiss [30].
Responsiveness For utility in clinical trials, it is impor-
tant that the GA-VAS be capable of detecting change over
time, preferably at more than one time-point to under-
stand the onset and durability of the effect. Guyatt's
responsiveness statistic [31] is an effect size estimate rec-
ommended for use in the evaluation of responsiveness.
We calculated Guyatt's statistics at Weeks 1, 2, and 4 in
order to compare three different types of HAM-A
responders to non-responders. Initial responders were
defined as those patients who achieved ≥ 50% reduction
in HAM-A scores at Week 1, regardless of their
responder status at Weeks 2 and 4; partial responders
were patients who achieved ≥ 30% reduction in HAM-A
scores at Week 1 (again, regardless of responder status at
Weeks 2 and 4); sustained responders were patients who
achieved ≥ 30% reduction in HAM-A scores at Weeks 1
and 2, and ≥ 50% reduction in HAM-A scores at Week 4.
It was anticipated that Week 1 responsiveness statistics
comparing initial responders and non-responders would
be greater than responsiveness statistics comparing par-
tial responders and non-responders or sustained
responders and non-responders, with the responsiveness
statistics based on the latter two comparisons being very
similar at Week 1. To the extent that GAD symptoms
return at Weeks 2 and 4 in initial and partial responders,
it was expected that those responsiveness statistics would
become smaller in size. It was further expected that the
Guyatt's statistics involving sustained responders and
non-responders would maintain a high level of respon-
siveness over all three time-points.
Computing change as the difference between Day 1
(baseline) and Week 1 (or Week 2 or Week 4), we calcu-
lated Guyatt's responsiveness statistics [31] for the three
different responder definitions at three time-points:
Figure 1 The GA-VAS. Please complete this form at a regular time each day, preferably just before going to bed, and consider the whole of the pre-
vious 24-hour period.
Note how anxious (on average) you felt over the past 24 hours with a mark (|) on the line below.
Not at all Extremely
Anxious Anxious
Williams et al. Health and Quality of Life Outcomes 2010, 8:57
/>Page 4 of 8
The resulting value is a measure of the effect of treat-
ment on GAD symptoms. Cohen [32] provides a general
rule-of-thumb for the interpretation of such effect size
estimates: effect sizes of about 0.20 represent small
effects, those of about 0.50 represent moderate effects,
and those greater than about 0.80 represent large effects.
It is also important to demonstrate that the GA-VAS is
sensitive to differences between treatment groups. We
computed Cohen's [32] effect size estimate at Weeks 1, 2,
and 4 in order to compare each active treatment to pla-
cebo: (Mean
Treatment
- Mean
Placebo
)/SD
Pooled
Construct Validity Construct validity describes the rela-
tionships among multiple indicators of a construct and
the degree to which they follow predictable patterns [33].
Correlations between the GA-VAS and the HAM-A,
HADS, QLES-Q, SF-36, and CGIS were computed using
data collected during clinic visits at screening, baseline,
and Weeks 1, 2, and 4. It was expected that the GA-VAS
would correlate relatively highly with the other measures
of anxiety—the HAM-A, HADS-Anxiety, and CGIS. As
evidence for divergent validity, it was also anticipated that
the GA-VAS would correlate more highly with the
HADS-Anxiety score than with HADS-Depression and
also more highly with the QLES-Q and the mental func-
tioning subscales of the SF-36 (i.e., Emotional Role, Men-
tal Health, Social Function, Vitality) compared to the SF-
36 physical functioning subscales (i.e., Physical Function,
Physical Role, Bodily Pain, General Health).
Minimum Important Differences (MIDs) Another use-
ful property of an outcome measure is the MID or the
smallest change in a score from baseline that patients
perceive as beneficial and would be clinically significant.
Several methods have been proposed to assess clinically
meaningful change, for example, patient- and physician-
based global judgments and statistical criteria. One rela-
tively common approach is to examine the distribution of
change scores on a measure in conjunction with patients'
global ratings of change [34]. In the present analysis, both
PGIC and CGIC data were used as anchors to produce
MID estimates. A simple MID estimate is taken to be
roughly equivalent to the mean GA-VAS change of
patients who reported they were "Minimally Improved."
The standard error of measurement (SEM), as recom-
mended by Wyrwich et al. [35], for the GA-VAS was also
computed: where SD is the standard
deviation of the subscale score and r is the test-retest reli-
ability estimate. This is a distribution-based MID esti-
mate that also considers measurement precision and has
been shown to be relatively stable across populations
[36]. We also explored the use of a 0.5 standard deviation
(half-SD) unit change in the GA-VAS [37] as a final esti-
mate of MID.
Results
Preliminary Qualitative Study
The cognitive interviews conducted with GAD patients
showed that the GA-VAS was well understood and easily
completed by all interview participants. Subjects raised
no concerns about averaging anxiety levels over the last
24 hours. Overall, participants generally felt that the sin-
gle-item GA-VAS was useful and could adequately cap-
ture the overarching GAD construct.
Psychometric Study
A total of 167 GAD patients participated in the study; 97
(58.1%) were female and 122 (73.1%) were white. Table 1
summarizes patient characteristics by treatment group.
At screening, patients averaged 67.26 (SD = 16.1) on the
GA-VAS scale, and 62.61 (SD = 19.9) at baseline. Average
GA-VAS scores declined (i.e., improved) with treatment:
49.16 (SD = 23.8) at Week 1, 43.35 (SD = 25.0) at Week 2,
and 35.76 (SD = 24.8) at Week 4.
Reliability
The at-home GA-VAS test-retest stabilities were found to
be adequate for a single-item measure: Day -6 to -5, 0.59;
Day -5 to -4, 0.61; Day -4 to -3, 0.50; Day -3 to -2, 0.60;
and Day -2 to -1, 0.52.
Responsiveness
Table 2 presents the results of the responsiveness analy-
ses, which indicate highly satisfactory levels of respon-
siveness for the GA-VAS using all three responder
definitions for comparing responders vs. non-responders
ΧΧGA VAS
HAM A responders
GA VAS
HAM A nonresponders
SD GA V
-
-
-
-
-
()
−
()
AAS change
HAM A nonresponders-
⎡
⎣
⎢
⎢
⎢
⎤
⎦
⎥
⎥
⎥
SEM SD r=−1
Table 1: Patient characteristics (Intent-to-treat population)
Treatment Arm
Placebo
(n = 57)
Paroxetine
(n = 55)
Lorazepam
(n = 55)
Gender (n, %)
Male 26, 45.6% 24, 43.6% 20, 36.4%
Female 31, 54.4% 31, 56.4% 35, 63.6%
Race (n, %)
White 42, 73.7% 40, 72.7% 40, 72.7%
Black 3, 5.3% 3, 5.5% 3, 5.5%
Hispanic 9, 15.8% 6, 10.9% 8, 14.4%
Other 3, 5.3% 6, 10.9% 4, 7.2%
Age in years (mean, SD) 35.0, 10.4 34.7, 12.6 38.5, 12.1
Baseline HAM-A (mean, SD) 24.2, 5.0 23.4, 3.3 24.2, 3.5
Williams et al. Health and Quality of Life Outcomes 2010, 8:57
/>Page 5 of 8
across all time-points. The Guyatt's statistics are moder-
ate to large in magnitude—all statistics exceed 0.70. GA-
VAS responsiveness for initial responders diminished
from -1.13 at Week 1 to -0.71 at Week 2 and -0.79 at
Week 4, as expected. Responsiveness statistics based on
partial and sustained responders were smaller at Week 1
than that for initial responders; however, there was very
little attenuation of the responsiveness for either partial
responders or sustained responders over time.
The Cohen's effect size estimates for the treatment
group comparisons are somewhat smaller in size, but still
acceptable. While the Placebo vs. Lorazepam compari-
sons yield statistics with positive signs because Loraze-
pam reduces anxiety better than Placebo, the
comparisons involving Placebo and Paroxetine subjects
show that the groups are initially similar (-0.07 at Week
1), but by Week 2 Paroxetine subjects score lower (better)
on the GA-VAS than Placebo subjects (0.59).
Construct Validity
Correlations between the GA-VAS and other available
measures were computed using data collected during
clinic visits (screening, baseline, and Weeks 1, 2, and 4)
and are displayed in Table 3. The correlations are gener-
ally smaller at screening and baseline and increase at later
time-points with treatment. As anticipated, the GA-VAS
correlated highly with other measures of anxiety (the
HAM-A, HADS-Anxiety, and CGIS), demonstrating con-
vergent validity. With respect to divergent validity, it was
hypothesized that the GA-VAS would correlate more
highly with the HADS-Anxiety than with the HADS-
Depression; this was found to be true. As expected, the
GA-VAS correlated negatively with the QLES-Q and the
SF-36 subscales, indicating that greater anxiety was asso-
ciated with poorer functioning and quality of life. Also as
hypothesized, larger correlations were obtained between
the GA-VAS and the mental subscales of the SF-36 com-
pared to the physical subscales.
MIDs
The distributions of GA-VAS scores for each of the seven
PGIC response categories are presented in Table 4. A
simple MID estimate is taken to be roughly equivalent to
the mean GA-VAS change of the "Minimally Improved"
patients—in the PGIC analyses, approximately 13.5 to
15.5 GA-VAS points; using the CGIC, the MID estimate
is about 26.6 GA-VAS points. For comparative purposes,
the PGIC-based HAM-A MID was computed to be 7.40
and the CGIC-based HAM-A MID was computed to be
8.12. The half-SD GA-VAS MID estimates are slightly
smaller than the PGIC- and CGIC-based estimates: 9.96
at baseline, 11.9 at Week 1, 12.5 at Week 2, and 12.39 at
Week 4. The SEM-based MID estimate is 2.82, quite a bit
smaller than the other MID estimates. Overall, the GA-
VAS MIDs range in size from 2.8 to 26.6, but cluster
between 10 and 15. A preliminary workable MID value
for the GA-VAS is approximately 12 or 13 on the 100-
point GA-VAS scale.
Discussion
We have evaluated a patient-reported VAS for use in
assessing onset of improvement in anxiety symptoms in
subjects with GAD sooner than one week. The qualitative
results demonstrated that GAD patients had no difficul-
ties with the GA-VAS format or reporting average anxiety
levels over the last 24 hours, which has been shown to be
more reliable than asking for a rating at a specific point in
time [38].
A set of analyses was aimed at providing evidence of the
reliability, responsiveness, validity, and utility of the GA-
VAS. The GA-VAS demonstrated marginally adequate
test-retest stability. Based on similar reliability results
using other measures that were administered daily in this
study, it is likely that patients were not stable during the
screening period, but were experiencing small changes in
GAD symptoms which affected the reliability of the GA-
Table 2: Responsiveness of the GA-VAS at Weeks 1, 2, and 4 (In-clinic Visits)
Week 1 Week 2 Week 4
Guyatt's Responsiveness Statistics
Initial responder (n = 121) vs. Non-responder (n = 19) -1.13 -0.71 -0.79
Partial responder (n = 90) vs. Non-responder (n = 50) -0.92 -0.89 -0.86
Sustained responder (n = 79) vs. Non-responder (n = 32) -0.91 -0.89 -0.80
Cohen's Effect Size Estimates
Placebo (n = 54) vs. Lorazepam (n = 46) 0.42 0.49 0.29
Placebo (n = 54) vs. Paroxetine (n = 48) -0.07 0.59 0.67
Note: Initial responders achieved ≥ 50% reduction in HAM-A scores at Week 1 (regardless of responder status at Weeks 2 and 4); partial
responders achieved ≥ 30% reduction in HAM-A scores at Week 1 (regardless of responder status at Weeks 2 and 4); sustained responders
achieved ≥ 30% reduction in HAM-A scores at Weeks 1 and 2, and ≥ 50% reduction in HAM-A scores at Week 4. Initial, partial, and sustained
responder categories were not mutually exclusive.
Williams et al. Health and Quality of Life Outcomes 2010, 8:57
/>Page 6 of 8
VAS. The present reliabilities were somewhat lower than
what has been reported for other domains and outcomes,
such as pain [39,40]. However, it is difficult to compare
these reliabilities to findings for other patient-reported
VASs because other VASs use different time intervals
(e.g., 5 minutes, one week), experiential dimensions (e.g.,
current pain, average pain, worst pain), and different sta-
tistical methods (e.g., Pearson correlations).
Three different definitions of responder were used in
this analysis, all based on changes in the clinician-rated
HAM-A. All Guyatt's statistics show the GA-VAS to be
highly responsive—changes in GA-VAS scores at Weeks
1, 2, and 4 in subjects classified as responders exceeded
changes of non-responders. The comparison of initial
responders vs. non-responders at Week 1 produced the
largest responsiveness statistic, but responsiveness for
these initial responders declined at Weeks 2 and 4, while
responsiveness for partial responders and sustained
responders remained relatively steady over time. The
Cohen's effect size estimates were mostly moderate in
size, but corroborate the responsiveness of the GA-VAS.
Validity correlations between the GA-VAS and other
available measures were highly satisfactory. Specifically,
the GA-VAS obtained relatively high correlations with
the HAM-A, HADS-Anxiety, and the mental subscales of
the SF-36, and lower correlations with the HADS-
Depression and the physical subscales of the SF-36. At
Weeks 1, 2, and 4, all observed correlations fit the
hypothesized pattern of relationships, except that the
correlations between the GA-VAS and HADS-Depres-
sion scores were possibly greater than expected.
As noted, the correlations between the GA-VAS and
other measures are smaller at screening and baseline and
increase at later time-points with treatment (Table 3).
This is particularly true for the psychological measures
(HAM-A, HADS-Anxiety, HADS-Depression, and CGIS)
and psychosocial functional status measures (QLES-Q
and SF-36 Emotional Role, Mental Health, Social Func-
Table 3: Correlations Between the GA-VAS and Other In-Clinic Measures
Screening Baseline Week 1 Week 2 Week 4
HAM-A 0.31 0.31 0.53 0.61 0.60
HADS - Anxiety 0.47 0.40 0.63 0.74
HADS - Depression 0.26 0.26 0.44 0.63
CGIS 0.27 0.26 0.49 0.63
QLES-Q -0.31 -0.45 -0.55 -0.54
SF-36 Emotional Role -0.28 -0.45 -0.54
SF-36 Mental Health -0.32 -0.57 -0.68
SF-36 Vitality -0.27 -0.34 -0.49
SF-36 Social Function -0.22 -0.40 -0.48
SF-36 General Health -0.30 -0.30 -0.31
SF-36 Physical Function -0.19 -0.21 -0.24
SF-36 Physical Role -0.15 -0.23 -0.31
SF-36 Bodily Pain -0.24 -0.16 -0.26
Table 4: MIDs - Distribution of Mean Change Scores for the GA-VAS
PGIC - Mean Change at Week 1
(In-clinic)
PGIC - Mean Change at Week 4
(In-clinic)
CGIC - Mean Change at Week 4
(In-clinic)
1 = "Very Much Improved" 38.50 n = 6 45.63 n = 16 41.78 n = 18
2 = "Much Improved" 28.97 n = 29 34.57 n = 44 30.55 n = 31
3 = "Minimally Improved"
13.45 n = 58 15.54 n = 35 26.61 n = 43
4 = "No Change" 1.56 n = 36 5.00 n = 12 4.58 n = 19
5 = "Minimally Worse" 2.00 n = 9 9.67 n = 3 47.00 n = 1
6 = "Much Worse" 6.25 n = 4 28.50 n = 4 n = 0
7 = "Very Much Worse" n = 0 n = 0 n = 0
Williams et al. Health and Quality of Life Outcomes 2010, 8:57
/>Page 7 of 8
tion, Vitality). This is probably due to the increasing vari-
ability in both the GA-VAS and these other
measures—those patients who responded to treatment
achieved better scores on measures of anxiety and psy-
chosocial functioning, which increased the overall vari-
ability in these measures and reduced the relatively
restricted range present at screening and baseline.
For exploratory purposes, three different MID esti-
mates were computed, and the results vary across meth-
ods but seem plausible. Inconsistencies among MID
estimates computed using multiple methods is to be
expected [41,42], and PGIC- and CGIC-based MIDs are
not necessarily expected to be consistent because the cli-
nician perspective naturally differs somewhat from that
of the patient. The results point toward a preliminary
MID value of approximately 12 or 13 points on the 100-
point GA-VAS scale.
The present findings are preliminary and the psycho-
metric characteristics of the GA-VAS should be con-
firmed in future studies. This analysis was conducted as
part of a rigorously controlled clinical trial and the results
are applicable in a clinical trial setting—how the GA-VAS
will perform in other settings is unknown. Furthermore,
the present results are based on limited psychopharma-
cological agents, and exclude comparisons with impor-
tant cognitive-behavioral interventions and alternative
therapies.
Conclusions
The present study demonstrates the reliability, validity,
and responsiveness of the GA-VAS measure in the con-
text of daily administration in diary format, as well as in-
clinic administration. The GA-VAS successfully mini-
mizes patient burden while capturing early onset of med-
ication action and symptom relief. With these advantages
in mind, we recommend use of the GA-VAS in future
research studies and clinical trials for the evaluation of
fast-acting drug therapies for the treatment of GAD.
Competing interests
VSLW and RJM declare that they have no competing interests. DF is an
employee of Pfizer Inc.
Authors' contributions
VSLW conducted the psychometric analyses and drafted major portions of the
manuscript. RJM and DF conceived of the study and participated in its design
and analysis, and drafted major portions of the manuscript. All authors read
and approved the final manuscript.
Acknowledgements
We thank Cheryl Coon of RTI Health Solutions, who provided technical assis-
tance in conducting some psychometric analyses.
Pfizer Inc. funded the data collection and analysis for this study, and the writing
of the manuscript, but did not influence decisions regarding interpretation or
manuscript submission.
Author Details
1
RTI Health Solutions, 3040 Cornwallis Road, Research Triangle Park NC 27707
USA,
2
Innovus, 12125 Technology Drive, Eden Prairie, MN 55344 USA and
3
Pfizer Inc., Eastern Point Road, Mailstop 8220-4301, Groton CT 06340 USA
References
1. Bruera E, Kuehn N, Miller MJ, Selmser P, Macmillan K: The Edmonton
Symptom Assessment System (ESAS): a simple method for the
assessment of palliative care patients. Palliat Care 1991, 7:6-9.
2. Kremer E, Atkinson JH, Ignelzi RJ: Measurement of pain: patient
preference does not confound pain measurement. Pain 1981,
10:241-248.
3. Scott J, Huskisson EC: Graphic representation of pain. Pain 1976,
2(2):175-184.
4. deBoer AGEM, van Lanschot JJB, Stalmeier PFM, van Sandick JW, Hulscher
JBF, de Haes JCJM, Sprangers MAG: Is a single-item visual analogue scale
as valid, reliable and responsive as multi-item scales in measuring
quality of life? Qual Life Res 2004, 13:311-320.
5. Hyland ME, Sodergren SC: Development of a new type of global quality
of life scale, and comparison of performance and preference for 12
global scales. Qual Life Res 1996, 5:469-480.
6. Lingjaerde O, Foreland AR: Direct assessment of improvement in winter
depression with a visual analogue scale: high reliability and validity.
Psychiatry Res 1998, 81:387-392.
7. Mortimore C, Anderson IM: d-Fenfluramine in panic disorder: a dual role
for 5-hydroxytryptamine. Psychopharmacology 2000, 149:251-258.
8. Steiner M, Streiner DL: Validation of a revised visual analogue scale for
premenstrual mood symptoms: results from prospective and
retrospective trials. Can J Psychiatry 2005, 50(6):327-332.
9. Revill SI, Robinson JO, Rosen M, Hogg MI: The reliability of linear
analogue scales for evaluating pain. Anaesthesia 1976, 31(9):1191-1198.
10. Wewers ME, Lowe NK: A critical review of visual analogue scales in the
measurement of clinical phenomena. Res Nurs Health 1990,
13(4):227-236.
11. Dixon JS, Bird HA: Reproducibility along a 10 cm vertical visual
analogue scale. Ann Rheum Dis 1981, 40(1):87-89.
12. Guyatt GH, Townsend M, Berman LB, Keller JL: A comparison of Likert
and visual analogue scales for measuring change in function. J Chronic
Diseases 1987, 40(12):1129-1133.
13. Hamilton M: The assessment of anxiety states by rating. British J Medical
Psychology 1959, 32:50-55.
14. Pande AC, Crockatt JG, Feltner DE, Janney CA, Smith WT, Weisler R,
Londborg PR, Bielski RJ, Zimbroff DL, Davidson JRT, Liu-Dumaw M:
Pregablalin in generalized anxiety disorder: a placebo-controlled trial.
Am J Psychiatry 2003, 160:533-540.
15. Rickels K, Rynn M: Pharmacotherapy of generalized anxiety disorder. J
Clin Psychiatry 2002, 63(Suppl 14):9-16.
16. Nardi AE, Valenca AM, Nascimento I, Mezzasalma MA, Zin WA: Double-
blind acute clonazepam vs. placebo in carbon dioxide-induced panic
attacks. Psychiatry Res 2000, 94:179-184.
17. Graham SJ, Scaife JC, Langley RW, Bradshaw CM, Szabadi E, Xi L, Crumley
T, Calder N, Gottesdiener K, Wagner J: Effects of lorazepam on fear-
potentiated startle responses in man. J Psychopharmacol 2005,
19(3):249-258.
18. Wolf DL, Desjardins PJ, Black PM, Francom SR, Mohanlal RW, Fleishaker JC:
Anticipatory anxiety in moderately to highly-anxious oral surgery
patients as a screening model for anxiolytics: evaluation of alprazolam.
J Clin Psychopharmacol 2003, 23(1):51-57.
19. Covi L, Lipman R, McNair DM, Czerlinsky T: Symptomatic volunteers in
multicenter drug trials. Prog Neuropsychopharmacol Biol Psychiatry 1979,
3:521-533.
20. Raskin A, Schulterbrandt JG, Reatig N, McKeon JJ: Differential response to
chlorpromazine, imipramine and placebo. A study of subgroups of
depressed patients. Arch Gen Psychiatry 1970, 23:164-173.
21. Bennie EH, Mullin JM, Martindale JJ: A double-blind multicenter trial
comparing sertraline and fluoxetine in outpatients with major
depression. J Clin Psychiatry 1995, 56(6):229-237.
22. Lipman RS: Differentiating anxiety and depression in anxiety disorders:
use of rating scales. Psychopharmacol Bull 1982, 18(4):69-77.
23. Snaith RP, Zigmond AS: The Hospital Anxiety and Depression Scale
Manual. Windsor, England: Nfer-Nelson; 1994.
24. Zigmond AS, Snaith RP: The Hospital Anxiety and Depression Scale.
Acta Psychiatr Scand 1983, 67:361-370.
Received: 20 August 2009 Accepted: 8 June 2010
Published: 8 June 2010
This article is available from: 2010 Williams et al; licensee BioMed Central Ltd. This is an Open Access article distributed under the terms of the Creative Commons Attribution License ( which permits unrestricted use, distribution, and reproduction in any medium, provided the original work is properly cited.Health and Qu ality of Life Out comes 2010, 8:57
Williams et al. Health and Quality of Life Outcomes 2010, 8:57
/>Page 8 of 8
25. Ware JE, Sherbourne CD: The MOS 36-item short-form health survey
(SF-36). I. Conceptual framework and item selection. Med Care 1992,
30:473-483.
26. Ware JE, Snow KK, Kosinski M: SF-36 Health Survey: Manual and
interpretation guide. Lincoln RI: QualityMetric Incorporated; 2000.
27. Endicott J, Nee J, Harrison W, Blumenthal R: Quality of Life Enjoyment
and Satisfaction Questionnaire: a new measure. Psychopharmacol Bull
1993, 29:321-326.
28. Guy W: ECDEU assessment manual for psychopharmacology (US
Department of Health, Education, and Welfare Publication No. 76-338).
Rockville MD: National Institute of Mental Health; 1976.
29. Schuck P: Assessing reproducibility for interval data in health-related
quality of life questionnaires: which coefficient should be used? Qual
Life Res 2004, 13:571-586.
30. Shrout PE, Fleiss J: Intraclass correlations: uses in assessing rater
reliability. Psychol Bull 1979, 86:420-428.
31. Guyatt GH, Walter SD, Norman G: Measuring change over time:
assessing the usefulness of evaluative instruments. J Chronic Diseases
1987, 40:171-178.
32. Cohen J: Statistical power analysis for the behavioral sciences. Hillsdale
NJ: Lawrence Erlbaum; 1988.
33. Messick S: Validity. In Educational measurement 3rd edition. New York:
American Council on Education, Macmillan Publishing Co :1989.
34. Jaeschke R, Singer J, Guyatt GH: Measurement of health status:
ascertaining the minimal clinically important difference. Controlled Clin
Trials 1989, 10:407-415.
35. Wyrwich KW, Tierney WM, Wolinsky FD: Further evidence supporting an
SEM-based criterion for identifying meaningful intra-individual
changes in health-related quality of life. J Clin Epidemiol 1999,
52:861-873.
36. Crosby RD, Kolotkin RL, Williams GR: Defining clinically meaningful
change in health-related quality of life. J Clin Epidemiol 2003,
56:395-407.
37. Norman GR, Sloan JA, Wyrwich KW: Interpretation of changes in health-
related quality-of-life: the remarkable universality of half a standard
deviation. Med Care 2003, 41:582-592.
38. Scrimshaw SV, Maher C: Responsiveness of visual analogue and McGill
pain scale measures. J Manipulative Physiol Ther 2001, 24:501-504.
39. Chang VT, Hwang SS, Feuerman M: Validation of the Edmonton
Symptom Assessment Scale. Cancer 2000, 88:2164-2171.
40. Love A, Leboeuf C, Crisp TC: Chiropractic chronic low back pain sufferers
and self-report assessment methods: I. A reliability study of the visual
analogue scale, the pain drawing, and the McGill Pain Questionnaire. J
Manipulative Physiol Ther 1989, 12:21-25.
41. US Department of Health and Human Services, Food and Drug
Administration: Guidance for industry: Patient-reported outcome
measures Use in medical product development to support labeling
claims. In Draft guidance released for comment on February 3, 2006
Washington, DC: US Department of Health and Human Services; 2006.
42. Dubois D, Gilet H, Viala-Danten M, Tack J: Psychometric performance and
clinical meaningfulness of the Patient Assessment of Constipation -
Quality of Life questionnaire in prucalopride (RESOLOR
®
) trials for
chronic constipation. Neurogastroenterol Motil 2009.
doi: 10.1186/1477-7525-8-57
Cite this article as: Williams et al., Psychometric evaluation of a visual analog
scale for the assessment of anxiety Health and Quality of Life Outcomes 2010,
8:57