báo cáo hóa học:" Responsiveness of the Eating Disorders Quality of Life Scale (EDQLS) in a longitudinal multi-site sample" doc
Bạn đang xem bản rút gọn của tài liệu. Xem và tải ngay bản đầy đủ của tài liệu tại đây (421.45 KB, 11 trang )
RESEARC H Open Access
Responsiveness of the Eating Disorders Quality of
Life Scale (EDQLS) in a longitudinal multi-site
sample
Carol E Adair
1*
, Gisele C Marcoux
1,2
, Theanna F Bischoff
3
, Brian S Cram
1,2
, Carol J Ewashen
4
, Jorge Pinzon
2
,
Joanne L Gusella
6
, Josie Geller
5,7
, Yvette Scattolon
8
, Patricia Fergusson
9
, Lisa Styles
10
, Krista E Brown
11
Abstract
Background: In eating disorders (EDs), treatment outcome measurement has traditionally focused on symptom
reduction rather than functioning or quality of life (QoL). The Eating Disorders Quality of Life Scale (EDQLS) was
recently developed to allow for measurement of broader outcomes. We examined responsiveness of the EDQLS in
a longitudinal multi-site study.
Methods: The EDQLS and comparator generic QoL scales were collected in person at baseline, and 3 and 6
months from 130 participants (mean age 25.6 years; range 14-60) in 12 treatment programs in four Canadian
provinces. Total score differences across the time points and responsiveness were examined using both anchor-
and distribution-based methods.
Results: 98 (75%) and 85 (65%) responses were received at 3 and 6 months respectively. No statistically significant
differences were found between the baseline sample and those lost to follow-up on any measured characteristic.
Mean EDQLS total scores increased from 110 (SD = 24) to 124.5 (SD = 29) at 3 months and 129 (SD = 28) at 6
months, and the difference by time was tested using a general line ar model (GLM) to account for repeated
measurement (p < .001). Responsiveness was good overall (Cohen’s d = .61 and .80), and confirmed using anchor
methods across 5 levels of self-reported improvement in health status (p < .001). Effect sizes across time were
moderate or large for for all age groups. Internal consistency (Chronbach’s alpha=.96) held across measurement
points and patterns of responsiveness held across subscales. EDQLS responsiveness exceeded that of the Quality of
Life Inventory, the Short Form-12 (mental and physical subscales) and was similar to the 16-dimension quality of
life scale.
Conclusions: The EDQLS is responsive to change in geographically diverse and clinically heterogeneous programs
over a relatively short time period in adolescents and adults. It shows promise as an outcome measure for both
research and clinical practice.
Background
Eating disorders (EDs) are serious health problems that
adversely impact quality of life in adolescence and
young adulthood; a critical time for individuation and
establishing independence across several life domains
including initiation o f careers [1-3]. Unhealthy eating
attitudes and dieting behavio rs that elevate risk for EDs
are found in nearly 30% of girls aged 10 to18 years and
increases in concern with weight over time have been
documented for both boys and girls aged 9 to 14 [4-6].
These trends imply that EDs will continue to be a sig-
nificant health concern for the foreseeable future.
If not treated early and effectively, EDs can become
chronic, and place enormous burden on the patient and
his or her family [7]. Demand for treatment services is
growing, along with an urgency to ground new treat-
ments in evidence [8,9]. Treatment outcome measure-
ment in EDs has traditionally focused on changing
* Correspondence:
1
Departments of Community Health Sciences and Psychiatry, Faculty of
Medicine, University of Calgary, 1215 - 39 Ave, SW, Calgary, AB, T2T 2K6,
Canada
Full list of author information is available at the end of the article
Adair et al. Health and Quality of Life Outcomes 2010, 8:83
/>© 2010 Adair et al; licensee BioMed Central Ltd. This is an Open Access article distributed under the terms of the Creative Commons
Attribution License ( which permits unrestricted use, distribution, and repro duct ion in
any medium, pro vided the original work is properly cited.
behavior and symptoms (e.g., reducing purging or
restoring a healthy body weight) rather than on broader
areas such as role functioning or quality of life, and ED
experts have been calling for more holistic approaches
to treatment and for broader treatment outcome mea-
surement for more than a decade [10-12]. For example,
Miller [11] characterized the traditional approach to
EDs treatment outcomes measurement as “too simpli stic
and narrow in scope,” (p. 745) and Treasure [13] wrote
that “to focus merely on symptomatic relief from ‘not
eating’ , as occurs with some f orms of hospital care, is
primitive,” (p. 212). In this paper, we describe a study to
establish responsiveness in a new disease-specific quality
of life (QoL) measure for EDs that taps these broader
outcomes.
While broader outcomes have been measured in some
research samples of ED patients using generic quality of
life (QoL) instruments, including the Short-Form-36
(SF-36), the Nottingham Health Profile (NHP) and the
World Health Organization Quality of Life Instrument -
Brief Version (WHO QoL-Bref) [2], they have several
limitations. Some domains and items on generic QoL
instruments may be insensitive for some diagnoses [14],
and responsiveness may be inadequate for evaluative
purposes [15-17]. In addition, wording and interpreta-
tion problems with the SF-36 have been found for some
patient groups including EDs [14,18,19]. QoL measure-
men t in practice has been limited by a lack of availabil-
ity of specific QoL measures for the EDs field, and as a
result, many calls for a specific, relevant and responsive
QoL m easure have been made in the past dec ade
[2,20-24]. In response to these identified issues, four
new disease-specific instruments for EDs, including th e
subject of the current paper - the Eating Disorders
Quality of Life Scale (EDQLS), were reported in the past
three years [20,21,23,24]. An article describing an instru-
ment to measure impairment resulting from ED psycho-
pathology has also been recently published, but, as
described, neither the important conceptual distinctions
between impairment and quality of life; nor the com-
plexity of causal pathways between symptoms and beha-
vioural manifestation in the illness, are recognized [25].
Two of the se instruments were tested in an age range
that included adolescents, but adolescent-specific design
methods (e.g., testing relevance of content and appropri-
ateness of language) are reporte d only for the EDQLS
[24].
The EDQLS was designed for an evaluative purpose,
(i.e., to measure change over time within individuals)
[17], such as for the assess ment of p atients’ treatment
progress and the outcomes of new treatments [11].
Given this, responsiveness is the psychometric charac-
teristic of primary importance. According to Revicki
[26], responsiveness refers to “ the extent to which a
measure accurately reflects change in a patient’scondi-
tion,” (p. 890).
Only one of the recently developed disease-specific
QoL instruments for EDs has published findings on
responsiveness [27]. The authors used distribution and
anchor-based methods to examine responsiveness and
found effect sizes around .30 (varying by subscale) for
patients from three treatm ent programs in one city who
reported improvement at one point of follow-up (12
months). These results are encouraging in suggesting
that measured QoL can improve over time with treat-
ment for EDs. However, this instrument (by Las Hayas
and colleagues) emphasizes symptomatic aspects of the
illness, which might be more likely to change with treat-
ment than broader life domains [27]. It is also critical to
ensure that instruments such as the EDQLS, that tap
broader life domains such as leisure and relationships,
are also responsive to treatment, especially when used
to evaluate treatments targeted to broader outcomes. In
addition, Las Hayas and colleagues did not report the
use of design processes to ensure appropriateness to
adolescents , so responsive ness in an instrument such as
the EDQLS with this feature was warranted. The pur-
pose of the current study was to examine responsiveness
in an instrument designed to be appropriate a cross the
full range of patient ages and which taps broad domains
of QoL, across three time points for patients, including
adolescents, in active treatment across multiple geogra-
phically diverse treatment programs.
Methods
The Longitudinal Sample
165 females and six males aged 14 years or older with
a clinically confirmed d iagnosis (anorexia nervosa, buli-
mia nervosa or eating disorders not otherwise speci-
fied) participated in the multi-site study. They came
from 12 Canadian EDs treatment programs (two in
Nova Scotia, three in Manitoba, five in British Colum-
bia, and two in Alberta) providing any of inpatient,
outpatient, day treatment and/or consultation to ado-
lescent or adult patients. Approaches to treatment in
these programs varied widely from inpatient medical
weight restoration through individual, group or family
psychotherapy based on several current therapeutic
models, and supplementary therapies such as meal pre-
paration/nutrition skill-building and recreational
approaches. The intensity of current treatments and
the structure of the treatment tea m also varied consid-
erably. Patients were included if they had been in
treatment at least two weeks and at the time of base-
line measurement were at variable stages of treatment.
Participants were recruited through presentations by
the research assistant in group therapy sessions, and
by individual clinician referrals.
Adair et al. Health and Quality of Life Outcomes 2010, 8:83
/>Page 2 of 11
The Eating Disorders Quality of Life Scale
The EDQLS is based on the World Health Organiza-
tion’s definition of QoL [28] and its development was
guided by published standards [26,29-33]. Content was
selected to capture broad aspects of life affected by EDs
and their treatment (i.e., health-related QoL), b ut over-
lap in content with instruments that measure ED symp-
toms and behaviors alone was avoided. Example items
from the final 40-item EDQLS are “Ihavealotofrules
about food” (health related to food and weight domain
(also called t he eating domain) and “I feel connected to
others” (relationships with others domain). The 12
domains or subscales are cognitive, education/vocation,
family and close relationships, relationships with others,
future outlook, appearance, le isure, psychological, emo-
tional, values and beliefs, physical, and eating. Each
doma in has three items, except for the health related to
food and weight/eating domain, which has six items
plus an extra item that is similarly worded with one in
the cognitive domain that was designed to be used as an
internal validity check. T he minimum and maximum
scores are 40 and 200 respectively. The EDQLS was
developed and validated for ages as young as 1 4, and is
currently being tested in youth ages nine to 13 years.
Recent work using cognitive interviewing [34-36]
resulted in refinements to six items. The results
reported herein relate to the first version.
A single global QoL rating: “ Please rate your overall
quality of life in the last week on a scale of 1 to 10,
where 1 is Poor and 10 is Excellent“ is included in a
separate part of the questionnaire booklet to allow for
overall construct validity assessment as recommended
by Fayer s and Fayers (2000) [31]. In an additional sepa-
rate section of the questionnaire booklet, the 12 QoL
dom ains are listed, and respondents are able to rate the
importance of each (on a five-point scale), as well as up
to two additional self-nominated domains. The impor-
tance ratings are not used to weight the total domain
scores derived from the core 40 items, as per current
recommendations [37], but they provide an opportunity
for the patient and clinician to consider and address
uniqueQoLissuesandgoalsasanadjuncttothestan-
dard scores.
The total mean score on the initial validation sample
(pilot and longitudinal sample at baseline - N = 171)
was 110 out of a total of 200 (SD = 24.1) with higher
scores indicating better QoL. Since patients were at
varying stages of treatment, the baseline sco res simply
represent the first score for each participant. The
EDQLS showed excellent internal consistency overall
(Cronbach’s alpha = .96) and for most subscales. Criter-
ion validity (both convergent and divergent) was estab-
lished in that sample using comparisons with the
Quality of Life Inventory (Qoli) [38], Short-Form-12
(SF-12) [39], and a generic sixteen-dimensional health-
related measure for youth (the 16D) [40]. Known groups
validity was also demonstrated on the baseline sample,
and construct validity was examined using principal
components analysis and exploratory item response the-
ory analysis. Full details on the development and initial
validation of the EDQLS are available elsewhere [24].
Validation measures and other variables
The three comparator instruments n oted above - the
SF-12, the QoLI and the 16D - were used to assess
responsiveness across instruments for the longitudinal
sample. The SF-12 is a brief version of the SF-36, an
extensively tested and validated health status instrument
used in many patient populations to measure health-
related functioning and frequently used as an indicator
of QoL [39]. Its 12 items address activities such as play-
ing golf and climbing stairs, as well as limitations in per-
forming physical tasks, and in working or socializing due
to physical and e motional problems or pain. T his mea-
sure also provides summary scores for both mental and
physical health status [39]. The QoLI is a generic QoL
lifeinstrument[38].Ithas32itemsthataddress16
areas of life (health, self-esteem, goals and values,
money, work, play, learning, creativity, helping, love,
friends, children, relatives, home, neighborhood and
community), and both importance and satisfaction rat-
ings for each. It has been validated in several clinical
and non-clinical populations and has good internal con-
sistency (values ranging from .77 to .89) [38]. The 16D
is also a generic QoL measure. However, it is designed
specifically for youth aged 12 to 15 [40]. It covers 16
dimensions (mobility, vision, hearing, breathing, sleep-
ing, eating, elimination, speech, mental function, dis-
comfort and symptoms, school and hobbies, friends,
physical appearance, depression, distress and vitality)
with a single item for each dimension. It has good test-
retest reliability and known group validity [40]. The 16D
was selected for the current study to assess the appro-
priateness of the EDQLS in a sam ple that included a
large proportion of adolescents (approximately one-third
were under age 18 and approximately three-quarters
were under age 29 at baseline). Two other standardize d
instruments were administered at baseline to measure
general psychiatric symptom severity and ED symptom
severity - the Brief Symptom Inventory (BSI) [41] and
the Eating Disorders Inventory 2 (EDI-2) [42]. The BSI
assesses psychiatric symptoms with 53 it ems in nine
domains including somatization, obses sion-compuls ion,
interpersonal sensitivity, depression, anxiety, hostility,
phobi c anxiety, paranoid ideation and psychoticism, and
provides an overall score indicative of intensity of symp-
toms. The E DI-2 has 64 items in eight subscales reflect-
ing eating disorders psychopathology/symptomology:
Adair et al. Health and Quality of Life Outcomes 2010, 8:83
/>Page 3 of 11
drive for thinness, bulimia, body dissatisfaction, ineffec-
tiveness, perfectionism, interpersonal distrust, interocep-
tive awareness, and maturity fears. Subscale scores and a
total score are available. In this study, raw scores were
used as a simple continuous variable indicator of ED
symptom severity, because cut-offs for clinical signifi-
cance were not provided, and individual clinical compar-
isons were not needed.
Other variables of interest including age, gender, diag-
nosis, psychiatric and medical comorbidity, prior treat-
ment, age at f irst symptoms, eating disorder duration,
and c urrent program treatment duration were collected
from the health record at baseline using a standard, pre-
tested abstraction form. At three and six month data
collection points, respondents were also asked to rate
their overall health status on a five-point scale: ‘much
worse’ , ‘ worse’ , ‘same’ , ‘better’ or ‘ much better’.They
also provided supplementary information on whether
they had completed or withdrawn from treatment,
attributed their current status to their treatment, and
whether anything other than treatment had happened
that impacted their current status. The original instru-
men t battery underwent review by clinical collaborators
at the sites, as well as pre-testing with eight adolescents/
young adults (aged 13 to 31) to assess burden, compre-
hension, and completion time.
Data collection and management
All data were collected in person at baseline with assis-
tance as needed, and by mail three and six months later.
The follow-up protocol, based on the Dillman total
design method for mailed surveys [43], included remin-
der letters at one week from the initial mailing, and a
full study package re-mailed at three weeks, followed by
phone calls to non-respondents. A final written appeal
was sent to non-respondents approximately 8 to 10
weeks later. Study data were entered to an SPSS data-
base. Error rates were measured on a 10% random sam-
ple, and confirmed to be less than 1% (mean .58%
across time points). Missing data were minimal, and
handled using standard decision-rules (e.g., inserting
subscale means) and dual-rater agreement on items
requiring judgment (such as response corrections).
Analysis
There is currently no agreement on the optimal
approach to responsiveness analysis [15,44-48]. There-
fore, we calculated several indices of responsiveness and
used both d istribution- and anchor-based approaches.
First, line and boxplots of EDQLS individual, mean total
scores and subscale scores were inspected across time
points. Sample differences were tested using Student’st-
tests for mean dif ferences, Pearson’ s chi-squared tests
and (for diagnosis due to small cell frequencies) Fisher’s
exact test. Responsiveness was examined fir st using dis-
tribution-based approaches and calculated as Cohen ’ sd,
total score change, percent change and the standardized
reponse mean across time periods. Next, mean score
diff erences by time period were tested for statistical sig-
nificance using a general linear model (GLM) that
accounts for repeated measurement for participants with
data across all time points; no other variables were
included in this model because of the relatively small
sample size. Responsiveness was also examined using an
anchor-b ased approach, in which the magnitude change
in total scores from baseline to the three-month time
point was examined across five levels of self-reported
change using a one-way ANOVA. Finally, effect sizes
and standardized response means (based on absolute
score changes) were calculated across time points for
the EDQLS to tal score, for subscale scores, by age
group, and for scores on the three comparator i nstru-
ments.Allanalyseswerebasedontheentiresample
(versus comparision to a treatment as usual or untreated
sample) because all participants were in active treatment
at enrolment. The study was reviewed and approved by
the Conjoint Health Research Ethics Board at the Uni-
versity of Calgary, and the respective committees for
each jurisdiction.
Results
Sample Description
The initial 41 participants were a pilot sample for which
consent had not been collected for follow-up; thus, 130
participants formed the longitudinal sample. 98 (75%)
and 85 (65%) responses were received at three and six
months respectively. Table 1 details patient characteris-
tics for the baseline, three and six month samples, and
the 45 participants lost to follow-up at six months. No
differences were found on age, gender, diagnosis, eating
disorders or psychiatric symptom severity, comorbidity,
age at first symptoms, illness duration, previous treat-
ment or time in treatment between the initial sample
and those lost to follow-up at 6 months, although there
may have been insufficient power for the detection of
differences of the magnitude seen here, especially for
variables with many categories. For example, the sample
of those lost at six months seemed to include more par-
ticipants with a diagnosis of bulimia and more of those
who had had previous treatment. BSI and EDI-2 severity
scores also appeared to be higher among those lost, yet
smaller proportions had documented psychiatric and
medical comorbidities.
The sample included participants at a full ran ge of
stages of treatment. At baseline, 14 (17%) had been in
treatment for two months or less, 28 (34.1%) for two to
Adair et al. Health and Quality of Life Outcomes 2010, 8:83
/>Page 4 of 11
six months; six (7.3%) for six to 12 months; 12 (14.6%)
for seven to 12 months; 10 (12.2%) for 13 to 24 months
and 12 (14.6%) for longer than 24 months (one missing).
Treatment status at the six-month point was reported
by 76 respondents. Among those, 30 (39%) reported still
being active in the same program, six (8%) active in
another program, 16 ( 21%) had been discharged from
the original program and were being followed by a
family physician/GP,15 (19.7%) reported having com-
pleted all treatment, and nine (12%) withdrew. The
majority of those who withdrew left for lifestyle reas ons
(e.g., moved or got a full-time job); only three (4%)
reported that they were not benefiting from services or
were otherwise unhappy with services. Overall, 67 (88%)
responded positively when asked whether treatment for
the ED had made their health better.
Responsiveness According to Distribution-Based
Approaches
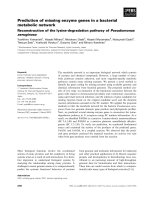
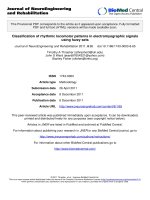
Total mean scores on the EDQLS increased from 110
(SD=24)to124.5(SD=29)atthreemonthsand129
(SD = 28) at six months. These score differences were sta-
tistically significant (p < .001) using GLM to account for
repeated measurement (Figure 1). Even though, on aver-
age, QoL scores increase d, the patterns of change were
highly individual. The largest increase was seen from base-
line to three months, with a smaller gain from three to six
months. Internal consistency of the total score was the
same at all time points (Chronbach’s alpha = .96). Correla-
tions between two items in the scale tapping an ident ical
concept but worded slightly differently and designed to
indicate internal validity were also strong across time
points (Pearson’s r = .78, .81, and .75 respectively).
Table 1 Sample characteristics: Baseline, 6 months, and for those Lost to Follow-up at 6 months
Patient Characteristic
(as measured at Baseline)
All
Participants
(N = 130)
Those seen at
6 Months
(N = 85)
Those lost to
follow-up at
6 months
(N = 45)
Mean Age
(SD)
25.6
(10.5)
25.4
(10.3)
26.0
(11.2)
~
Gender
(n; % female)
124
(95.4)
81
(95.3)
43
(95.6)
#
Diagnosis
(n; %)
Anorexia Nervosa - Restricting 36
(27.7)
25
(29.4)
11
(24.4)^
Anorexia Nervosa - Binge/Purge 20
(15.4)
17
(20.0)
3
(6.7)
Bulimia Nervosa 39
(30.0)
19
(22.4)
20
(44.4)
EDNOS 35
(26.9)
24
(28.2)
11
(24.4)
BSI
1
Global Severity Score 1.56
(.78)
1.49
(.77)
1.71
(.78)
~
EDI II
2
Total Score 100.5
(45.2)
97.8
(42.8)
105.6
(49.4)
~
Psychiatric Comorbidity
(n; %)
88
(67.7)
63
(74.1)
25
(55.6)
#
Medical Comorbidity
(n; %)
45
(34.6)
32
(37.6)
13
(28.9)
#
Age Symptoms First Appeared
(years; SD)
15.3
(4.7)
15.3
(4.8)
15.3
(4.5)
~
Previous Treatment
(n;%)
86
(66.2)
54
(63.5)
32
(71.1)
#
Mean Time in Treatment
(months; SD)
12.5
(15.8)
12.9
(16.5)
11.7
(14.5)
~
Eating Disorder Duration
(years)
9.7
(9.1)
9.7
(8.8)
9.8
(9.7)
~
1
Brief Symptom Inventory
2
Eating Disorder Inventory II Total Score (all subscales, clinical scoring)
~ Difference between All participants and those Lost at 6 months not significant using Student’s t-tests at alpha level p = .05
# Difference between All participants and those Lost at 6 months not significant using Pearson’s chi-squared test at alpha level p = .05
^ Difference between All participants and those Lost at 6 months not significant using Fisher’s Exact test at alpha level p=.05
Adair et al. Health and Quality of Life Outcomes 2010, 8:83
/>Page 5 of 11
These patterns of distribution-based responsiveness
held across all subscales, as shown in Table 2 with the
minimum effect size for the future outlook subscale at
+.44 and the maximum for education/vocation at +.89.
Patterns of responsiveness, shown in Table 3, varied by
age group, but effect sizes were still moderate or high
for all age groups, including the youngest age group
(14 to 16 years) (see Table 3).
Distribution-based responsiveness indices for the
EDQLS total score are shown in Table 4. The total
6 Months3 MonthsBaseline
140
135
130
125
120
115
110
105
95% CI
Figure 1 EDQLS Total Scores at Baseline, 3 and 6 months.
Table 2 EDQLS subscale scores at baseline, 3 and 6 months and effect sizes
EDQLS Subscales Baseline
(mean SD)
3 months
(mean SD)
6 months
(mean SD)
Effect Size
a
BL to 6 months
Cognitive 8.7
(2.7)
10.1
(2.6)
10.5
(2.6)
+.67
Educational/Vocational 7.4
(2.8)
9.2
(3.1)
9.9
(3.0)
+.89
Family & Close Relationships 10.6
(2.0)
11.1
(2.3)
11.7
(2.0)
+.85
Relationships with Others 8.0
(2.4)
9.2
(2.9)
9.5
(2.8)
+.63
Future Outlook 10.3
(2.5)
11.0
(2.6)
11.4
(2.6)
+.44
Appearance 7.2
(2.8)
8.2
(3.0)
8.7
(2.9)
+.54
Leisure 10.3
(2.3)
11.4
(2.2)
11.4
(2.2)
+.48
Psychological 7.9
(2.4)
9.0
(2.6)
9.1
(2.5)
+.50
Emotional 6.7
(2.2)
7.8
(2.5)
8.0
(2.5)
+.60
Values & Beliefs 6.9
(2.5)
8.3
(2.9)
8.6
(2.9)
+.68
Physical 8.3
(2.5)
9.6
(2.7)
9.6
(2.6)
+.52
Eating 18.3
(5.1)
20.4
(5.4)
21.3
(5.7)
+.59
a
Effect size (Cohen’s d) = 6 month mean scores minus baseline mean scores/standard deviation of baseline scores
Adair et al. Health and Quality of Life Outcomes 2010, 8:83
/>Page 6 of 11
scorechangeexceededtherecommended.5SDfor
responsiveness [49] and the percent change in mean
scores exceeded the 10% considered to be indicative of
clinically signficant change [26]. Effect sizes were
moderate from baseline to three months and large from
baseline to six months. Finally, responsiveness,
expressed as the standardized response mean from base-
line to six months was above .8, also indicating very
good responsiveness [50].
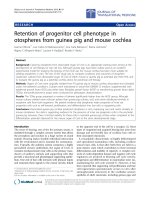
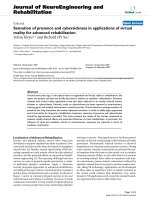
Responsiveness According to Anchor-Based Approaches
In terms of the anchor-based approach, the magnitude of
change in EDQLS total score between baseline and three
months manifested an expected pattern accor ding to five
levels of self-reported change in general health between
baseline and three months. Only one participant reported
that their health was ‘ much worse’ ,andtheirEDQLS
total score dropped by 23 points. Those reporting that
their health was ‘somewhat worse’ (N = 9) or ‘about the
same’ (N = 28) had, on average, only 4.1 (SD = 17.7) and
5.4 (SD = 16.6) point increases respectively. Those
reporting that their health was ‘somewhat better’ (N =
30) had an average 12.7 (SD = 22.4) point increase
and those reporting that their health was ‘ much better’
(N = 15) had an average 45 (SD = 22.4) point increase.
The differences in mean change scores were tested using
a one-way ANOVA (p < .001) (Figure 2) after re-group-
ing the single participant to a new category reflecting
‘somewhat worse’ or ‘much worse’ reported health status.
The differences were statistically significant at the level of
p < .001; Bonferroni post-hoc tests indicated that the sig-
nificance level was attributable to the pair-wise compari-
sons of each level with the ‘much better’ levelatatleast
the .05 level. To provide an indication of the amount of
scale score change that corresponded to any reported
improvement, those who rated their health as being
‘somewhat better’ or ‘much bett er’ by the three month
point (N = 45) had an mean increase in total score from
107.6 (SD = 21.6 ) to 131.2 (SD = 29.2; about a 24 point
improvement); whereas those who rated their health as
being ‘ about the same’ , ‘ somewhat worse’ or ‘ much
worse’ had a mean total score increase of less than five
points 113.6 (SD = 26.8) to 117.9 (SD = 26.6).
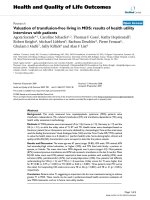
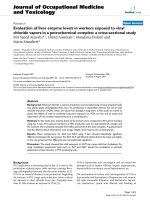
Comparative Responsiveness with Other Qol Instruments
Responsiveness across the follow-up period was exam-
ined graphically for the three generic QoL scales. Find-
ings are shown in Figure 3. EDQLS responsiveness
exceeded that of all comparator instruments at three
months and exceeded that of all comparator instru-
ments but the 16D at six months.
Discussion
Our findings show that the EDQLS is responsive in a
relatively short time period in a multi-site Canadian
sample of EDs patients aged 14 years and older, across
several indices of responsiveness. Participants were at
various stages (recent admission to many months) of
typical inpatient and outpatient programmatic treatment
in Canada. Responsiveness was robust across subscales,
and was as good or better for subscales tapping broader
domains such as educational/vocational and relation-
ship-based quality of life, as op posed to jus t symptoms.
Patterns of responsiveness also held for both distribu-
tion- and anchor-based analyses. These findings are very
encouraging, given t hat the sample was diverse in age
and diagnosis, and was receiving a very heterogeneous
range of therapies (including some inpatient care). It
would be reasonable to expect the instrument to have
even better responsiveness in context of a treatment
trial where participants are enrolled at an early stage o f
treatment and t he intervention is highly standardized.
Est ablishment of responsiveness under these more ideal
conditions is warranted, but, in the current study,
accrual of an adequate sample size of individuals at the
same stage of treatment was not feasible due to a rela-
tively low prevalence condition and limited availability
of services at this level of care.
Table 3 EDQLS mean scores at baseline, 3 and 6 months
and effect sizes by age group
a
Age Group
(N)
Baseline
(mean
SD)
3 months
(mean
SD)
6 months
(mean
SD)
Effect Size
b
BL to 6
months
14-16 years
(11)
108.0
(19.9)
132.1
(37.0)
130.2
(33.7)
+1.11
17-18 years
(12)
116.0
(25.4)
132.3
(19.0)
139.3
(24.5)
+.91
19-21 years
(17)
110.6
(28.3)
125.8
(29.3)
127.5
(28.4)
+.59
22-24 years
(15)
105.1
(25.7)
121.1
(31.7)
123.4
(29.9)
+.71
25 years or older
(28)
111.4
(22.5)
120.9
(27.4)
129.9
(26.8)
+.81
a
for sample with values at all three time points N = 83
b
Effect size (Cohen’s d) = 6 month mean scores minus baseline mean scores/
standard deviation of baseline scores
Table 4 Distribution-based Responsiveness Indices for
the Total Score
3 months
N=98
6 months
N=85
EDQLS Total Score (SD) 124.5 (29) 129.0 (28)
Mean Scale Score changes 14.5 19.0
Mean Percent Change 13.2 17.3
Effect Size
a
.61 .80
Standardized response mean 1.07 1.17
a
Effect size (Cohen’s d) = 6 month mean scores minus baseline mean scores/
standard deviation of baseline scores
Adair et al. Health and Quality of Life Outcomes 2010, 8:83
/>Page 7 of 11
Figure 2 EDQLS Change Scores, Baseline to 6 months, by Self-rated Health Improvement.
0
0.1
0.2
0.3
0.4
0.5
0.6
0.7
0.8
0.9
EDQLS QoLi SF-12 (M) SF-12 (P) 16D
Instrument
Baseline to 3 months Cohen’s d
Baseline to 6 months Cohen’s d
Figure 3 Effect Sizes for the EDQLS and Comparator Generic QoL Instruments. EDQLS = Eating Disorders Quality of Life Scale; QoLi =
Quality of Life Inventory; SF-12 (M) = Short-Form 12 mental subscale; SF-12 (P) = Short-Form 12 physical subscale; 16D = 16 dimensional quality
of life scale.
Adair et al. Health and Quality of Life Outcomes 2010, 8:83
/>Page 8 of 11
Responsiveness has been established in a QoL scale
emphasizing symptoms [27], and we have now also
shown it in an instrument which emphasizes broader
life domains, and for adolescents as well as adults. Effect
sizes for the EDQLS were generally larger across the full
sample than those reported by Las Hayas and colleagues
[27] for those reporting improvement.
As expected, this disease-specific instrument outper-
formed the generic QoL scales for responsiveness,
although, by six months, the 16D performed similarly.
This suggests that the 16D may be well-su ited for stu-
dies of EDs populations, where the use of a generic QoL
scale is important for comparison with other patient
populati ons and/or specialized economic evaluations. In
our sample, the QoLi and the physical subscale of the
SF-12 were much less responsive. During data collec-
tion, we also received spontaneous comments from par-
ticipants that implied lower face validity of these tools.
Thus, a responsive disease-specific instrument can now
be used as an alternative or complement in research
and practice. Such a measure has the additional advan-
tage of having greater face validity and relevance in
patients with ED.
Our findings are unlikely to be biased by attrition,
given that the samples at each time point were very
sim ilar across a range of variables. Our response rate at
our first follow-up (75%) was the same as Las Hayas
and colleagues at their follow-up point [27]. Neither
would there be bias due to drop-out from treatment,
since we followed all participants by mail irrespective of
their stat us in treatment. The proportion that left treat-
ment altogether was very low over the time period
studied.
Information about individuals’ health status was
received via self-report. Given that no corroborating
data for health status ratings were collected indepen-
dently, it cannot be confirmed that these were real and
clinically significant changes in health status. Ideally,
clinical assessments and/or BSI or EDI-2 ratings would
have been taken at outcome, but this was not fe asible
due to large geographic distances in this multi-site study
and the availability of resources to locate and visit those
whowerenolongerintreatmentprograms.Itisalso
possible that social desirability may have played a role in
both score changes and self-reported improvement, if
part icipants were motivated to please the researchers or
to shed a positive light on their treatment program.
However, the sample did include those who had left
treatment, including for reasons of dissatisfaction with
care. Finally, it is also possible that simple familiarity
with the instrument may have produced the changes,
although the consistency of change patterns in expected
directions is reassuring.
In addition, a change in mode of collection (in person
at baseline and by mail at follow-up) may have
influenced results, though all collection points involved
self-completion and assured confidentiality. There is
evidence that collecting outcome data by mail may
encourage more honest reporting, but such effects are
typically small [51]. If t his effect did play a role in the
current study, it would have probably biased findings in
the direction o f lower follow-up scores resulting in less
responsiveness. Even so, future research using clinical
assessments of outcome and standard administration
across time points is desirable.
Although, on a group basis, QoL improved signifi-
cantly over the follow-up period, change trajectories in
total score were highly variable, with some participants’
simply maintaining gains and the QoL for some declin-
ing during the treatment period. This is consistent with
a chronic disease model of EDs. Thus, caution is war-
ranted in the interpretation of individual patient changes
in scores and further work remains on establishing the
minimal clinically important difference. However, the
effect sizes and score ranges over time do provide some
sense of the average change that might be expected in a
patient population receiving publicly funded program-
based ED treatment in Canada.
This study is limited by a relatively small sample size
for some analyses; power was adequate for the overall
analysis but was inadequate for some of the smaller dif-
ferences and/or subgroup analyses. The numbers of
patients with EDs, at least that seek and reach treat-
ment, a re low relative to many chronic conditions, and
there is some reluctance to participate in research.
These circumstances necessitated a multi-site study to
accrue adequate parti cipant numbers. This means that
our results should be reasonably generalizable in terms
of geography, at least in North America.
The sample included so few male patients that resul ts
cannot be considered conclusive for males. Neither can
the findings b e generalized to younger adolescents or
diverse ethnocultural groups. Finally, the factor structure
of the EDQLS has not yet been examined in an inde-
pendent sample confirmatory factor analysis. Future
responsiveness research on the instrument should also
include larger samples and objective measurement of
outcomes.
Conclusions
The EDQLS is promising with respect to reponsiveness
to change in a sample of individuals with varying diag-
noses and ages; across multiple, geographically diverse
treatment programs; and over a relatively short time
period, and, th us, may be useful as an outcome measure
for both research and practice. Further research with
Adair et al. Health and Quality of Life Outcomes 2010, 8:83
/>Page 9 of 11
larger samples and using independent ratings on health
status at outcome are recommended.
List of Abbreviations
16D: The Sixteen Dimensional Health-related Measure; ANOVA: Analysis of
Variance; BSI: Brief Symptom Inventory; EDI-2: Eating Disorders Inventory 2;
EDNOS: Eating Disorder Not Otherwise Specified; EDQLS: Eating Disorder
Quality of Life Scale; EDs: Eating Disorders; GLM: Generalized Linear Model(s);
NHP: Nottingham Health Profile; QoL: Quality of Life; Qoli: Quality of Life
Inventory; SF-12: Short Form-12; SF-36: Short Form-36; SPSS: Statistical
Package for the Social Sciences; WHOQoL-Bref - World Health Organization
Quality of Life Instrument - Brief Version.
Acknowledgements
Results of this study were presented at the Academy for Eating Disorders
International Conference in Seattle, Washington, May 2008. Various stages of
this study were funded by the Alberta Heritage Foundation for Medical
Research, the Alberta Children’s Hospital and the University of Calgary
Department of Psychiatry Mental Health Research Fund. Deep appreciation is
expressed to participants for their enthusiasm and deep insights and staff at
each site, especially Walid Chahine, Carrie Johnson, Brian Gusdal, David Pilon,
and Patti Wagman who assisted with the recruitment process. Enormous
thanks also to Sarah Tucker for assistance with data management.
Author details
1
Departments of Community Health Sciences and Psychiatry, Faculty of
Medicine, University of Calgary, 1215 - 39 Ave, SW, Calgary, AB, T2T 2K6,
Canada.
2
Alberta Health Services - Calgary Region, 10101 Southport Road
SW, Calgary, AB, T2W 3N2, Canada.
3
Department of Human Development
and Applied Psychology, Ontario Institute for Studies in Education, University
of Toronto, 252 Bloor Street West, Toronto, ON, M5S 1V6, Canada.
4
Faculty of
Nursing, University of Calgary, Professional Faculties Building, 2500 University
Drive, NW, Calgary, AB, T2N 1N4, Canada.
5
Faculty of Medicine, University of
British Columbia, 317-2194 Health Sciences Mall, Vancouver, BC, V6T 1Z3,
Canada.
6
Faculty of Medicine, Department of Psychiatry, Dalhousie University,
Halifax, NS, B3H 2E2, Canada.
7
Providence Health Care, 1081 Burrard Street,
Vancouver, BC, V6Z 1Y6, Canada.
8
Capital Health Eating Disorder Clinic,
Room 3005, AJ Lane Memorial Building, P.O. Box 900, Halifax, NS, B3K 9Z9,
Canada.
9
University of Manitoba, Winnipeg, MB, R3T 2N2, Canada.
10
National
Program Evaluation Services, Strategic Policy & Planning Directorate, Building
M8 1 - South, 300 Merivale Road, Ottawa, ON, K1A 0R2, Canada.
11
Center for
Cognitive Behavior Therapy, Department of Psychology, University of Hawaii
at Manoa, Gartley Hall, Room 3, 2430 Campus Rd, Honolulu, HI, 96822, USA.
Authors’ contributions
CA conceived and designed the study, oversaw all stages of data collection
and analysis, and drafted the manuscript. GM coordinated all stages of the
study, gave feedback on design, was responsible for data collection,
supervised data entry, assisted with analysis and reviewed the manuscript.
TB sourced literature and other background information for the manuscript
and provided clinical interpretation. BC and JP provided clinical advice on
design and implementation of the study, assisted with recruitment,
participated in the item revision process and reviewed the manuscript. CE
participated in the item revision process and reviewed the manuscript. JLG,
JG, PF and YS provided clinical advice on design and implementation,
research advice on validation measures, assisted with recruitment and
reviewed the manuscript. LS and KEB assisted with recruitment and data
collection, and reviewed the manuscript. All authors read and approved the
final manuscript.
Competing interests
The first two authors receive nominal license fees for some uses of the
EDQLS.
Received: 16 January 2010 Accepted: 11 August 2010
Published: 11 August 2010
References
1. Engel S, Adair CE, Las Hayas C, Abraham S: Health-related quality of life
and eating disorders: a review and update. Int J Eat Disord 2009,
42:179-187.
2. Hay P, Mond J: How to ‘count the cost’ and measure burden? A review
of health-related quality of life in people with eating disorders. JMH
2005, 14:539-552.
3. Hudson J, Hiripi E, Pope H, Kessler R: The prevalence and correlates of
eating disorders in the National Comorbidity Survey replication. Biol
Psychiatr 2007, 61:348-358.
4. Field A, Camargo C, Barr-Taylor C, Berkley C, Roberts S, Colditz G: Peer,
parent, and media influences on the development of weight concerns
and frequent dieting among preadolescent and adolescent girls and
boys. Pediatrics 2001, 107:54-60.
5. Jones J, Bennett S, Olmsted M, Lawson M, Rodin G: Disordered eating
attitudes and behaviours in teenaged girls: a school based study. CMAJ
2001, 165:547-552.
6. McVey G, Tweed S, Blackmore E: Dieting among preadolescent youth and
adolescent females. CMAJ 2004, 170:1559-1561.
7. de la Rie S, van Furth E, de Koning A, Noordenbos G, Donker M: The
quality of life of family caregivers of eating disorder patients. Eating
Disorders 2005, 13:345-351.
8. Berkman N, Bulik C, Brownley K, Lohr K, Sedway J, Rooks A, et al:
Management of eating disorders: Evidence Report/Technology Assessment
Rockville, MD: AHRQ 2006.
9. Wilson G, Shafran R: Eating disorders guidelines from NICE. Lancet 2005,
365:79-81.
10. de la Rie S, Noordenbos G, Donker M, van Furth E: The patient’s view on
quality of life and eating disorders. Int J Eat Disord 2006, 39:1-8.
11. Miller P: Redefining success in eating disorders. Addict Behav 1996,
21:745-754.
12. Noordenbos G, Seubring A: Criteria for recovery from eating disorders
according to patients and therapists. Eating Disorders 2006, 14:41-54.
13. Treasure J: Getting beneath the phenotype of anorexia nervosa: The
search for viable endophenotypes and genotypes. Can J Psychiat 2007,
52:212-219.
14. Doll H, Peterson S, Stewart-Brown S: Eating disorders and emotional and
physical well-being: associations between student self-reports of eating
disorders and quality of life as measured by the SF-36. Qual Life Res
2005, 14:705-717.
15. Wiebe S, Guyatt G, Weaver B, Matijevic S, Sidwell C: Comparative
responsiveness of generic and specific quality-of-life instruments. J Clin
Epidemiol 2003, 56:52-60.
16. Guyatt G: Commentary on Jack Dowie, “Decision validity should
determine whether a generic or condition-specific HRQOL measure is
used in health care decisions”. Health Econ 2002, 11:9-12.
17. Guyatt G, Walter S, Norman G: Measuring change over time: assessing the
usefulness of evaluative instruments. J Chronic Dis 1987, 40:171-178.
18. Mallinson S: Listening to respondents: A qualitative assessment of the
Short-Form 36 Health Status Questionnaire. Soc Sci Med 2002, 54:11-21.
19. Padierna A, Quintana J, Arostegui I, Gonzalez N, Horcajo M: Changes in
health related quality of life among patients treated for eating
disorders. Qual Life Res 2002, 11:545.
20. Abraham S, Brown T, Boyd C, Luscombe G, Russell J: Quality of life: eating
disorders. Aust N Z J Psychiatry 2006, 40:150-155.
21. Engel S, Wittrock D, Crosby R, Wonderlich S, Mitchell J, Kolotkin R:
Development and psychometric validation of an eating disorder-specific
health-related quality of life instrument. Int J Eat Disord 2006, 39:62-71.
22. Mond J, Hay P, Rogers B, Owen C, Beumont P: Assessing quality of life in
eating disorder patients. Qual Life Res 2005, 14:171-178.
23. Las Hayas C, Quintana J, Padierna A, Bilbao A, Munoz P, Madrazo A, et al:
The new questionnaire Health-Related Quality of Life for Eating
Disorders showed good validity and reliability. J Clin Epidemiol 2006,
59:192-200.
24. Adair CE, Marcoux GC, Cram BS, Ewashen CJ, Chafe J, Cassin SE, et al:
Development and multi-site validation of a new condition-specific
quality of life measure for eating disorders. Health Qual Life Outcomes
2007, 5:23-36.
Adair et al. Health and Quality of Life Outcomes 2010, 8:83
/>Page 10 of 11
25. Bohn K, Doll HA, Cooper Z, O’Connor M, Palmer RL, Fairburn CG: The
measurement of impairment due to eating disorder psychopathology.
Behav Res Ther 2008, 46:1105-1110.
26. Revicki DA, Osoba D, Fairclough D, Barofsky I, Berzon R, Leidy NK, et al:
Recommendations on health-related quality of life research to support
labelling and promotional claims in the United States. Qual Life Res 2000,
9:887-900.
27. Las Hayas C, Quintana JM, Padierna JA, Bilbao A, Munoz P, Cook FE: Health-
related quality of life for eating disorders questionnaire version-2 was
responsive 1-year after initial assessment. J Clin Epidemiol 2007,
60:825-833.
28. WHOQOL Group: The World Health Organization Quality of Life
Assessment (WHOQOL) position paper from the World Health
Organization. Soc Sci Med 1995, 41:1403-1409.
29. Burke L, Stifano T, Dawisha S: Guidance for industry: patient-reported
outcome measures: use in medical product development to support
labelling claims: draft guidance. Health Qual Life Outcomes 2006, 4:79.
30. Kessler RC, Mroczek DK: Some methodological issues in the development
of quality of life measures for the evaluation of medical interventions. J
Eval Clin Pract 1996, 2:181-191.
31. Fayers P, Fayers D: Quality of life assessment, analysis and interpretation West
Sussex: John Wiley & Sons Ltd 2000.
32. Juniper E, Guyatt G, Jaeschke R: How to develop and validate and new
health-related quality of life instrument. Quality of Life and
Pharmacoeconomics in Clinical Trials Philadelphia: Lippincott-RavenSpilker B ,
2 1996, 49-55.
33. McDowell I, Jenkinson C: Development standards for health measures. J
Health Serv Res Policy 1996, 1:238-246.
34. Willis G: Cognitive interviewing: A tool for improving questionnaire design
Thousand Oaks, CA: Sage Publications 2004.
35. Collins D: Pretesting survey instruments: an overview of cognitive
methods. Qual Life Res 2003, 12:229-238.
36. McColl E, Meadows K, Barofsky I: Cognitive aspects of survey
methodology and quality of life assessment. Qual Life Res 2003,
12:217-218.
37. Trauer T, MacKinnon A: Why are we weighting? The role of importance
ratings in quality of life measurement. Qual Life Res 2001, 10:579-585.
38. Frisch M, Clark M, Rouse S, Rudd M, Paweleck J, Greenstone A, et al:
Predictive and treatment validity of life satisfaction and the Quality of
Life Inventory. Assessment 2005, 12:66-78.
39. Ware J, Kosinski M, Keller S: A 12-item short-form health survey:
construction of scales and preliminary tests of reliability and validity.
Med Care 1996, 34
:220-233.
40. Apajasalo M, Sintonen H, Holmberg C, Sinkkonen J, Aalberg V, Pihko H,
et al: Quality of life in early adolescence: a sixteen-dimensional health-
related measure (16D). Qual Life Res 1996, 5:205-211.
41. Derogatis L: Brief Symptom Inventory (BSI) Administration, scoring, and
procedures manual Minneapolis: NCS Pearson Inc 1993.
42. Garner DM: Eating Disorder Inventory-2 (EDI-2) Professional manual Odessa:
Psychological Assessment Resources Inc 1993.
43. Dillman DA: Mail and Internet Surveys: the Tailored Design Method NY: Wiley
1999.
44. Guyatt GH, Osoba D, Wu A, Wyrwich KW: Norman GR & the Clinical
Significance Consensus Meeting Group: Methods to explain the clinical
significance of health status measures. Mayo Clin Proc 2002, 77:371-383.
45. Crosby RD, Kolotkin RL, Williams GR: Defining clinically meaningful change
in health-related quality of life. J Clin Epidemiol 2003, 56:395-407.
46. Norman GR, Sloan JA, Wyrwich KW: Interpretation of changes in health-
related quality of life: the remarkable universality of half a standard
deviation. Med Care 2003, 41:582-592.
47. Norman GR, Wyrwich KW, Patrick DL: The mathematical relationship
among different forms of responsiveness coefficients. Qual Life Res 2007,
16:815-822.
48. Zou GY: Quantifying responsiveness of quality of life measures without
an external criterion. Qual Life Res 2005, 14:1545-1552.
49. Revicki DA, Cella D, Hays RD, Sloan JA, Lenderking WR, Aaronson NK:
Responsiveness and minimal important differences for patient reported
outcomes. Health Qual Life Outcomes 2006, 4:70.
50. Fayers P, Hays R: Assessing quality of life in clinical trials: Analysis and
Interpretation USA: Oxford University Press, 2 2005.
51. Fowler FJ: Survey research methods Thousand Oaks: Sage Publications, 4
2009.
doi:10.1186/1477-7525-8-83
Cite this article as: Adair et al.: Responsiveness of the Eating Disorders
Quality of Life Scale (EDQLS) in a longitudinal multi-site sample. Health
and Quality of Life Outcomes 2010 8:83.
Submit your next manuscript to BioMed Central
and take full advantage of:
• Convenient online submission
• Thorough peer review
• No space constraints or color figure charges
• Immediate publication on acceptance
• Inclusion in PubMed, CAS, Scopus and Google Scholar
• Research which is freely available for redistribution
Submit your manuscript at
www.biomedcentral.com/submit
Adair et al. Health and Quality of Life Outcomes 2010, 8:83
/>Page 11 of 11