báo cáo hóa học:"The ChQoL questionnaire: an Italian translation with preliminary psychometric results for female oncological patients" potx
Bạn đang xem bản rút gọn của tài liệu. Xem và tải ngay bản đầy đủ của tài liệu tại đây (490.52 KB, 13 trang )
RESEARC H Open Access
The ChQoL questionnaire: an Italian translation
with preliminary psychometric results for female
oncological patients
Giovanni Aschero
1*
, Flavio Fenoglio
1
, Maria Giuseppina Vidili
1
, Andrea Wussler
2
Abstract
Background: in Occidental languages, no widely accepted questionnaire is available which deals with health
related quality of life from the specific point of view of Traditional Chinese Medicine (TCM). Some psychometric
tools of this kind are available in Chinese. One of them is the Chinese Quality of Life questionnaire (ChQoL). It
comprises 50 items, subdivided in 3 Domains and 13 Facets. The ChQoL was built from scratch on the basis of
TCM theory. It is therefore specifically valuable for the TCM practitioner. This paper describes our translation into
Italian of the ChQoL, its first application to Occidental oncological patients, and some of its psychometric
properties.
Methods: a translation scheme, originally inspired by the TRAPD procedure, is developed. This scheme focuses on
comprehensibility and clinical usefulness more than on linguistic issues alone. The translated questionnaire is
tested on a sample of 203 consecutive female patients with breast cancer. Shapiro-Wilk normality tests, Fligner-
Killeen median tests, exploratory Two-step Cluster Analysis, and Tukey’s test for non-additivity are applied to study
the outcomes.
Results: an Italian translation is proposed. It retains the TCM characteristics of the original ChQoL, it is intelligible to
Occidental patients who have no previ ous knowledge of TCM, and it is useful for daily clinical practice. The score
distribution is not Normal, and there are floor and ceiling effects. A Visual Analogue Scale is identified as a suitable
choice. A 3-point Likert scale can also efficiently describe the data pattern. The original scales show non-additivity,
but an Anscombe-Tukey transformation with g = 1.5 recovers additivity at the Domain level. Additivity is enhanced
if different g are adopted for different Facets, except in one case.
Conclusions: the translated questionnaire can be adopted both as a filing system based on TCM and as a source
of outcomes for clinical trials. A Visual Analogue Scale is recommended, but a simpler 3-point Likert scale also
suitably fits data. When estimating missing data, and when grouping items within Domain in order to build a
summary Domain index, an Anscombe-Tukey transformation should be applied to the raw scores.
Background
Traditional Chinese Medicine (TCM) has enjoy ed a
great deal of exposure in Occidental countries. As a
consequence, there is an increasing need for psycho-
metric tools specifically tailored to TCM. Tools devel-
oped in different medical contexts can of course be of
use, but they are not necessarily optimal. The theoretical
foundations of TCM are often unfamiliar to Occidental
patients, so that Health Related Quality of Life (HRQoL)
may be conceptualized differently by the TCM practi-
tioner and the Occidental patient. On the one hand,
quantitative psychometric tools are required to provide
sound outcomes for clinical trials. On the other hand,
the employment of generic tools, not specifically tailored
to TCM, may result in insufficient sensitivity for those
clinical trials. A standardized psychometric instrument
basedonTCMwouldbeveryuseful,butatpresentno
widely accepted generic questionnaire is available in
Occidental languages.
* Correspondence:
1
Istituto Nazionale per la Ricerca sul Cancro, S.S. di Riabilitazione Oncologica,
Viale Rosanna Benzi 10, I-16132 Genova, Italy
Full list of author information is available at the end of the article
Aschero et al . Health and Quality of Life Outcomes 2010, 8:106
/>© 2010 Asche ro et al; licensee BioMed Central Ltd. This is an Open Access article distributed under the terms of the Creative Co mmons
Attribution License ( censes/by/2.0), which permits unrestricted use, distribution, and reproductio n in
any medium, provid ed the original wor k i s properly cited.
In 2005 our Oncological Rehabilitation (O.R.) Unit
started a data collection project, concerning acupunc-
ture and TCM. On this basis, we later initiated a rando-
mized clinical trial on the effectiveness of acupuncture
treatments for breast cancer patients undergoing
chemotherapy. Our aim was to ascertain whether acu-
puncture could relieve some of the side effects of
chemotherapy. The generic EORTC QLQ-C30 question-
naire [1] and its related breast cancer specific module
BR-23 were used in order to provide the main outcome,
but the adoption of an additional questionnaire concern-
ing HRQoL from the specific point of view of TCM was
considered desirable.
The Chinese Quality of Life questionnaire (ChQoL)
developed by Leung et al. [2-5] was identified as a possi-
ble option, due to its peculiarities with respect to the
evaluation of acupuncture results. Being able to quantify
HRQoL according to TCM was its explicit goal. The
main characteristics of the ChQoL were its lack of spe-
cialization, its orientation to generic medicine, and the
fact that it was highly structured. The questionnaire
comprised 50 items, subdivided into 13 “ Facets"; the
Facets were grouped into 3 “Domains”, namely “Physical
Form”, “Vitality & Spirit”, “Emotion”. Furthermore, this
structure was built from scratch directly on TCM theo-
retical considerations, and then validated using Factor
Analysis and Structural Equation Modeling [2,3].
The ChQoL was developed in Chinese. To our knowl-
edge, no published translation is available in any Occi-
dental langua ge, except for a provision al “ tentative”
English translation reported in [2]. The present paper
describes the translation procedure we adopted, the
resulting I talian questionnaire, the score distribution in
a sample of 203 patien ts, and some modifications to the
response scales with respect to the original ques tion-
naire. These modificati ons were deemed useful to adapt
the ChQoL to the Italian cultural context. Some issues
concerning internal consistency and additivity of scales
are also considered. Our main interest at present is
applicability to oncological patients. All the numerical
results here reported concern a sample of female
patients suffering from breast cancer.
Methods
Translation procedure
We adopted an iterative, multi-step, committee-based
translation approach. Our procedure was initially
inspired by the TRAPD framework ([6-8]; see also [9]).
TRAPD is the acronym for five subsequent (but interre-
lated) phases: Translation, Review, Adjudication, Pre-
testing and Documentation. This framework is particu-
larly in use in social sciences, where cross-cultural dif-
ferences are often an issue. However, the T RAPD
original scheme was adapted and enlarged, so as to
meet the specific needs of a TCM based instrument
addressed to Occidental patients.
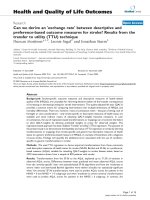
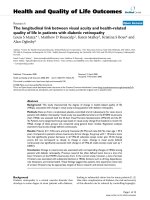
Figur e 1 shows a detailed flow chart of the translation
procedure. Two separate translations were obtained,
directly from the Chinese source. One was considered
as “main” and one as “ secondary ”. The two translators
worked separately and independently. Both translators
spoke mother tongue Italian, and had al ready received
training in TCM at the time of translation. The first
translator was a professional sinologist and in terpreter,
who had been residing in Beijing for several years. His
work was intended to provide the best possible render-
ing of the original source into Italian, especially from
the point of view of Conceptual and Semantic equiva-
lence (we classify equivalence according to Herdman
et al. see [10,11]). This was considered as the “main ”
translation. The second translator was a professional
data analyst, with a background in questionnaire design
and analysis. His task was more focused on disclosing
issues regarding Operational and Measureme nt equiva-
lence.Thiswasconsideredasa“secondar y” translation,
to be used in suborder with respect to the first one.
A first series of meetings ("team review & reconcilia-
tion” in Figure 1) was held to review the two transla-
tions and the English source, and to reconcile them into
a suitable Italian version. These meetings were attended
by two medical doctors, the first translator, and the pro-
ject coordinator (who was also the secondary translator).
The two medical doctors were Italian acupuncturists,
who had been studying and practicing TCM with
patients for many years. Each component of the team
was provided with the two translations and with the
provisional “tentative” English version published by the
original Chinese authors. After the team reached an
agreement, a first reconciled Italian version was pro-
duced. At this stage, it was also decided to abandon the
Likert scale adopted in the Chinese source, in favor of a
Visual Analogue Scale (VAS). Therefore appropriate ver-
bal descriptors were created, two for each line in the
VAS. The reconciled version was further considered by
the two medical doctors ("team TCM screening”), in
order to screen adherence to TCM theory and to exam-
ine issues of comprehensibility on behalf of patients.
Minor variations were proposed, and accepted by the
team. A final meeting ("team adjudication”)washeld
among the four components of the team, to agree on a
final version. After formatting and proof-reading, a draft
copy of the Italian version ("ChQoL-IT”) was produced.
The draft copy was tested with a first round of retro-
spective debriefing interviews [12]. Eight volunteers
rec eive d concise information about TCM and VAS, and
then completed the questionnaire without supervision.
Either a generic psychologist supervised by a medical
doctor or a clin ical psychologist alone reviewed the
Aschero et al . Health and Quality of Life Outcomes 2010, 8:106
/>Page 2 of 13
completed questionnaire together with each respondent,
investigating m issing data, problems of comprehension,
and possibly offensive or problematic wording. Apart
from these three issues, comments from the respondents
were never solicited, but the interviewer was instructed
to welcome any spontaneous comment.
The retrospective debriefing round was followed by
cognitive debriefing interviews with 12 other volunteers.
The questionnaire was completed without supervision.
A medical doctor discussed the completed questionnaire
with the respondent, on an item-by-item basis. The dis-
cussion aimed to detect if the original meaning had
been correctly preserved in the translation, and if any
unclear or ambiguous wording could generate misinter-
pretations. It was also specifically verified that the polar-
ity of scales had been correctly recognized. The number
of items was too high to discuss the entire questionnaire
in one single interview. The questionnaire was divided
into two parts, keeping either even or odd numbered
items, and each volunteer was interviewed on one part
only.
The results from the retrospective and cognitive inter-
views were analyzed by the project coordinator. On this
basis, some variations concerning response scales and
their verbal descriptors were proposed . The variations
were reviewed by the two medical doctors ("variations &
clinicians’ review”), and after a new discussion concern-
ing adherence to TCM theory ("team TCM screening” )
were approved by the team. After formatting and proof-
reading, a new draft copy was finalized. An additional
round of debriefing interviews was considered necessary,
but it eventually yielded no further improvement.
The draft copy was therefore emplo yed, without
changes, to test clinical applicability ("clinical pilot test-
ing” in Figure 1). The purpose was to ascertain differ-
ences between the pat ient’ s response and the doctor’ s
opinion. The questionnaire was self-administered. Each
response was then compared with what the doctor con-
sidered correct for that patient. Of course, this compari-
son was only possible for a few items, some issues being
too personal to allow an external assessment. The full
results are not part of this paper, and this topic will be
Figure 1 Translation procedure. Flow chart detailing the subsequent steps for translation. The dotted line represents a possible feedback path
which, although originally considered, was ultimately found to be unnecessary.
Aschero et al . Health and Quality of Life Outcomes 2010, 8:106
/>Page 3 of 13
covered in deta il elsewhere. Preliminary results can be
found in [13]. As far as it is of interest here, the com-
parison did not bring to light any specific bias which
could advise against self-administration. The unattended
modality of administration was consequently deemed
valid for clinical use.
At a recapitulatory final meeting ("team review” in
Figure 1) the team appraised the translated question-
naire according t o four criteria: adherence to the origi-
nal meaning, significan ce for TCM, clinical usefulness,
and psychological impact on patients. The translation
was considered satisfa ctory, and it was approved as the
final version of the ChQoL-IT.
Three further actions were planned, as described in
Figure 1: extensive clinical testing for psychometric
properties, randomized clinical trials including valida-
tion, and comparative studies for weighting of scores in
cross-cultural studies. The first has bee n accomplished,
and its results will be described in the following para-
graphs. A randomized clinical trial to evaluate the
effects of acupuncture during chemot herapy has alr eady
been completed, and data analysis is in prog ress. The
third action has been delayed, waiting for the full results
from the randomized clinical trial.
Clinical Testing
The questionnaire was handed to 230 consecutive
patients. All patients were female, and had been recently
diagnosed with breast cancer. All of them were under-
going, or were expected to undergo in a short time, con-
ventional cancer treatment. No patient had previously
received treatment with TCM at our Unit. The ChQoL-
IT was self-administered, but prior to compilation each
respondent was instructed on the questionnaire struc-
ture and aims, and on some aspects of TCM. The br ief-
ing was conducted by a medical doctor, and lasted less
than 10 minutes. All t he respondents were completing
the questionnaire for the first time.
Of the 230 questionnaires, 27 had missing data and
werenotconsideredinthefinalsample.Thereasonis
that, until data additivity has been either proved or
recovered with proper techniques, handling of missing
data is not straightforward. The usual linear techniques
would not be applicable. Additivity will be considered in
detail in the Discussion. Apart from this, no selection
was made. The age of the 20 3 respondents ranged from
27 to 93 years, mean age ± SD was 57 ± 13 years, med-
ian age was 56 years. Only 106 out of 203 patients
declared occupational status: 33% clerks and employe es,
32.1% homemakers, 24.5% retired, 5.7% self-employed
workers (professionals, managers, storekeepers, retai-
lers), 3.8% manual workers, 0.9% unemployed. Data
collection started on February 2006 and ended on Sep-
tember 2007.
This study was approved by the local Ethical Commit-
tee. Permission to conduct the study was obtained from
the Head of the O.R. Unit. Written informed consent was
obtained from the 20 participants in the debriefing inter-
views. No written informed consent was considered
necessary for the 230 patients, because the ChQoL-IT
just provided a rational, well organized modality to con-
duct the TCM examinations, identical to the examination
the patient was currently undergoing. In fact, several
questions in the ChQoL were already standard topics of
those examinations. The adoption of the ChQoL-IT sim-
plified the daily routine work, and it did not impose addi-
tional or unnecessary burden on patients.
Data analysis
All scores were normalized to 0-100, the higher scores
corresponding to a better health status. The score distri-
bution was studied with Shapiro-Wilk normality tests
and Fligner-Killeen median tests. Exploratory Two-step
Cluster Analysis was also applied. The computation
assumed an initial maximum of 15 clusters, a Bayesian
information crite rion for determining their number ,
noise handling at 25% for defining outliers, and minus
log-likelihood for distance between clusters. The likeli-
hood metric was preferred to the Euclidean because it
resulted in a much lower number of outliers with our
data. Scale additivity was examined by means of a
Tukey’s test for non-additivity (TTN) [14,15], including
the Anscombe-Tukey power transformation. Calcula-
tions were performed using SPSS version 15 (SPSS Inc.,
Chicago IL) and the R statistical package version 2.7.2
(R Foundation for Statistical Computing).
Results
Target Questionnaire
The final target questionnaire ChQoL-IT is available in
pdf format (Additional file 1). The 50 items a re num-
bered progressively, grouped by Facet and Domain. The
response scale is a VAS with horizontal lines, delimited
at their extremities by short vertical lines, to avoid
marking off the scale [16]. Lines have no gradations, to
preserve sensitivity [17]. They are of equal le ngth, and
verbal descriptors are placed close to their extremities.
For each item, the left side of the scale corresponds to a
poor health status, whilst the right side corresponds to a
better health.
Clinical Testing
Table 1 reports the scores for the sample of 203 respon-
dents. Floor and ceiling effects are present , as shown by
the high percentage of scores below 10 or above 90.
A visual inspection of the frequency distributions con-
firms that a ceiling effect is present in approximately
60% of the items and a floor in 10% of them. Four
Aschero et al . Health and Quality of Life Outcomes 2010, 8:106
/>Page 4 of 13
Table 1 Score distribution
item min max mean median floor ceiling skewness Kurtosis
1 3 100 54.4 (25.4) 49.2 (39.3-75.0) 5% 14% 0.13 -0.74
2 2 100 48.1 (27.7) 46.6 (24.6-70.0) 11% 8% 0.11 -1.05
3 3 100 56.1 (25.4) 55.4 (38.3-76.8) 3% 11% -0.12 -0.97
4 1 100 49.0 (29.7) 48.2 (24.8-76.7) 14% 11% 0.04 -1.22
5 2 100 54.4 (31.3) 50.0 (28.0-84.8) 10% 20% -0.11 -1.35
6 1 100 57.7 (31.3) 60.9 (32.6-89.1) 10% 22% -0.29 -1.33
7 1 100 53.9 (26.8) 50.0 (34.7-79.5) 5% 10% -0.06 -1.01
8 0 100 49.8 (29.7) 47.9 (26.1-77.5) 14% 10% 0.00 -1.21
9 0 97 38.4 (28.5) 33.9 (10.2-60.2) 24% 5% 0.45 -0.99
10 0 98 44.5 (29.3) 43.2 (17.0-66.1) 15% 9% 0.25 -1.16
11 0 98 45.0 (29.6) 41.5 (19.5-73.9) 14% 9% 0.27 -1.22
12 1 100 47.2 (30.4) 44.9 (20.3-75.9) 14% 9% 0.11 -1.29
13 2 100 59.8 (30.6) 67.0 (33.3-88.4) 9% 22% -0.40 -1.19
14 3 100 70.3 (26.3) 80.4 (48.2-91.5) 3% 31% -0.94 -0.22
15 2 100 61.3 (29.8) 66.9 (36.4-89.3) 6% 23% -0.47 -1.08
16 3 100 68.1 (26.3) 77.3 (47.5-91.1) 4% 28% -0.77 -0.47
17 0 100 70.9 (26.3) 82.1 (50.0-91.5) 3% 32% -0.92 -0.33
18 2 100 59.8 (29.0) 60.2 (35.7-87.6) 7% 21% -0.37 -1.10
19 1 98 48.0 (29.7) 48.1 (19.6-72.9) 13% 13% 0.11 -1.25
20 2 100 60.3 (29.4) 66.1 (39.8-89.1) 7% 22% -0.39 -1.12
21 4 100 71.7 (24.1) 79.5 (54.2-91.0) 3% 27% -1.02 0.25
22 9 100 70.0 (24.3) 77.7 (50.0-91.1) 0% 30% -0.76 -0.50
23 0 100 65.9 (25.2) 70.5 (48.3-88.4) 2% 22% -0.61 -0.63
24 1 100 56.9 (27.3) 57.6 (38.3-80.4) 6% 14% -0.32 -0.90
25 3 100 67.3 (25.2) 73.2 (48.2-89.0) 3% 21% -0.74 -0.40
26 0 100 71.9 (22.8) 78.2 (56.3-90.7) 1% 27% -0.91 0.01
27 0 100 71.1 (22.5) 77.1 (53.6-89.8) 1% 25% -0.84 -0.07
28 4 100 69.6 (22.7) 76.3 (50.9-88.4) 0% 19% -0.68 -0.51
29 4 100 67.0 (23.8) 70.5 (49.2-88.4) 1% 18% -0.58 -0.57
30 4 100 71.0 (22.1) 76.8 (52.7-89.8) 1% 24% -0.79 -0.12
31 2 100 73.3 (21.1) 79.8 (58.1-90.6) 1% 26% -1.05 0.59
32 0 100 65.3 (24.7) 68.8 (48.3-87.5) 1% 19% -0.58 -0.56
33 0 100 57.8 (26.4) 59.3 (42.9-80.5) 5% 14% -0.31 -0.79
34 3 100 59.1 (26.0) 61.6 (43.2-79.5) 5% 13% -0.42 -0.72
35 0 100 68.2 (25.9) 75.2 (49.1-89.9) 5% 25% -0.88 -0.16
36 0 100 78.6 (20.5) 85.9 (70.3-93.2) 2% 37% -1.67 2.78
37 0 100 55.7 (27.6) 55.1 (36.4-78.8) 8% 12% -0.28 -0.91
38 2 100 62.7 (26.2) 66.7 (44.1-86.0) 5% 17% -0.49 -0.67
39 2 100 59.9 (28.7) 61.2 (39.1-86.4) 8% 18% -0.45 -0.94
40 3 100 76.1 (22.5) 84.7 (66.4-92.9) 1% 34% -1.31 1.02
41 0 100 60.8 (27.2) 58.9 (46.4-85.9) 8% 19% -0.51 -0.54
42 0 99 33.9 (27.5) 25.0 (10.2-50.0) 24% 4% 0.72 -0.59
43 0 100 49.3 (29.4) 49.1 (23.3-72.0) 13% 11% -0.02 -1.17
44 2 100 69.2 (28.0) 79.7 (50.0-92.3) 5% 34% -0.92 -0.29
45 0 100 63.4 (27.4) 68.8 (45.7-89.0) 5% 21% -0.55 -0.77
46 1 100 60.0 (27.6) 63.6 (42.7-84.4) 7% 15% -0.49 -0.80
47 0 100 59.5 (27.9) 62.7 (43.8-84.4) 6% 13% -0.47 -0.88
48 2 100 65.6 (29.5) 76.5 (47.5-89.1) 9% 23% -0.86 -0.52
49 0 100 57.7 (28.1) 55.4 (42.4-83.7) 10% 11% -0.43 -0.85
50 2 100 58.2 (30.0) 63.3 (35.6-86.4) 9% 17% -0.39 -1.15
For each item: minimum and maximum observed score (range is 0 - 100), mean with standard deviation, median with 25% and 75% percentiles, score floor and
ceiling, skewness and kurtosis. Floor and ceiling are expressed as percentage of scores below 10 and above 90 respectively.
Aschero et al . Health and Quality of Life Outcomes 2010, 8:106
/>Page 5 of 13
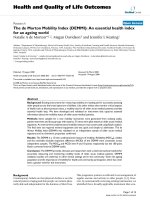
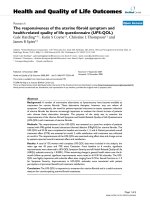
examples are visible in Figure 2, which shows the fre-
quency distribution for items 1, 17, 42, 49. These items
have been selected because their distribution is repre-
sentative. In fact, all the distributions show two, or even
three, distinct peaks. The distribution around each peak
is often truncated when the peak is near one end of the
VAS.
A Shapiro-Wilk test confirms absence of normality
(p-value < 0.001 for each of the 50 items). Homogeneity
of variances withi n Facet can be studied wit h a Fligner-
Killeen median test, which is particularly robust against
departures from normality [18]. The results are in Table
2; absence of homogeneity is evident in 7 out of 13
cases at a p-level of 0.05, notably for Facets Sleep, Ver-
bal Expression, Joy, and Anger.
Table 3 reports the numb er of clusters identified by a
Two-step Cluster Analysis. This kind of analysis auto-
matically identifies an optimal number of clusters. The
first subcolumn ("by item” ) pertains to a clustering
applied item by item; the second ("by Facet” )toa
clustering where all the items within one Facet are con-
sidered at the same time. The latter analysis is legiti-
mated by previously reported Factor Analysis results
[2,3], which identify a single factor for each ChQoL
Fac et. Grouping into Facets tends to decrease the num-
ber of clusters, except for Facets “Appetite & Digestion”
and “Spirit of the Eyes”. This is a consequence of mixing
information from different items. However, it is con-
firmed that a maximum of 3 clusters is always sufficient.
Each cluster is identified by its centroid (mean and stan-
dard deviation) at the “by item” level. The number of
cases which do not fit into the identified clusters is
small, amounting to 3.9% in the worst case.
This confirms that the clustering algorithm works
properly with these data. The overall distribution of cen-
troids is sharp for the intermediate and the right-end
clusters (standard deviations 4.3 and 5.0 respectively).
The spreading for the left-end cluster, which corre-
sponds to a worse health s tatus, is three times as much
(standard d eviation 13.9). The two outermost centroids
are not equidistant from the half point of the VAS
(score 50), their average half point being 58.4 (confi-
dence inter val at p = 0.95: 56 .1-60.7). This me ans a
slight shift towards a better health status. When the
analysis is limited to the three clusters (15 cases), the
intermediate cluster is centered on 50.8 (confidence
interval at p = 0.95: 48.4-53.1), which is statistically
compatible with the half point of the VAS.
Table 4 shows the results from a TTN. In 6 out of 13
Facets a lack of additivity is found. Some kinds of non-
additivity can b e removed by raising scores to a proper
corrective factor g (Anscombe -Tukey transformation).
The three last columns in Table 4 show the TTN signif-
icance when three different g are applied: the g found
applying the TTN by Facet; the g found applying the
Figure 2 Frequency distribution of scores for four items.
Relative frequency distribution of scores, expressed as percentage
over the sample of the 203 respondents. Clockwise, starting from
upper left: items 1, 17, 42, 49. The distribution for the other 46
items resembles one of these four cases. The dashed line is a
smooth estimate obtained via an Epanechnikov kernel with
bandwidth = 5.
Table 2 Fligner-Killeen test
Domain Facet items c
2
p-value
Physical Complexion 4 10.5 0.01
Sleep 3 15.9 0.00
Stamina 6 3.4 0.49
Appetite & Digestion 4 13.7 0.00
Adaptation to climate 3 0.3 0.84
Vitality & Spirit Consciousness 3 3.8 0.15
Thinking 5 14.1 0.01
Spirit of the eyes 2 2.8 0.09
Verbal expression 2 13.0 0.00
Emotional Joy 4 35.7 0.00
Anger 5 24.1 0.00
Depressed mood 6 2.9 0.72
Fear & Anxiety 3 2.4 0.30
Fligner-Killeen median test for the homogeneity of variances The test is applied
within Facet Dishomogeneity is found in 7 out of 13 Facets (p-level 0.05).
Aschero et al . Health and Quality of Life Outcomes 2010, 8:106
/>Page 6 of 13
Table 3 Cluster Analysis
Centroids
n. of clusters cluster 1 cluster 2 cluster 3
Facet Item by item by Facet mean (sd) mean (sd) mean (sd) outliers extr mean
Complexion 1 3 2 21.0 (10.5) 50.6 (8.4) 89.5 (7.1) – 55.3
2 3 2 13.9 (7.8) 44.8 (7.8) 80.4 (11.3) – 47.1
3 2 2 35.6 (14.3) –– 79.3 (11.2) – 57.5
4 3 2 14.7 (9.5) 47.1 (7.8) 83.0 (10.2) – 48.9
Sleep 5 2 2 29.4 (16.8) – 85.2 (10.7) – 57.3
6 2 2 29.6 (17.1) – 85.4 (10.0) – 57.5
7 2 2 36.7 (16.4) –– 83.8 (9.2) – 60.3
Stamina 8 3 3 15.1 (10.1) 47.1 (7.3) 83.7 (9.5) – 49.4
9 2 3 15.8 (11.0) –– 65.6 (17.0) – 40.7
10 3 3 15.9 (9.8) 50.5 (8.7) 85.5 (8.0) – 50.7
11 2 3 25.7 (15.5) –– 79.4 (12.6) – 52.6
12 3 3 12.1 (7.9) 43.4 (8.8) 82.4 (10.2) – 47.2
13 2 3 29.1 (16.7) – 83.7 (11.6) – 56.4
Appetite 14 2 3 33.8 (15.9) –– 84.9 (10.9) – 59.3
15 2 3 36.7 (19.9) –– 87.6 (8.2) – 62.1
16 2 3 39.9 (17.0) –– 87.1 (8.1) – 63.5
17 2 3 38.6 (16.3) –– 88.2 (7.6) – 63.4
Climate Adapt. 18 2 2 35.9 (18.1) –– 85.9 (9.2) – 60.9
19 3 2 16.7 (9.8) 54.5 (10.3) 88.5 (6.7) – 52.6
20 2 2 33.5 (17.1) –– 85.2 (10.0) – 59.4
Consciousness 21 2 2 42.0 (17.1) – 86.0 (9.2) – 64.0
22 2 2 48.5 (16.1) – 88.8 (6.6) 1.5% 68.7
23 2 2 51.0 (17.2) – 89.6 (5.6) 3.0% 70.3
Thinking 24 2 2 36.1 (18.0)
–– 81.6 (10.8) – 58.8
25 2 2 41.0 (16.8) –– 85.1 (9.3) – 63.1
26 2 2 54.0 (15.8) –– 89.4 (6.2) 2.0% 71.7
27 2 2 45.3 (13.7) –– 85.4 (9.1) 0.5% 65.3
28 2 2 44.6 (13.7) –– 85.5 (8.6) – 65.1
Spirit 29 2 3 47.5 (15.0) – 87.1 (7.6) 1.0% 67.3
30 2 3 46.6 (14.3) – 86.0 (8.6) – 66.3
Verbal Expr. 31 2 2 52.3 (12.7) – 87.0 (7.2) 2.0% 69.7
32 2 2 46.1 (16.7) – 87.2 (7.2) 0.5% 66.6
Joy 33 3 2 14.9 (8.7) 50.9 (9.6) 85.3 (8.5) – 50.1
34 3 2 18.7 (9.8) 53.6 (8.3) 83.2 (9.7) – 51.0
35 2 2 35.5 (16.8) –– 83.6 (10.6) – 59.5
36 2 2 64.4 (13.0) – 91.5 (4.8) 3.9% 77.9
Anger 37 2 2 39.6 (19.8) –– 85.5 (8.4) – 62.6
38 2 2 46.8 (16.8) –– 87.8 (7.3) 3.0% 67.3
39 2 2 36.0 (18.8) –– 84.9 (9.7) – 60.5
40 2 2 42.0 (16.0) –– 87.5 (8.4) – 64.7
41 3 2 12.2 (10.3) 52.3 (9.0) 87.9 (7.4) – 50.0
Depression 42 2 2 14.6 (9.7) –– 63.5 (17.7) – 39.1
43 3 2 16.2 (10.8) 55.8 (10.6) 88.9 (6.7) – 52.5
44 2 2 35.8 (18.7) – 87.1 (9.6) – 61.5
45 2 2 43.2 (19.3) – 88.4 (7.2) 0.5% 65.8
46 3 2 16.7 (10.4) 56.3 (10.6) 88.0 (6.8) – 52.3
47 2 2 34.4 (17.8) –– 82.1 (10.8) – 58.2
Aschero et al . Health and Quality of Life Outcomes 2010, 8:106
/>Page 7 of 13
TTN by Domain; and the mean of the g found for the
three Domains (g = 1.5).
Discussion
Target Questionnaire: Translation Procedure
Questionnaire translation can be dealt with by many dif-
ferent approaches, from the classical back-translation
pioneered by Brislin forty y ears ago [19] to the more
recent TRAPD procedure and its stems [6,9]. Different
approaches are justified by differentgoals,sothatthe
actual goals (and their priority) should always be
declared before beginning the translation work. For a
medical questionnaire, at least three main objectives can
be identified: to preserve “equivalence"; to obtain a psy-
chometric tool “ usef ul” in the clini cs and in clinical
trials; and to attain full “comprehensibility” of the medi-
cal questions. Equivalen ce is what we commonly expect
from a translation. What is really meant depends greatly
on the researcher, so that Herdman et al. could identify
not less than 19 different meanings for this term [10].
Clinical usefulness must be interpreted here as
usefulness for the TCM practitioner. It includes using
the questionnaire as a convenient filing system for ana-
mnesis, but also providing a quantitative outcome for
clinical trials. Comprehensibility is related both to the
TCM theory and to the local cultural context. When a
medical questionnaire is translated from a source to a
target, the source and the target populations often shar e
the same medical paradigms. When this happens, the
three above mentioned objectives are likely not to inter-
act with each other, or to interact minimally. As the
medical theory is shared, the target and source popula-
tions also share a sort of common language.
In our case the situation is different. Not only do we
have to cross the bridge between two totally different
languages, we also have to face different medical para-
digms. The main result is that our three objectives
interact strongly. An excessive effort towards equiva-
lence may be detrimental for comprehensibility. Each
patient interprets questions on the basis of his or her
cultural context. The risk is that an Occidental patient,
when answering a TCM question, misinterprets it, and
Table 3: Cluster Analysis (Continued)
Fear & Anx. 48 3 3 13.9 (10.0) 57.4 (10.3) 88.4 (6.5) – 51.2
49 3 3 12.8 (9.5) 49.5 (7.6) 84.1 (8.7) – 48.5
50 3 3 12.6 (6.9) 47.3 (8.1) 84.3 (9.7) – 48.5
Optimal number of clusters identified by Two-step Cluster Analysis, applied either by item (columns 3) or by Facet (column 4). The centroids in the former case
are reported, for each cluster. The number of outliers, if any, is expressed as percentage over the 203 respondents. The last column shows the mean of the
external centroids (clusters 1 and 3).
Table 4 Additivity and Tukey’s correction factor g
untransformed scores transformed scores
Facet n. of items Friedman’s c
2
p g using g by Facet using g by Domain using constant g = 1.5
Complexion 4 4.07 0.04 1.782 0.80 0.47 0.45
Sleep 3 0.81 0.37 2.090 0.71 0.93 0.91
Stamina 6 9.82 0.00 1.598 0.23 0.16 0.14
Appetite 4 0.39 0.54 1.327 0.80 0.94 0.93
Climate 3 0.21 0.64 1.143 0.88 0.59 0.61
Consciousness 3 1.23 0.27 1.737 0.55 0.59 0.44
Thinking 5 2.07 0.15 1.386 0.99 0.24 0.72
Spirit 2 3.01 0.09 2.401 0.49 0.29 0.20
Verbal Expr. 2 7.44 0.01 2.740 0.26 0.07 0.04
Joy 4 48.81 0.00 2.465 0.00 0.00 0.00
Anger 5 14.93 0.00 1.946 0.10 0.00 0.01
Depression 6 12.63 0.00 0.586 0.29 0.00 0.00
Fear & Anx. 3 0.56 0.46 0.665 0.65 0.39 0.27
Domain
Physical form 20 13.81 0.00 1.522 0.35 0.35 0.30
Vitality & Sp. 12 9.60 0.00 1.811 0.83 0.83 0.26
Emotion 18 1.51 0.22 1.156 0.52 0.52 0.64
The Tukey’s test for non-additivity is applied by Facet and by Domain, on the original untransformed score. Non-additivity is found in 6 out of 13 Facets and 2
out of 3 Domains (p-level 0.05). The three last columns show the p-level from the same test, but applied on scores transformed with different corrective factors g.
Third last column: uses g from the previous column, same row; penultimate column: g from the previous column, but by Domain (last three rows); last column:
flat constant g = 1.5.
Aschero et al . Health and Quality of Life Outcomes 2010, 8:106
/>Page 8 of 13
therefore does not provid e what is actually useful for
the TCM practitioner. These interaction mechanisms
are at work in any translation, but may be particularly
relevant here. Given the unfeasibility of reaching the
three objectives at the same degree simultaneously, a
choice of priorities must be made explicit. Of course,
this choice influences the selection of the translation
procedure.
Our first priority was clinical usefulness. Equivalence
was of course a concern, but in suborder. Generally
speaking, equivalence is desirable “for the cross- cultural
comparison of results to be valid” [10]. The idea is that
scores from different trials might be compared, for
example in multicentre trials. As the questionnaire, con-
ceived in a Chinese cultural context, was applied to
Occidental patients, serious threats to equivalence were
to be expected anyway. Therefore, we decided that giv-
ing priority to the equivalen ce issues would be inadvisa-
ble, whenever compre hensibili ty and clinical usefulness
were at stake. This does not necessarily imply that
equivalence is not ensured, but equivalence will have to
be substantiated a posteriori. The specific case of opera-
tional equivalence is considered in the next section.
A modified TRAPD procedure was considered more
suitable than a back-tr anslation, in order to achi eve our
objectives. Weaknesses and inadequacies of back-trans-
lation have been summarized by Harkness et al. (see
[20], page 468). Ponce et al. discuss some potential flaws
of back-translation, and clearly warn that “translators
have an incentive to choose word-for-word translations
instead of striving for concept equivalence” [21].
The original Chinese version is written with clear
and concise wording. This is due partly to the nature
of the TCM lexicon, which rarely uses specialized
words to designate syndromes, and partly to the origi-
nal authors, who obviously made an effort to simplify
questions. This is one of the reasons why we consid-
ered it safe to rely on one main translation only. In
fact, the entire process up to the final version was not
a direct, straightforward translation. It was a careful
balancing of the linguistic issues, of the psychometric
characteristics, and of the adaptation to the cultural
(and medical) context. The main translation could
have been the final version, but the secondary transla-
tion emphasized issues of measurement equivalence,
and the team discussions delved more deeply into
adherence to TCM theory. It is only the harmonious
fusion of these three aspects what allowed a meaning-
ful and useful final version. This attempt of fusion is
the core of our translation, when compared with other
procedures. Of course, we do not recommend our
method for the general case. It would be unnecessarily
burdensome and time-consuming. However, it proved
to be efficient for the ChQoL. We suggest its use
whenever the translation targets deeply different cul-
tures, with very different medical contexts.
Target Questionnaire: Response Scales
The response scale originally proposed for the ChQoL
was a five-point Likert scale [2]. In this work, we inten-
tionally adopted a VAS. Ap art from a cautious consid-
eration of the general advantages and disadvantages (a
critical discussion of VAS can be found in [22-24]), our
choice to depart from the original scale was motivated
by four reasons.
First, we were particularly interested in the actual
score distribution. Several items ask questions which,
although perfectly intelligible, are rarely related to
HRQoL in Occidental countries. For example, were the
respondents able to utilize the entire continuous scale?
And, if so, how widespread was this practice among
respondents? Did they simplify their task assuming an
essentially dichotomous model of good/poor health? A
five-point Likert scale, which provides ordinal data,
could in principle answer some of these questions, but a
continuous scale was considered more suitable for our
purpose.
Second, in the initial round of debriefing interviews
wefoundsomeresistancetothe five-point Likert scale.
Several respondents found t his scoring method unna-
tural, especially when the question concerned expressing
emotions. The threat of annoyance is really important
for our O.R. Unit, because of the poor health conditions
and the high psychological reactivity of some patients.
Third, a VAS is known to be sensitive and reproduci-
ble [25-28]. It i s widely used in oncology, even for mul-
tidimensional instruments [29]. In some cases, like pain
assessment, a VAS is preferable to other kinds of s cale,
because it provides a closer description of the patients’
experiences [30]. These characteristics are particularly
useful in TCM clinical trials. TCM therapies may bring
clinical results which, in the short term, are weaker than
those brought by ma ny pharmacological therapies. In
these cases, a higher psychometric sensitivity is
obviously of help.
Fourth, the respondents dealing with an analogue
scale in a test-retest have less chance to recall their pre-
vious answers in order to show consistency [24]. Test-
retest is an important aspect of reliability. Although we
do not consider it in this paper, we are planning to
investigate the problem in the future.
Our interpretation of the preference for the VAS
among our patients is that evaluating our emotional sta-
tus requires placing ourselves i n a continuum. With the
Likert scale, the respondent has to mentally adapt each of
the 5 responses to an emotional status, and then decide if
that answer “fits”. The same question is likely to be re-
read more ti mes (possibly f ive, with really ina ttentive
Aschero et al . Health and Quality of Life Outcomes 2010, 8:106
/>Page 9 of 13
respondents). With the continuous VAS the respondent
only has to spot the correct orientation of the scal e
regarding the question. The task requires less linguistic
and comprehension efforts, and is more intuitive and
straightforward. On the whole, it is less stressful.
This interpreta tion is founded on explicit feedback
from the respondents during the first round of the ret-
rospective debriefing interviews. One common comment
was that joy, a nger, depression or fear (items 33 to 50)
arehardlyquantifiablebytickingboxes.Otherrespon-
dents felt “forced” into one of the five choices, which
was unpleasant for them. However, results from other
researchers contrast with our interpretation. Guyatt et
al. [31] consider filling Likert scales more intuitive than
selecting a position on a continuous line. Children and
elderly people have been reported to prefer a Likert
scale to a VAS, or to have problems understanding the
VAS itself [32-35]. Gift reviews some difficulties
reported for VAS [17]. G enerally speaking, the prefer-
ence for one scale towards another depends both on the
scale and on the respondents. It is likely that different
groups react in different ways. Our group was made of
female oncological patients, and comparative studies
with different groups could help clarify this point.
Another departure from the Chinese source lies in the
orientatio n of the response scales . In the ChQoL-CN, 22
items out of 50 had a reverse (i.e. negative) polarity, the
highest score corresponding to the poorest health status.
Sometimes questionnaires are designed in such a way
that polarity is reversed in approximately 50% of the
items, in an attempt to force the respondent to pay more
attention to the question, and avoid bias. This was not
the original aim of the Chinese authors, as apparent from
the distribution of t he scales among Facets. In the
ChQoL-CN, all items in Facets “Complexion” (4 items)
and “Joy” (4 items), as well as in all the 4 Facets included
in the “Vitality & Spirit” Domain (12 items), are positively
oriented, whilst the Facets “Depression” (6 items) and
“Fear” (3 items) show a reversed orientation. Obviously
the developers’ main goal was to optimize the response
scale within the single Facet, whenever possible.
During the first round of debriefing interviews, it was
found that the change in orientation from one item to
another was confusing for many respondents and led to
erroneous scoring. Consequently we decided to make all
response scales conform to a positively oriented scale.
This required the rephrasing of 22 questions. The sec-
ond round of debriefing interviews showed no further
problems concerning response scales.
Target Questionnaire: Equivalence
Assessing questionnaire equivalence is not an easy task.
A convenient framework for equivalence is provided by
Herdman et al. [11]. These authors identify six key types
of equ ivalence: Conceptual, Item, Semantic, Operational,
Measurement, and Functional. An exhausti ve discussion
ofequivalenceforthetwoChQoLversionsmustbe
deferred to another paper. This discussion would also
require more experimental data. Nonetheless, there are
a few points which can be discussed here. They may
bring to light some limitations of the present work.
Operational equivalence is the main issue. This kind
of equivalence refers to “the possibility of using a similar
questionnaire format, instruct ions, mode of administra-
tion and measurement methods” [11]. Adopting a VAS
instead of a 5-point Likert scale, and rewording several
items to conform to a pos itively oriented scale does not
necessarily mean that full Operational equivalence has
been waived. A VAS and a 5-point Likert scale cannot
be claimed to be equivalent, a priori. Hasson et al. show
that a replacement of Likert scales with VAS is actually
possible, but interchangeability is not necessarily
ensured[36].Lundetal.compareaVASwithaverbal
rating scale, and find systematic disagreements when the
VAS is transformed into a categorical scale [37].
Our adoption o f a VAS was a trade-off between the
full exploitation of the ChQoL psychometric potential
for Italian patients and the aprioristic preservation of
Operational equivalence . At this stage we are more
interested in the former issue than in the latter. Our
aim was to find a final version where the Italian patient
would understand the significance of each question in
exactly the same way as the Chinese patient. Within
Herdman’s framework, we tried to favor Conceptual and
above all Semantic equivalence. Conceptual equivalence
ensures that questions have “ thesamerelationshipto
the underlying concept in both cultures”, whilst Seman-
tic equivalence “is concerned with the transfer of mean-
ing across languages, and with achieving a similar effect
on respondents in different languages” [11]. Our choice
for a VAS and for a positive orientation of items was
based on our relational experience with our patients,
but it was particularly guided by the quotation above,
regarding Semantic equivalence.
Our conclusions are founded on a specific sample.
First of all, our respondents were Occidental patients.
We by no means suggest that our choices are optimal
for other cultures. E.g., Wong et al. [5] studied the valid-
ity of the ChQoL in Hong Kong. In that context, it
would have made no sense for Wong and colleagues to
adopt our (or similar) choices for the response scales.
These choices are useful for the Italian cultural context,
but they may be totally unnecessary in different cultures.
Secondly, our sample is made up of female oncological
patients, with a recent breast cancer diagnosis. We
selected this sample because we deal with this kind of
patient on a daily basis. Of course this sample is not
generic, and it has peculiar characteristics. These
Aschero et al . Health and Quality of Life Outcomes 2010, 8:106
/>Page 10 of 13
patients may show heavy emotional and psychological
suffering. They also may experience postural problems
and limb disability. In a sense, our sample was a sort of
“worst case benchmark” fortheChQoL.Ourfindingis
that the ChQoL is robust enough to be app licable to
this kind of patient, provided that some modifications to
the response scale are implemented. Future research
may find that no advantage is gained from the modified
response scales, whenever the sample comprises generic
patients only. The numerical results in Table 1 should
not be taken as a norm for generic populations. Our
opinion is that equivalence (as a whole) can be pre-
served more with our changes to the r esponse scales
than without. A literal translation is not necessarily
faithful, as it may not preserve Semantic equivalence.
We may be mistaken. Ho wever, an experimental com-
parison of our results (on a wider and more generic
sample) with those obtained from a Chinese cultural
context is necessary to solve this issue. Until this com-
parison is completed, full equivalence between the
ChQoL-IT and the ChQoL-CN cannot be claimed, and
the ChQoL-IT should not be used for cross-cultural
comparative studies.
Clinical testing: Scores and Distribution
The raw scores are not normally distributed. The choice
of a VAS instead of a Likert scale efficiently highlights
this point. The ChQoL capability to reveal floor and
ceiling effects is in fact of great psychometric interest.
These effects may reflect the presence of psychological
resistances. Being able to unveil these resistances is par-
ticularly useful for the clinical psychologist dealing with
frail patients, as oncological patients often are.
Severe deviations from normality, including skewness
and ceiling effects, are not uncommon in Patient
Reported Outcomes (e.g. [38,39]). Usually they can be
reduced by modifying the response scales (e.g. [40,41]).
However, more than just simple skewness, here we d eal
with a multimodal distribution. All shapes in Figure 2
are consistent with a superimposition of two or three
bell-shaped curves. The Two-step Cluster Analysis con-
firms that the score distribution for 35 items is opti-
mally split up into 2 clusters, and for 15 items into 3.
One possible interpretation is that the respondents of
the ChQoL are faced with unusual questions, which to
them are seemingly unrelate d to HRQoL. As a resul t,
the respondents tend to simplify their task, dichotomiz-
ing their responses a s being “yes or no”.Someofthe
items generate more indecision than o thers, so that a
third intermediate peak is possibly found in the score
distribution. As a whole, a th ree-peak model seems rea-
sonable for all items, with a chance that one (or even
two) peaks turn out to be too low to be detected. If this
model holds, a 3-point Lik ert s cale is naturally
suggested. Its adoption would make the ChQoL nimbler,
and simplify data collection. It would also make localiza-
tion in other languages easier. A drawback could be
reduced sensitivity to changes, or reduced discriminabil-
ity among individuals. It has been reported that placebo
effects may sometimes remain undetected when using
strictly binary outcomes, whilst they are detected when
using continuous outcomes [42].
Clinical testing: Additivity
In a Tukey’s test, additivity is conceived as a lack of inter-
action between the respondents and the items, in the fra-
mework of a linear model. Additivity is a desirable
property, because it simplifies handling of missing data
and development of concise indexes to sum up a scale.
The main result from Table 4 is that almost o ne half of
the Facets ("Complexion” and “Stamina"; “Verbal Expres-
sion"; “Joy”, “Anger” and “Depression”) shows evidence of
non-additi vity. This sugge sts that using raw ChQoL data
as outcomes in a clinical trial is not advisable. Raw scores
should undergo some kind of pre-analysis correction. A
corrective factor g is provided by the TTN itself. Its aim
is to yield additivit y. When an Anscombe-Tukey t rans-
formation is applied, i.e. when all scores within one Facet
are raised to g, additivity is achieved for all Facets but
“Joy”. In fact, the transformation suggested by the TTN is
not necessarily helpful for reducing non-additivity. The
TTN assumes a quadratic model for the hypothetical
respondent-by-item i nteraction. If the actual kind of
non-additivity is different, the Anscombe-Tukey transfor-
mation may be ineffective. We can infer that there is a
complex kind of respondent-by-item interaction for this
Facet. Additivity can be a chieved at p ≥ 0.05 using g ≃
3.9, but of course such a high g heavily distorts the fre-
quency distribution, and it is not of any practical use. It
should be noted that Facet “ Joy” belongs to the Emo-
tional Domain: evaluating and expressing emotions is not
an easy task, and a strong respondent-by-item interaction
is more plausible than for the other two Domains.
Obtaining additivity for 12 out of 13 Facets is a satis-
factory result. Nonetheless the g values are tailored to
our specific sample, a nd they are all different. In order
to make practical applications easier, we explored two
alternatives. The first is to compute g at the Domain
level, and not at the Facet level. Then the g can be
applied either to the pool of items within one Facet or
to the pool of items within one Domain, and the TTN
can be run again. When applied within Facet, problems
are again encountered for Facet “ Joy”, and additionally
for “Anger” and “ Depression” too. All these Facets
belong to the Emotional Domain. When applied w ithin
Domain (g in Table 4, penultimate column, three last
rows), full additivity is finally achieved. The second
alternative is to try a flat g = 1.5 (which is the mean of
Aschero et al . Health and Quality of Life Outcomes 2010, 8:106
/>Page 11 of 13
the three g found for the three Domains). When pro-
ceeding by Facet, the statistical significance is too low (p
< 0.05) for three Facets in the Emotional Domain, and
also for one Facet in the Vitality & Spirit Domain.
When proceeding b y Domain, the test significance is
acceptable, although for the Vitality & Spirit Domain it
is lower than before (p = 0.26 versus p = 0.83).
Altogether, a constant g = 1.5 seems a practical choice.
It provides additivity at the Domain level, which is our
main interest. It is low enough not to excessively distort
data. Given Table 4, it lies inside a full range of accepta-
ble g, so increasing the chances of applicability to differ-
ent populations of patients. We suggest that an
Anscombe-Tukey transformation with g = 1.5 is appli ed
to the ChQoL-IT scores whenever the scores are used
to estimate missing data or to provide summary indexes
for the three Domains. This (or an equivalent) kind of
transformation has been shown to be necessary for our
specific sample of female p atients suffering from breast
cancer, in order to recover additivity. When dealing
with different populations, the necessity and a dvisability
of a g = 1.5 transformation should of course be checked.
Conclusions
The applicability of TCM questionnaires to Occidental
patients should not be taken for granted, as cultural differ-
ences may play a decisive role. Clinical usefulness, com-
prehensibility, and adherence to the original source
represent important but possibly competing requirements.
We propose a customized translation procedure in order
to meet these requirements. The resul ting Italian version
of the ChQoL questionnaire has proven to be comprehen-
sible and meaningful for the Occidental layperson, and
applicable to a sample of female oncological patients suf-
fering from breast cancer. Scales for this sample show evi-
dence of non-additivity, but additivity is recoverable with a
simple g = 1.5 Anscombe-Tukey transformation. The tasks
of estimating missing data and of constructing summary
scores are consequently simplified. The translated ques-
tionnaire can therefore be adopted in clinical trials, to pro-
vide quantitative outcomes for TCM.
Our results are based on a VAS, but we show that a
simpler 3-point Likert scale also provides a good descrip-
tion of data. In both cases, we relinquish Operational
equivalence regarding the original source questionnaire,
which uses a 5-point Likert scale. More research is
needed to fully asse ss the five other types of equivalence,
and also to shed light on certain reliability issues.
Additional material
Additional file 1: Final Italian version of the ChQoL.
Abbreviations
ChQoL: Chinese Quality of Life questionnaire; TCM: Traditional Chinese
Medicine; HRQoL: Health Related Quality of Life; O.R.: Oncological
Rehabilitation; VAS: Visual Analogue Scale; TTN: Tukey’s Test for Non-
additivity.
Acknowledgements
We wish to thank the head of the Oncological Rehabilitation Unit, G. Forno,
MD, for making this work possible and for providing valuable advice. The
help and assistance from the entire staff of the O.R. Unit are also gratefully
acknowledged. Associazione Studio Interculturale QiGong (ASIQ, Genova,
Italy) covered the article-processing charges, imposing no constraint or
limitation whatsoever.
Author details
1
Istituto Nazionale per la Ricerca sul Cancro, S.S. di Riabilitazione Oncologica,
Viale Rosanna Benzi 10, I-16132 Genova, Italy.
2
Sacmar srl, Via Keplero 7, I-
20019 Settimo Milanese, Italy.
Authors’ contributions
All authors participated in each of the team discussions. FF and MGV led the
clinical discussions, conducted or supervised the interviews and the
debriefing sessions, and managed all the interactions with patients. AW
provided the main translation, led the reconciliation and adjudication
meetings, and took care of the linguistic aspects. GA conceived of the study,
provided the secondary translation, supplied data analysis, and coordinated
the team. All authors contributed to drafting the manuscript. All authors
read and approved the final manuscript.
Competing interests
The authors declare that they have no competing interests.
Received: 16 January 2010 Accepted: 25 September 2010
Published: 25 September 2010
References
1. Aaronson NK, Ahmedzai S, Bergman B: The European Organization for
Research and Treatment of Cancer QLQ-C30: a quality of life instrument
for use in international clinical trials in oncology. J Natl Cancer Inst 1993,
85:365-376.
2. Leung KF, Liu FB, Zhao L, Fang JQ, Chan K, Lin LZ: Development and
validation of the Chinese Quality of Life instrument. Health Qual Life
Outcomes 2005, 3:26.
3. Zhao L, Chan K, Leung KF, Liu FB, Lang JY, Fang JQ: The Chinese Quality
Of Life instrument: development of a new health-related quality Of life
instrument using Factor Analysis and Structural Equation Modeling. J
Complement Integr Med 2005, 7:1-22[ />2].
4. Zhao L, Leung KF, Liu FB, Chen J, Chan K: Responsiveness of the Chinese
Quality of Life instrument in patients with congestive heart failure. Chin
J Integr Med 2008, 14(3):173-179.
5. Wong W, Lam CLK, Leung KF, Zhao L: Is the content of the Chinese
Quality of Life Instrument (ChQOL) really valid in the context of
traditional Chinese medicine in Hong Kong? Complement Ther Med 2009,
17:29-36.
6. Round 4 ESS Translation Strategies and Procedures. [http://www.
europeansocialsurvey.org/].
7. Harkness J, van de Vijver F, Mohler PP, (Eds): Cross-cultural survey methods,
Volume 325 of Wiley Series in Survey Methodology John Wiley & Sons 2003.
8. Harkness JA: Trapped in translation? ESS translation protocols Provide a
Key. Proceedings of the Sixth International Conference on Social Science
Methodology: 16-20 Aug 2004; Amsterdam 2004.
9. Willis G, Brick PD, Norberg A, Stark D, Kudela MS, Forsyth B, Levin K,
Berrigan D, Thompson F, Lawrence D: Evaluation of a multi-step survey
translation process. Proceedings of the International Conference on Survey
Methods in Multinational, Multiregional, and Multicultural Contexts (3MC): 25-
28 June 2008; Berlin, Germany 2008, 191-208.
10. Herdman M, Fox-Rushby J, Badia X: ’Equivalence’ and the translation and
adaptation of health-related quality of life questionnaires. Qual Life Res
1997, 6:237-247.
Aschero et al . Health and Quality of Life Outcomes 2010, 8:106
/>Page 12 of 13
11. Herdman M, Fox-Rushby J, Badia X: A model of equivalence in the
cultural adaptation of HRQoL instruments: the universalist approach.
Qual Life Res 1998, 7:323-335.
12. Eremenco SL, Cella D, Arnold BJ: A comprehensive method for the
translation and cross-cultural validation of health status questionnaires.
Eval Health Pro 2005, 28:212-232.
13. Campanini G: Comparazione tra valutazione soggettiva delle
performance e valutazione obiettiva in pazienti afferenti alla
Riabilitazione Oncologica. Master’s thesis Università degli Studi di Genova,
Facoltà di Medicina e Chirurgia, Corso di Laurea in Fisioterapia 2007.
14. Tukey JW: One degree of freedom for non-additivity. Biometrics 1949,
5:232-242.
15. Anscombe F, Tukey J: The examination and analysis of residuals.
Technometrics 1963, 5(2):141-160.
16. Edwards JN, Herman JA: The effectiveness of patient controlled
antiemetic therapy in patients receiving chemotherapy. S C Nurse 1988,
3:22.
17. Gift AG: Visual Analogue Scales: measurement of subjective phenomena.
Nurs Res 1989, 38(5):286-288.
18. Conover WJ, Johnson ME, Johnson MM: A comparative study of tests for
homogeneity of variances, with applications to the outer continental
shelf bidding data. Technometrics 1981, 23:351-361.
19. Brislin R: Back-translation for cross-cultural research. J Cross-Cult Psychol
1970, 1:185-216.
20. Harkness J, Pennell BE, Schoua-Glusberg A: Survey questionnaire
translation and assessment. In Methods for testing and evaluating survey
questionnaires. Edited by: Presser S, Rothgeb JM, Couper MP, Lessler JT,
Martin E, Martin J, Singer E. John Wiley 2004:453-473.
21. Ponce NA, Lavarreda SA, Yen W, Brown ER, DiSogra C, Satter DE: The
California Health Interview Survey 2001: translation of a major survey for
California’s multiethnic population. Public Health Rep 2004, 119:388-395.
22. Wewers ME, Lowe NK: A critical review of Visual Analogue Scales in the
measurement of clinical phenomena. Res Nurs Health 1990, 13(4):227-36.
23. Waltz CF, Strickland O, Lenz ER: Measurement in nursing and health research
New York: Springer Publishing Company 2005.
24. DeVellis RF: Scale development: theory and application, Volume 26 of Applied
Social Research Methods series Thousand Oaks, CA: Sage Publications, 2
2003.
25. Collins S, Moore A, McQuay H: The visual analogue pain intensity scale:
what is moderate pain in millimeters? Pain 1997, 72:95-97.
26. Grant S, Aitchison T, Henderson E, Christie J, Zare S, McMurray J, Dargie H:
A Comparison of the reproducibility and the sensitivity to change of
Visual Analogue Scales, Borg scales, and Likert scales in normal subjects
during submaximal exercise. Chest 1999, 116:1208-1217.
27. Good M, Stiller C, Zauszniewski JA, Anderson GC, Stanton-Hicks M, Grass JA:
Sensation and distress of pain scales: reliability, validity and sensitivity. J
Nurs Meas 2001, 9(3):219-238.
28. Vogelsang J: The Visual Analog Scale: an accurate and sensitive method
for self-reporting preoperative anxiety. J Post Anesth Nurs 1988, 3:235-9.
29. Hauser K, Walsh D: Visual analogue scales and assessment of quality of
life in cancers. J Support Oncol 2008, 6:277-282.
30. Ohnhaus EE, Adler R: Methodological problems in the measurement of
pain: a comparison between the verbal rating scale and the Visual
Analogue Scale. Pain 1975, 1:379-84.
31. Guyatt GH, Townsend M, Berman LB, Keller JL: A comparison of Likert and
Visual Analogue Scales for measuring change in function. J Chronic Dis
1987, 40:1129-33.
32. van Laerhoven H, van der Zaag-Loonen HJ, Derkx BH: A comparison of
Likert scale and Visual Analogue Scales as response options in children’s
questionnaires. Acta Paediatr 2004, 93(6):830-835.
33. Shields BJ, Cohen DM, Harbeck-Weber C, Powers JD, Smith GA: Pediatric
pain measurement using a Visual Analogue Scale: a comparison of two
teaching methods. Clin Pediatr 2003, 42(3):227-34.
34. Brunier G, Graydon J: A comparison of two methods of measuring
fatigue in patients on chronic haemodialysis: visual analogue vs Likert
scale. Int J Nurs Stud 1996, 33:338-48.
35. Johansson M, Finizia C, Degl’Innocenti A, Rydén A: Is a line the same as a
box? Speech assessment by VAS is not superior to Likert scales in
laryngeal cancer patients. Med Sci Monit 2007, 13(11):CR481-487.
36. Hasson D, Arnetz BB: Validation and findings comparing VAS vs. Likert
scales for psychosocial measurements. Int Electron J Health Educ 2005,
8:178-192.
37. Lund I, Lundeberg T, Sandberg L, Budh CN, Kowalski J, Svensson E: Lack of
interchangeability between visual analogue and verbal rating pain
scales: a cross sectional description of pain etiology groups. BMC Med
Res Methodol 2005, 5:31.
38. Atkinson MJ, Sinha A, Hass SL, Colman SS, Kumar RN, Brod M, Rowland CR:
Validation of a general measure of treatment satisfaction, the Treatment
Satisfaction Questionnaire for Medication (TSQM), using a national panel
study of chronic disease. Health Qual Life Outcomes 2004, 2:12.
39. Petterson T, Lee P, Hollis S, Young B, Newton P, Dornan T: Well-being and
treatment satisfaction in older people with diabetes. Diabetes Care 1998,
21:930-935.
40. Pouwer F, Snoek FJ, Heine RJ: Ceiling effect reduces the validity of the
Diabetes Treatment Satisfaction Questionnaire. Diabetes Care 1998,
21(11):2039.
41. Bradley C: Diabetes Treatment Satisfaction Questionnaire. Change
version for use alongside status version provides appropriate solution
where ceiling effects occur. Diabetes Care 1999, 22(3):530-531.
42. Hróbjartsson A, Gøtzsche PC: Is the placebo powerless? An analysis of
clinical trials comparing placebo with no treatment. N Engl J Med 2001,
344(21):1594-1602.
doi:10.1186/1477-7525-8-106
Cite this article as: Aschero et al.: The ChQoL questionnaire: an Italian
translation with preliminary psychometric results for female oncological
patients. Health and Quality of Life Outcomes 2010 8:106.
Submit your next manuscript to BioMed Central
and take full advantage of:
• Convenient online submission
• Thorough peer review
• No space constraints or color figure charges
• Immediate publication on acceptance
• Inclusion in PubMed, CAS, Scopus and Google Scholar
• Research which is freely available for redistribution
Submit your manuscript at
www.biomedcentral.com/submit
Aschero et al . Health and Quality of Life Outcomes 2010, 8:106
/>Page 13 of 13