Accounting and Finance for Your Small Business Second Edition_2 pptx
Bạn đang xem bản rút gọn của tài liệu. Xem và tải ngay bản đầy đủ của tài liệu tại đây (427.11 KB, 25 trang )
of the current year. Request a return date of 10 days in the
future for this information.
3. Capital expenditure update. As of mid-November, issue a form to all
department heads, requesting information about the cost and
timing of capital expenditures for the upcoming year. Request a
return date of 10 days in the future for this information.
4. Automation update. As of mid-November, issue a form to the man-
ager of automation, requesting estimates of the timing and size
of reductions in headcount in the upcoming year that are due to
automation efforts. Request a return date of 10 days in the future
for this information. Be sure to compare scheduled headcount
reductions to the timing of capital expenditures, since they should
track closely.
5. Update the budget model. These six tasks should be completed by
the end of November:
• Update the numbers already listed in the budget with infor-
mation as it is received from the various managers. This may
involve changing “hard coded” dollar amounts, or changing flex
budget percentages. Be sure to keep a checklist of who has
returned information, so that you can follow up with those per-
sonnel who have not returned requested information.
• Verify that the indirect overhead allocation percentages shown
on the budgeted factory overhead page are still accurate.
• Verify that the Federal Insurance Contributions Act (FICA),
State Unemployment Tax (SUTA), Federal Unemployment Tax
(FUTA), medical, and workers’ compensation amounts listed at
the top of the staffing budget are still accurate.
• Add job titles and pay levels to the staffing budget as needed,
along with new average pay rates based on projected pay levels
made by department managers.
• Run a depreciation report for the upcoming year, add the
expected depreciation for new capital expenditures, and add
this amount to the budget.
• Revise the loan detail budget based on projected borrowings
through the end of the year.
6. Review the budget. Print out the budget and circle any budgeted
expenses or revenues that are significantly different from the
Budgeting for Operations
CHAPTER
1
7
p01.qxd 11/28/05 1:37 PM Page 7
Preparing to Operate the Business
annualized amounts for the current year. Go over the question-
able items with the managers who are responsible for those
items.
7. Revise the budget. Revise the budget, print it again, and review it
with the president. Incorporate any additional changes. If the
cash balance is excessive, you may have to manually move
money from the cash line to the debt line to represent the pay-
down of debt.
8. Issue the budget. Bind the budget and issue it to the management
team.
9. Update accounting database. Enter budget numbers into the
accounting software for the upcoming year. All tasks should be
completed by mid-December.
1
Once the budget has been completed, there must be a feedback
loop that sends budget variance information back to the depart-
ment managers. The best feedback loop is to complete a budget to
actual variance report that is sorted by the name of the responsible
manager (see Figure 1.8 on page 24) as soon as the financial state-
ments have been completed each month. The controller should
take this report to all of the managers and review it with them,
bringing back detailed information about each variance, as re-
quested. Finally, there should be a meeting as soon thereafter as
possible between the responsible managers and senior manage-
ment to review variance problems and what each of the managers
will do to resolve them. The senior managers should write down
these commitments and return them to the managers in memo
form; this document forms the basis for the next month’s meeting,
which will begin with a review of how well the managers have
done to attain the targets to which they are committed. A key fac-
tor in making this system work is the rapid release of accurate
financial statements, so that the department managers will have
more time to respond to adverse variance information.
SECTION
I
8
1
Reprinted with permission from Bragg, Steven, The Design and Maintenance
of Accounting Manuals, 1999 Supplement (New York: John Wiley & Sons, 1999),
pp. 64–66.
p01.qxd 11/28/05 1:37 PM Page 8
Responsibility Accounting
Responsibility accounting means structuring systems and reports to
highlight the accountability of specific people. The process involves
assigning accountability to departments or functions in which the
responsibility for performance lies.
Specific responsibility is a necessary concept of management
control. Accounting encompasses at least three purposes: financial
reporting, product or service cost reporting, and performance eval-
uation reporting. The third function of accounting, the perfor-
mance measurement function, is closely related to the operational
function of the business. Since many businesses now evaluate and
manage employees by objectives, the need for more sophisticated
performance measurement tools has increased.
In a management-by-objectives (MBO) system, the individual
must have the authority necessary to carry out the responsibility he
or she is asked to execute. Without the necessary authority, a per-
son cannot, and should not, be expected to meet the responsibili-
ties imposed.
Within this level of responsibility, a person can be evaluated
only when the performance reporting system is tied to the expected
level of performance. A person’s actual performance is keyed to this
budget expression of expected performance.
Responsibility accounting should not be restricted to any one
management level but should measure expected performance
throughout the hierarchy of the business. Key indicators can be
built into the system to evaluate performance and to trigger reac-
tions to unanticipated results. In this way, management at each
level is called on to intervene only when it is necessary to correct
problems or substandard performance. This management-by-
exception system frees up significant time for managers to plan and
coordinate other essential business functions.
In contrast with financial accounting, responsibility accounting
does not simply group like costs but instead segments the business
into distinct responsibility centers. A measurement process is estab-
lished to compare results obtained against objectives established for
Budgeting for Operations
CHAPTER
1
9
p01.qxd 11/28/05 1:37 PM Page 9
Preparing to Operate the Business
the segment prior to the end of a plan/budget period. These objec-
tives are part of the operating budget and comprise the targets of
operation for every segment of the business.
To be effective, responsibility accounting must be tailored to
each individual business. The accounting system must be adjusted
to conform with the responsibility centers established. The revenue
and expense categories must be designed to fit the functions or
operations that management believes are important to monitor
and evaluate. For example, the use of electricity by a particular
machine may be significant, and excessive use may be an early
warning sign of a process problem. Management would want to
meter electricity consumption and have the expense reported as a
line item to be measured against standard consumption rates by
machine or by department.
Another function of the responsibility accounting system is to
compile the individual centers’ performance reports into succes-
sively aggregated collective reports to identify broader categories of
responsibility. Behind these groupings is still a great deal of detailed
information available for analysis.
Developing Responsibility Centers
A responsibility center has no standard size. It can be as small as a
single operation or machine or as large as the entire business. The
business is, after all, the responsibility center of the chief execu-
tive of the business. Typically, the business is broken down into a
large number of centers or segments that, when plotted in succes-
sive layers or groupings, look like a pyramid. This pyramiding
represents the hierarchy of authority and responsibility of the
business. Various types of responsibility centers may be established
for various purposes. The nature of the centers or segments can
also vary.
If a person is charged with only the responsibility for the costs
incurred in a process or operation, a cost center has been established.
Cost centers can be line operations (i.e., painting) or staff functions
(i.e., recruiting). The emphasis of a cost center is on producing
goods or providing specific services in conjunction with other phys-
ical measures of performance. Usually there is no direct revenue
SECTION
I
10
p01.qxd 11/28/05 1:37 PM Page 10
production measurement by that center because the center does
not produce the final product.
Another segment is a unit held responsible for the profit contri-
bution it makes. This responsibility center is aptly named a profit
center. Profit centers are often larger units than cost centers because
a profit center requires the production of a complete product or
service to make a contribution to the profit. (However, a salesper-
son could be considered a profit center.) The establishment of a
profit center should be based on established managerial criteria of
revenues and costs.
Other divisions can be established, such as revenue centers and
investment centers. Revenue centers, for instance, are segments of the
larger profit centers charged with the responsibility of producing
revenue. Sales departments are a typical example. An investment
center is a profit center that also has the responsibility of raising and
making the necessary investment required to produce the profit.
This added investment step would require the use of some rate-of-
return test as an objective measure of the center’s performance.
The appropriate establishment of cost centers, profit centers,
and the like is a critical element of the responsibility reporting sys-
tem, and as such must be performed carefully and accurately.
Establishing Costs
Another important aspect of responsibility accounting is the
accumulation of costs. Accountants have labeled the standard
types of costs typically encountered: fixed, variable, and semivari-
able. Within these classifications, some costs may be incurred at
the discretion of specific levels of management whereas others are
nondiscretionary at given levels of management. Sometimes costs
relate to more than one center and must be allocated between
them. The most effective system probably will result when respon-
sible management has been an active participant in the determina-
tion of the allocation of costs and the maintenance of the reporting
system.
One complication of accumulating costs is the problem of trans-
fer pricing. In manufacturing businesses, a cost center’s perfor-
mance is a function of the added costs and the intracompany
Budgeting for Operations
CHAPTER
1
11
p01.qxd 11/28/05 1:37 PM Page 11
Preparing to Operate the Business
movements of raw materials, work-in-progress, finished goods,
and services performed. A market price may not be available or
may be too uncertain, because of fluctuations, to use as an objec-
tive measure of performance. Some compromise is often necessary
to establish transfer prices among departments.
Fixed Costs. A fixed cost is one that does not vary directly with
volume. Some costs are really fixed, such as interest on debt. Other
typically identified fixed costs, such as depreciation expense, may
vary under some circumstances. Generally, over a broad range of
operations, total fixed costs are represented as step functions
because they are incurred in increments as production or the num-
ber of services increases.
This characteristic of fixed costs should not present any great
difficulty. Since production or sales is predicted for a budget period,
the level of fixed costs can be established from graphs such as that
in Figure 1.1. Unfortunately, fixed costs, because of their apparent
static behavior, are not always reviewed regularly and critically to
determine reasonableness. Like all other costs, the larger the
amount of individual fixed costs, the more frequently they should
be reviewed. For example, insurance premiums may vary little, if at
SECTION
I
12
FIGURE 1.1
Fixed Costs
Volume
$
Cost
Fixed Costs that Rise at Specific Volume Levels
p01.qxd 11/28/05 1:37 PM Page 12
all, from year to year and may be paid without reconsideration,
particularly in good times.
Figure 1.2 represents the relationship between the magnitude
of a particular fixed cost and the frequency with which it should be
reviewed. When making such an assessment for yourself, you
should be aware of such factors as the cost of reconsideration in set-
ting the time periods for “seldom” through “often.” The process of
reevaluating insurance coverage may be a significant task, requir-
ing a major allocation of time and resources. However, the returns
could be equally significant if you realize substantial savings result-
ing from a renegotiation of the insurance policy and rates.
Another concern with fixed costs is the method of allocation of
those costs among different products or services. Fixed costs are often
assigned in an arbitrary manner, creating an unrealistic profit or loss
statement for each product. Otherwise, nonprofitable products are
sometimes carried by an “average fixed cost” allocation, which may
not accurately depict costs associated with the product. Accurate
decisions are unlikely without correct information concerning a
Budgeting for Operations
CHAPTER
1
13
FIGURE 1.2
Relationship of Cost to Review Frequency
Seldom
Magnitude of Cost
Low
High
Often
Frequency of Review
p01.qxd 11/28/05 1:37 PM Page 13
Preparing to Operate the Business
product’s costs. You should undertake to allocate fixed costs properly
through the preparation of an operating budget. Your accountant
should have a reasonable understanding of the magnitude of the
costs and of which products or services are affecting the amount.
Also, you should determine how varying activity levels influence the
costs you incur for different products and services.
When analyzing fixed costs, you should determine what causes
that cost to be incurred and what causes it to change in amount.
This analysis will help identify to which product(s) or service(s) the
cost should be assigned and in what manner that allocation should
be made.
For some fixed costs, this will be a very difficult process. Some
administrative costs may simply not be identifiable with any one
product or service. Successive allocations through your costing hier-
archy may be needed to arrive finally at a “product-attributable”
status.
You may treat such costs as variable and determine a rate at
which to assign these costs against labor hours. In determining this
burden or overhead rate, such fixed costs are divided by an esti-
mate or projection of the anticipated direct labor hours and are
allocated proportionately. However, this method may unfairly
assign costs to labor-intensive products, ignoring that more fixed
costs should perhaps be allocated to products with large capital or
fixed investments. Furthermore, this assignment could under-
recover fixed costs by misestimating projected direct labor hours.
Or, equally likely, an overrecovery of fixed costs could occur.
You should take a realistic approach in the allocation of these
costs. If a direct hour allocation is realistic, then use it. If fixed costs
can be identified to particular product(s) or service(s), it is appro-
priate to do so.
Variable Costs. In order to be properly classified as variable, a cost
should meet two distinct criteria:
1. No cost should be incurred until an activity begins.
2. A direct relationship should exist between the amount of the
cost and the level of activity.
SECTION
I
14
p01.qxd 11/28/05 1:37 PM Page 14
An example of a purely variable cost is a sales commission. As sales
increase or decrease, the amount of commission varies in direct
relationship to the level of sales.
The relationship between the cost and the level of production
may be a straight-line relationship, or the cost rate may increase as
the level of output increases. When plotted, this increasing cost
relationship will appear as a curvilinear (or curved shape) graph.
Although this relationship is common to variable costs, Figure
1.3 is not the usual way it is shown. The more usual case is the
straight-line relationship. Often setup costs are spread over produc-
tion, in which case there is a curvilinear relationship; but that is not
the same case. In the setup cost allocation, a fixed cost is spread
over varying units of output, decreasing as the length of the pro-
duction run increases. The earlier example is an increasing cost per
unit as the number of units produced increases.
Typically, costs such as direct labor, scrap costs, packaging, and
shipping are treated as variable costs. However, direct labor and
other costs may not be purely variable. For example, the assumption
Budgeting for Operations
CHAPTER
1
15
FIGURE 1.3
Actual Relationship between Variable Cost
and Level of Production
Variable Costs
Capacity
Dollars
Volume
p01.qxd 11/28/05 1:37 PM Page 15
Preparing to Operate the Business
that direct labor varies directly with the number of units produced
relies on the divisibility assumption. But labor is not infinitely divisi-
ble. If an employee can produce 1,600 units in a standard eight-hour
workday but only 1,200 units are required, unless that employee can
be used in another operation, he or she has been used at a 75 percent
utilization level. Either this idle-time labor can be used effectively in
other places or 25 percent of these (unutilized) efforts are assigned to
fewer units produced. In most cases, direct labor and direct materials
are treated as variable costs for budget purposes even if they are not
perfectly divisible.
If you have established labor standards for your operations,
these can be used for budgeting purposes. By accumulating data
and establishing labor standards, you can begin to target costs. The
difficulty is establishing objective labor-hour targets for the plan-
ning period. Reliance solely on historical data may bias projections,
ignore the effects of the learning curve on efficiency, and avoid
consideration of past inefficiencies.
For planning purposes, remember that the graph of these fixed
and variable costs appears reversed when they are assigned on a per-
unit basis. When variable costs are assigned on a per-unit basis, they
are constant and fixed per unit. When fixed costs are assigned on a
per-unit basis, they vary as production levels change.
Mixed Costs. Mixed costs are those that behave as if they have
fixed and variable components. Many items of cost fall into this cat-
egory. Some people treat mixed costs as fixed costs. If you do so,
you must assume an average or projected level of output and allo-
cate the cost over that level. This may over- or underrecover that
component of fixed cost. Some might say that it is not important
because the over- or underrecovery will be insignificant.
If a consistent bias toward underrecovery of the fixed compo-
nent of one mixed cost exists, underrecovery of the fixed compo-
nent of every mixed cost, allocated on the basis of that misestimated
output level, may exist. If you use these biased data to make capital
investment decisions, marketing and pricing decisions, and expan-
sion or contraction decisions, you may experience serious problems.
It is sometimes difficult to determine what portion of a mixed
cost is fixed and what portion is variable. Fortunately, this allocation
SECTION
I
16
p01.qxd 11/28/05 1:37 PM Page 16
usually can be established from historical data. As an example, data
for the consumption of electricity in one department were tabulated
for the previous six months (see Figure 1.4).
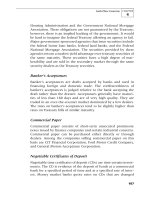
Plotting this consumption (see Figure 1.5), with the Y axis being
kilowatt hours (kWh) consumed and the X axis being the units
produced, the Y intercept is 5,000 kWh. This indicates that for zero
production, the department still consumes 5,000 kWh of electricity
each month, the fixed component of cost.
The variable component can then be determined by using the
formula:
Y = MX + B
Because B, the Y intercept, is 5,000:
Y = MX + 5,000
Substituting any set of values from the table into the equation:
7,500 = M(400) + 5,000
and solving for (M), M = 6.25. Therefore, each unit of production
has a variable component of 6.25 kWh in electrical consumption.
By applying the electric rate to each component of electrical usage,
the fixed- and variable-cost components of the mixed cost are
determined.
Historical Data. One major concern of using historical data as a
basis for future prediction is that the firm may be perpetuating past
inefficiencies. However, historical data may be the best or even the
only data available. When using historical data, you should be sure
that:
• Historical data accurately state the past. An examination must
be made of the conditions under which data were collected and
what is and is not contained in the data.
• Historical data are relevant to what the firm is trying to pre-
dict. To the extent current conditions are not the same as past
Budgeting for Operations
CHAPTER
1
17
p01.qxd 11/28/05 1:37 PM Page 17
Preparing to Operate the Business
SECTION
I
18
FIGURE 1.5
Consumption of Power Graph
800
Units
600
(Thousands)
4002000
1
2
3
4
5
Extentions of
Known Data
6
7
8
9
10kWh
FIGURE 1.4
Consumption of Power Table
kWh Used Units Produced
Jan 7,500 400
Feb 8,000 480
Mar 8,250 520
Apr 8,750 600
May 9,500 720
June 8,750 600
p01.qxd 11/28/05 1:37 PM Page 18
conditions, historical data become more difficult to use in pro-
jecting the future.
• The use of the data encourages performance that improves on
the past performance.
• The effects of inflation are properly considered.
Further practical points in the use of historical data include:
• Avoid using historical data more than 12 months old in periods
of high inflation or deflation.
• Be consistently objective. Do not bias the data by summarily
rejecting data that seem to be out of line. There may be a reason
for unusual numbers.
• Be creative; try not to be bound by traditional thinking. Some of
the relationships between costs and activities may not seem
direct and quantifiable. This could be the result of delayed
billings or nontraditional billings.
• Consider and try using moving averages for data that tend to be
nonlinear or scattered.
• Use extrapolation to project data for future estimated produc-
tion or service levels.
• Never use tools past the point that common sense tells you is
meaningful.
Projecting Revenues
Often firms want a forecast of earnings for the entire enterprise to
compare with the operating budgets. This forecast of revenues
should be reconciled with the operating budget.
The basis of all revenue projections is a sales forecast. Many
companies start the operating budget process by first generating
this sales forecast. The sales forecast is exploded with lead and
lag times added so that departmental schedules are created. This
departmental scheduling of activities is then used to create the
operating budget. For example, Fruit Crate Manufacturing Co., Inc.,
has a maximum production capacity of 1,000 crates per week and
expects this sales forecast:
Budgeting for Operations
CHAPTER
1
19
p01.qxd 11/28/05 1:37 PM Page 19
Preparing to Operate the Business
July Aug
Type A crate 2,000 3,000
To produce a type A crate, the firm’s process breaks down into
three steps: sawing, curing or drying, and assembly. The sawing
and curing is done in batches of 1,000 crates, and the rate of pro-
duction is:
SECTION
I
20
FIGURE 1.6
Exploded Production Schedule
MAY JUNE
Production Schedules
1,000-Crate Batches
JULY AUGUST
AS
D
SA
DD
DD
SA
D
D
SA
DD
D
SA
DD
DDD
p01.qxd 11/28/05 1:37 PM Page 20
Sawing 1,000 crates/1 week
Drying 1,000 crates/3 weeks
Assembly 1,000 crates/1 week
Since all sales are shipped on the first of each month, the exploded
production schedule shown in Figure 1.6 is used for budgeting.
Armed with this operating schedule, the company can plan its
equipment, labor, and materials scheduling, and a budget of expenses
can be generated. For example, in May, two weeks of sawing and one
week of drying must be budgeted; in June, three weeks of sawing,
eight weeks of drying, and two weeks of assembly; and so forth.
As manufacturing and related costs are pushed back in time, the
receipt of payments (cash flows) is pushed forward in time. If Fruit
Crate Manufacturing Co., Inc., offers a 2/10, N/30 payment sched-
ule (2 percent discount if paid within 10 days of invoice, the net
amount due within 30 days), it will ship on July 1, having incurred
expenses in May and June, but not expect payment until July 10 or
August 1. The timing of cash flows, the revenue portion, and the
expense portion of the plan must be coordinated to ensure that
adequate funds are on hand (cashflow budget) to meet expected
operations. For this example, there is a negative cash flow for at
least two and a half months.
Budget Tracking and Maintenance
So far, this chapter has emphasized establishing responsibility and
developing a budget and accounting system that conforms to an
allocation of responsibility. The cardinal principle behind this sys-
tem is that those who are to be measured by the system understand
how it works and agree that the objectives are attainable through
their efforts.
The first requirement should be an integration of your objectives,
goals, and tactics to the managerial level involved. One method for
integration is to have each manager participate in establishing and
maintaining the objectives and goals. The test of reasonableness
should apply. That is, there should be a reasonable likelihood of
obtaining the objective in order to motivate compliance.
Budgeting for Operations
CHAPTER
1
21
p01.qxd 11/28/05 1:37 PM Page 21
Preparing to Operate the Business
An element that often impedes effective budgeting and attain-
ability is the inability to identify controllable and uncontrollable costs
or expenses. Controllable costs should be identified and targeted.
If elements of uncontrollable costs are included in a responsibility-
based budget, they may have a negative motivation factor. Prac-
tically, all revenue and expense factors are controllable by some
manager at some point. However, expenses such as property taxes
may influence profits, yet be beyond the control of an operations
manager. Items such as administrative overhead allocation are
uncontrollable within departments of the firm. As a general rule,
these items should be assigned and accounted for separately, so as
not to indicate responsibility of the manager (e.g., heating, lighting,
janitorial).
The final element in the budget tracking plan is variance analy-
sis and reporting. Variance reporting can take many forms, but the
most common is to compare monthly actuals to monthly projec-
tions with year-to-date comparisons as well. Often the report will
contain space for an explanation of the variance from budget. The
report can be generated in many forms, including by product, by
operation or group, by labor, and by materials. A typical report
could look like the one shown in Figure 1.7.
The report shown in Figure 1.7 compares budgeted to actual
costs by account category, such as repair supplies or insurance.
Although this format is good for determining trends in certain cost
categories, it does not assist in targeting which managers are
responsible for specific costs. An example of a report that includes
this information is shown in Figure 1.8. In this example, we have
used the same expense line items but also added a column that lists
the name of the manager who is responsible for each expense.
Further, we have sorted the report by the names of those man-
agers. This sorting has two purposes:
1. It divides the report into separate pages for each manager, so
that each one can easily group together the expenses for which
he or she is responsible.
2. Sorting the report by manager allows you to summarize vari-
ances for each person, so that senior managers can determine
which managers are doing the best job of keeping their costs
SECTION
I
22
p01.qxd 11/28/05 1:37 PM Page 22
Budgeting for Operations
CHAPTER
1
23
FIGURE
1.7
Budgeted versus Annual Costs
Month
Year-to-Date
Explanations
Budget Actual % Var Budget Actual
% Var
A. Controllable
Direct Labor
Operating Supplies
Repair Labor
Repair Supplies
Heat, Light, Power
Subtotal
B. Raw Materials
Subtotal
C. Overhead
Supervisory Salaries
Corporate Overhead
Taxes
Insurance
Depreciation Expense
Subtotal
Total
p01.qxd 11/28/05 1:37 PM Page 23
24
FIGURE
1.8
Comparison of Budget to Actual, Sorted by Responsibility
Month
Year-to-Date
Expense Description Responsible Budget
Actual % Variance Budget Actual
%
Variance
Manager
Direct Labor
D. Hendricks 25,400 23,000
−9% 177,800 161,000
−9%
Repair Labor
D. Hendricks 8,000 7,250
−9%
56,000 50,750
−9%
Supervisory Salaries D. Hendricks 7,250
7,000
−3%
50,750 49,000
−3%
Totals
40,650 37,250
−8% 284,550 260,750
−8%
Operating Supplies R. Olbermann 1,450
1,500
3%
10,150 10,500 3%
Repair Supplies
R. Olbermann 3,300 3,500
6%
23,100 24,500 6%
Depreciation Expense R. Olbermann 500
520
4%
3,500 3,640 4%
Totals
5,250 5,520
5%
36,750 38,640 5%
Heat, Light, Power T. Abrams
3,200 1,700
−47%
22,400 11,900
−47%
Raw Materials
T. Abrams
89,450 79,500
−11% 626,150 556,500
−11%
Corporate Overhead T. Abrams
55,000 56,000
2% 385,000 392,000 2%
Taxes
T. Abrams
11,500 10,250
−11%
80,500 71,750
−11%
Insurance
T. Abrams
27,050 26,000
−4% 189,350 182,000
−4%
Totals
186,200 173,450
−7% 1,303,400 1,214,150
−7%
p01.qxd 11/28/05 1:37 PM Page 24
within designated goals, which can be of assistance when deter-
mining the size of manager bonuses.
In Figure 1.8, the report reveals that the only manager who is
consistently failing to achieve actual costs that are less than the
budget is R. Olbermann, whose cumulative variance performance
is 5 percent worse than the budget.
When the management team reviews revenue and expense
variances, it does not have time to review what may be hundreds of
individual accounts. Instead, it has sufficient time to analyze only a
small proportion of the largest variances. Accordingly, the account-
ing staff can issue a summarized version of Figure 1.8 that lists only
line items for which variances exceed a certain monthly or year-to-
date dollar amount or percentage. The remaining accounts can still
be issued as an addendum to the variance report. This slight format
change will focus management’s attention on the few largest vari-
ances that are most in need of correction.
This form of reporting consistently shows management the
variations from budget, with an explanation of causes and circum-
stances. It thus meets the second and third objectives of a budget:
to keep score and direct attention.
The System of Interlocking Budgets
2
A properly designed budget is a complex web of spreadsheets that
accounts for the activities of virtually all areas within a company. As
noted in Figure 1.9, the budget begins in two places, with both the
revenue budget and the research and development (R&D) budget.
The revenue budget contains the revenue figures that the company
believes it can achieve for each upcoming reporting period. These
estimates come partially from sales staff members, who are respon-
sible for estimates of sales levels for existing products within their
current territories. Estimates for the sales of new products that have
not yet been released and for existing products in new markets will
Budgeting for Operations
CHAPTER
1
25
2
Adapted with permission from Steven M. Bragg, Ultimate Accountants’ Reference
(Hoboken, NJ: John Wiley & Sons, 2005), pp. 340–348.
p01.qxd 11/28/05 1:37 PM Page 25
Preparing to Operate the Business
come from a combination of sales and marketing staff members,
who will use their experience with related product sales to derive
estimates. The greatest fallacy in any budget is to impose a revenue
budget from the top management level without any input from the
sales staff; this can result in a company-wide budget that is geared
toward a sales level that is most unlikely to be reached.
A revenue budget requires prior consideration of a number of
issues. For example, a general market share target will drive several
other items within the budget, since greater market share may come
at the cost of lower unit prices or higher credit costs. Another issue
is the compensation strategy for the sales staff, since a shift to higher
or lower commissions for specific products or regions will be a
strong incentive for sales staff members to alter their selling behav-
ior, resulting in some changes in estimated sales levels. Yet another
consideration is which sales territories are to be entered during the
budget period; those with high target populations may yield very
high sales per hour of sales effort, while the reverse will be true if
the remaining untapped regions have smaller target populations. It
is also necessary to review the price points that will be offered dur-
ing the budget period, especially in relation to the pricing strategies
that are anticipated from competitors. If there is a strategy to
increase market share as well as to raise unit prices, then the budget
may fail due to conflicting activities. Another major factor is the
terms of sale, which can be extended, along with easy credit, to
attract more marginal customers; conversely, they can be retracted
in order to reduce credit costs and focus company resources on a
few key customers. A final point is that the budget should address
any changes in the type of customer to whom sales will be made. If
an entirely new type of customer will be added to the range of sales
targets during the budget period, then the revenue budget should
reflect a gradual ramp-up that will be required for sales staff mem-
bers to work through the sales cycle of the new customers.
Once all of these factors have been combined to create a pre-
liminary revenue budget, the sales staff members should also com-
pare the budgeted sales level per person to the actual sales level
that has been experienced in the recent past to see if the company
has the existing capability to make the budgeted sales. If not, the
revenue budget should be ramped up to reflect the time it will take
SECTION
I
26
p01.qxd 11/28/05 1:37 PM Page 26
27
FIGURE
1.9
The System of Budgets
p01.qxd 11/28/05 1:37 PM Page 27
Preparing to Operate the Business
to hire and train additional salespeople. The same cross-check can
be conducted for the amount of sales budgeted per customer, to see
if historical experience validates the sales levels noted in the new
budget.
Another budget that initiates other activities within the system
of budgets is the R&D budget. Unlike most other budgets, this is not
related to the sales level at all, but instead is a discretionary budget
based on the company’s strategy to derive new or improved prod-
ucts. The decision to fund a certain amount of project-related activ-
ity in this area will drive a departmental staffing and capital budget
that is, for the most part, completely unrelated to the activity con-
ducted by the rest of the company. However, there can be a feed-
back loop between this budget and the cash budget, since financing
limitations may require management to prune some projects from
this area. If so, the management team must work with the R&D
manager to determine the correct mix of projects with both short-
range and long-range payoffs that will still be funded.
The production budget is driven largely by the sales estimates
contained within the revenue budget. However, it is also driven by
the inventory-level assumptions in the inventory budget. The
inventory budget contains estimates by the materials management
supervisor regarding the inventory levels that will be required for
the upcoming budget period. For example, a new goal may be to
reduce the level of finished goods inventory from 10 turns per year
to 15. If so, some of the products required by the revenue budget
can be bled off from the existing finished goods inventory stock,
requiring smaller production requirements during the budget period.
Alternatively, if there is a strong focus on improving the level of
customer service, then it may be necessary to keep more finished
goods in stock, which will require more production than is strictly
called for by the revenue budget. This concept can also be extended
to work-in-process (WIP) inventory, where the installation of ad-
vanced production planning systems, such as manufacturing re-
sources planning or just-in-time, can be used to reduce the level
of required inventory. All of these assumptions should be clearly
delineated in the inventory budget, so that the management team
is clear about what systemic changes will be required in order to
effect altered inventory turnover levels.
SECTION
I
28
p01.qxd 11/28/05 1:37 PM Page 28
Given this input from the inventory budget, the production
budget is used to derive the unit quantity of required products that
must be manufactured in order to meet revenue targets for each
budget period. This involves a number of interrelated factors, such
as the availability of sufficient capacity for production needs. Of
particular concern should be the amount of capacity at the bottle-
neck operation. It is important to budget a sufficient quantity of
funding to ensure that this operation includes enough equipment
to meet the targeted production goals. If the bottleneck operation
involves skilled labor, rather than equipment, then the human
resources department should be consulted regarding its ability to
bring in the necessary personnel in time to improve the bottleneck
capacity in a timely manner.
The expense items included in the production budget should be
driven by a set of subsidiary budgets: the purchasing, direct labor,
and overhead budgets. These budgets can simply be included in the
production budget, but they typically involve such a large propor-
tion of company costs that it is best to lay them out separately in
greater detail in separate budgets. Specifics on these budgets follow.
• Purchasing budget. The purchasing budget is driven by several
factors, first of which is the bill of materials that comprises the
products that are planned for production during the budget
period. These bills must be accurate, or else the purchasing
budget can include seriously incorrect information. In addition,
there should be a plan for controlling material costs, perhaps
through the use of concentrated buying through few suppliers
or perhaps through the use of long-term contracts. If materials
are highly subject to market pressures, comprise a large propor-
tion of total product costs, and have a history of sharp price
swings, then a best-case and worst-case costing scenario should
be added to the budget, so that managers can review the impact
of costing issues in this area. It is also worthwhile to budget for
a raw material scrap and obsolescence expense; there should be
a history of costs in these areas that can be extrapolated based
on projected purchasing volumes.
• Direct labor budget. Do not make the mistake of budgeting for
direct labor as a fully variable cost. The production volume from
Budgeting for Operations
CHAPTER
1
29
p01.qxd 11/28/05 1:37 PM Page 29
Preparing to Operate the Business
day to day tends to be relatively fixed, and requires a set num-
ber of direct labor personnel on a continuing basis to operate
production equipment and manually assemble products. Thus,
direct labor should be shown in the budget as a fixed cost of
production, within certain production volume parameters.
Also, this budget should describe staffing levels by type of
direct labor position; this is driven by labor routings, which are
documents that describe the exact type and quantity of staffing
needed to produce a product. When multiplied by the unit vol-
umes located in the production budget, the labor routing results
in an expected level of staffing by direct labor position. This
information is most useful for the human resources depart-
ment, which is responsible for staffing the positions.
The direct labor budget should also account for any contrac-
tually mandated changes in hourly rates, which may be item-
ized in a union agreement. Such an agreement may also have
restrictions on layoffs, which should be accounted for in the
budget if this will keep labor levels from dropping in proportion
with budgeted reductions in production levels. Thus, the pres-
ence of a union contract can result in a much more complex
direct labor budget than would normally be the case.
Any drastic increases in the budgeted level of direct labor
personnel will likely result in some initial declines in labor effi-
ciency, since it takes time for new employees to learn their
tasks. If this is the case, the budget should reflect a low level of
initial efficiency that will result in greater initial direct labor
costs, with a ramp-up over time to higher levels.
• Overhead budget. The overhead budget can be a simple one to
create if there are no significant changes in production volume
from the preceding year, because this budget involves a large
quantity of static costs that will not vary much over time.
Included in this category are machine maintenance; utilities;
supervisory salaries; wages for the materials management, pro-
duction scheduling, and quality assurance personnel; facilities
maintenance; and depreciation expenses. Under the no-change
scenario, the most likely budgetary alterations will be to machin-
ery or facilities maintenance, which are dependent on the con-
dition and level of usage of company property.
SECTION
I
30
p01.qxd 11/28/05 1:37 PM Page 30
If there is a significant change in the expected level of pro-
duction volume, or if new production lines are to be added,
then you should examine this budget in great detail, for the
underlying production volumes may cause a ripple effect that
results in wholesale changes to many areas of the overhead
budget. Of particular concern is the number of overhead-
related personnel who must be either laid off or added when
capacity levels reach certain critical points, such as the addition
or subtraction of extra work shifts. Costs also tend to rise sub-
stantially when a facility is operating at very close to 100 per-
cent capacity, which calls for an inordinate amount of effort to
maintain on an ongoing basis.
The purchasing, direct labor, and overhead budgets can then be
summarized into a cost-of-goods-sold budget. This budget should
incorporate, as a single line item, the total amount of revenue, so
that all manufacturing costs can be deducted from it to yield a gross
profit margin on the same document. This budget is referred to
constantly during the budget creation process, since it tells man-
agement if its budgeting assumptions are yielding an acceptable
gross margin result. Since it is a summary-level budget for the pro-
duction side of the budgeting process, this is also a good place to
itemize any production-related statistics, such as the average hourly
cost of direct labor, inventory turnover rates, and the amount of
revenue dollars per production person.
Thus far, we have reviewed the series of budgets that descend in
turn from the revenue budget and then through the production
budget. However, other expenses unrelated to production are cate-
gories in a separate set of budgets. The first is the sales department
budget, which includes the expenses that the sales staff members
must incur in order to achieve the revenue budget, such as travel
and entertainment, as well as sales training. Of particular concern
in this budget is the amount of budgeted headcount that is required
to meet the sales target. It is essential that the actual sales per sales-
person from the most recent completed year of operations be com-
pared to the same calculation in the budget to ensure that there is
a sufficiently large budget available for an adequate number of sales
personnel. Often companies make the false assumption that the
Budgeting for Operations
CHAPTER
1
31
p01.qxd 11/28/05 1:37 PM Page 31