Accounting and Finance for Your Small Business Second Edition_9 pptx
Bạn đang xem bản rút gọn của tài liệu. Xem và tải ngay bản đầy đủ của tài liệu tại đây (305.45 KB, 25 trang )
Evaluating the Operations of the Business
Fast food outlets, therefore, turn over inventory at a tremen-
dous rate and generate continuous streams of cash. At any one
point, the company may not have large amounts of cash on hand if
it is using cash to retire longer-term debt or to acquire additional
fixed assets. By comparing the company’s own historic trend in the
current ratio, and examining those ratios with other fast food out-
lets, you can perhaps see that a 1:4 ratio may be even better than a
1:2 ratio. The traditional rule of thumb may not be applicable or
representative of the fast food industry. The point of this example is
that you should consider those ratios that make sense for the busi-
ness, give usable management information, and can be obtained on
a timely basis.
Figure 6.1 shows a balance sheet and statement of earnings that
will be used to demonstrate the financial ratios.
Types of Financial Ratios
Liquidity Ratios
Liquidity ratios give an indication of a company’s ability to meet
short-term obligations. These ratios give some insight into the pres-
ent cash solvency and are a measure of the company’s ability to
meet adversity. Generally, liquidity ratios look at the short-term
assets or resources and the short-term debts and obligations.
Current Ratio. As discussed in Chapter 5, the current ratio is the
ratio of:
For Fruit Crate Manufacturing Co., Inc., the current ratio for
2006 is:
= 2.81:1
Supposedly, the higher the ratio, the better the company’s abil-
ity to pay bills. However, the ratio does not take into account how
$276,055
ᎏᎏ
$98,294
Current assets
ᎏᎏ
Current liabilities
SECTION
III
182
p03.qxd 11/28/05 1:39 PM Page 182
Performance Measurement Systems
CHAPTER
6
183
FIGURE 6.1
Sample Balance Sheet and Statement of Earnings
Fruit Crate Mfg. Co., Inc.
Assets
2006 2005
Current Assets
Cash and marketable securities $21,285 $20,860
Accounts receivables 83,473 91,155
Inventories 164,482 157,698
Prepaid expenses 2,554 2,049
Accumulated prepaid tax 4,261 3,475
Current assets $276,055 $275,237
Fixed Assets
Fixed assets $198,760 $192,666
Less: Accumulated depreciation 107,330 99,030
Net fixed assets $91,430 $93,636
Long-term investment $8,229 $-0-
Other Assets
Goodwill $23,839 $23,839
Debenture discount 751 833
Other assets $24,590 $24,672
Total Assets $400,304 $393,545
Liabilities and Net Worth
2006 2005
Current Liabilities
Bank loans and notes payables $53,638 $42,544
Accounts payable 17,560 16,271
Accrued taxes 4,321 15,186
Other accrued liabilities 22,775 19,608
Current liabilities $98,294 $93,609
Long-term debt $75,562 $74,262
Stockholders’ equity
Common stock @ $1 par value $50,420 $50,420
Capital surplus 43,179 43,016
Retained earnings 132,849 132,238
Total stockholders’ equity $226,448 $225,674
Total Liabilities and Net Worth $400,304 $393,545
(continued)
p03.qxd 11/28/05 1:39 PM Page 183
Evaluating the Operations of the Business
liquid the “current” assets really are. For example, if the current
assets are mostly cash and current receivables, these are more liq-
uid than if most of the current assets are in inventories. To refine
the ratio as a measure, we eliminate the effect of inventories, pre-
paid expenses, and prepaid tax, which gives us this acid test ratio:
Acid Test Ratio
For Fruit Crate Manufacturing Co., Inc.:
= 1.066:1
The acid test ratio eliminates the least liquid components of the
current assets and therefore focuses on the assets most easily con-
verted to debt payment.
Liquidity of Receivables. Analyzing the current assets by compo-
nents enables the company to detect problems in its liquidity. One
thing that can be examined is how current the receivables are.
$276,055 − 171,297
ᎏᎏᎏ
$98,294
Current assets − (Inventories + Prepaids)
ᎏᎏᎏᎏᎏ
Current liabilities
SECTION
III
184
FIGURE 6.1 (continued)
Fruit Crate Mfg. Co., Inc.
Statement of Earnings
2006 2005
Net sales $492,374 $464,383
Cost of goods sold $330,383 $311,601
Selling, general and administration
expense 98,475 90,555
Depreciation 13,786 14,396
Interest expense 10,340 8,823
Expenses $452,984 $425,375
Earnings before taxes $39,390 $39,008
Less: Income taxes 18,907 19,114
Earnings after taxes $20,483 $19,894
Less: Cash dividend 12,495 12,732
Retained earnings $7,988 $7,162
p03.qxd 11/28/05 1:39 PM Page 184
Receivables are a liquid asset only if they can be collected in a rea-
sonable time. The first of two ratios that examine receivables is
average collection period ratio:
For Fruit Crate Manufacturing Co., Inc., the average collection
period rate for 2006 is (assuming all sales are credit sales):
= 62 days
This tells that the average collection period receivables are out-
standing, in other words, how long, on average, the company waits
to convert receivables to cash.
The second basic receivable ratio is the receivable turnover ratio:
For Fruit Crate Manufacturing Co., Inc., the receivables turnover
ratio is:
= 5.90 times
If there is no figure for the amount of credit sales, you must
resort to the total sales figure. Care should be taken to analyze all
ratios, especially receivables ratios. Often the numbers available are
year-end numbers, which may not recognize seasonal fluctuations
or significant, steady growth. If there are significant seasonal sales,
the average of the monthly closing balances may be a more appro-
priate figure to use. If the company is experiencing a steady growth
in sales, the year-end receivables will not match accurately with
the annual sales figure. If this is the case, the number may be cal-
culated based on the annualized sales from the last six months and
the end-of-year level of receivables.
Some questions to ask when analyzing these ratios are:
• How does the average collection period compare with the sales
terms? For Fruit Crate Manufacturing Co., Inc., the credit terms
$492,374
ᎏᎏ
$83,473
Annual credit sales
ᎏᎏᎏ
Average receivables
83,473 × 365
ᎏᎏ
492,374
Receivables × Days in year
ᎏᎏᎏᎏ
Annual credit sales
Performance Measurement Systems
CHAPTER
6
185
p03.qxd 11/28/05 1:39 PM Page 185
Evaluating the Operations of the Business
are 2/10, n/60. The bulk of the collections are made around the
due date.
• How does the collection period compare with others in the
industry? This can give some insight into the investment in
receivables.
• Is the average collection period so low that it may be inhibit-
ing sales? The firm may have an excessively restrictive credit
policy.
• How old are the receivables? Here you must ask “What does the
average tell us?” Fruit Crate Manufacturing Co., Inc., had 433
accounts and found the average collection period ratio was 62
days. But when it grouped the accounts by age it discovered
these statistics:
Number of Accounts Paid in How Many Days?
110 (25%) 10
80 (18%) 30
170 (39%) 60
73 (18%) 180 days
Eighty-two percent of the receivables are collected before or by
the due date, and only 18 percent extend beyond the due date. But
the late receivables are really late: averaging six months after ship-
ment of goods and four months after payment was due.
Adding an aging of receivables provides more usable informa-
tion than the average collection period ratio alone. This tells:
• Where collection efforts need to be concentrated
• How much investment the company has in receivables
• Accounts that may require discontinuation of service
• Whether the terms are speeding up the recovery of receiv-
ables
Another question the aging would raise is: “Are the good
accounts paying in the 10–30 period taking the cash discounts even
though they have no right to it?” If the answer is yes, the cash dis-
count terms are really 2/30, n/60.
SECTION
III
186
p03.qxd 11/28/05 1:39 PM Page 186
Debt Ratios
Up to now, we have been concerned with short-term liquidity mea-
sures. Depending on the use, certain long-term solvency ratios may
be of interest to a company and its investors. These ratios give an
indication of the company’s ability to meet long-term obligations.
Debt to Net Worth. This ratio is computed by dividing the total debt,
including current liabilities, by the net worth (total stockholders’
equity). For Fruit Crate Manufacturing Co., Inc.:
===.77:1
Frequently, intangible assets, if relatively large, are deducted
from net worth to obtain the tangible net worth. Note that for the
liquidity ratios discussed earlier, we used assets divided by liabili-
ties. Here we are creating debt ratios—putting liabilities over other
measures. For liquidity, the higher the number, the “better” the
ratio. For debt ratios, the reverse is true: The lower the number,
the “better” the ratio. Sometimes in computing this ratio, preferred
stock is included with debt instead of net worth. This acknowl-
edges that preferred stock represents a claim superior to the claim
of common stockholders. It also points out that when using “com-
parable ratios,” you must be certain that the calculations are truly
comparable; that is, you must compare the definitions of the
ratios.
The debt to net worth ratio varies from industry to industry. One
factor often contributing to this variation is the volatility of cash
flows. The more stable and predictable the cash flow, the greater the
debt you may be able to service consistently. Because this ratio is a
good measure of ability to pay debts over time, it sometimes is used
as a measure for approximating financial risk.
Debt to Total Capital. Another useful debt ratio is the ratio of total
debt to total capital. In this ratio, only the long-term capitalization
of the firm is considered.
Long-term debt
ᎏᎏᎏ
Total capitalization
$173,856
ᎏᎏ
$226,448
$98,294 + 75,562
ᎏᎏᎏ
$226,448
Total debt
ᎏᎏ
Net worth
Performance Measurement Systems
CHAPTER
6
187
p03.qxd 11/28/05 1:39 PM Page 187
Evaluating the Operations of the Business
The total capitalization is composed of long-term debt and net
worth.
For Fruit Crate Manufacturing Co., Inc.:
==.25:1
This ratio shows the importance of long-term debt financing rel-
ative to other financing in the capital structure. When computing
this ratio, it may be more informative to use market values instead of
book values for the stock components. (Book values were used in
the preceding calculation.) If market values of stock are available,
this computation may indicate a very different leverage factor.
Coverage Ratios
Coverage ratios are used to examine the relationship between
finance charges and a company’s ability to service them. One of the
traditional coverage ratios is the interest coverage ratio. To compute
this ratio for a given period, divide the annual earnings before inter-
est and taxes by the interest charges for the period.
Different coverage ratios use different interest charges in the
denominator. For example: The overall coverage method considers
all fixed interest regardless of the seniority of the claim. By ignor-
ing the seniority of some debt, the implication is that senior debt
obligations are only as secure as the ability to meet all debt servic-
ing. A method that gives some consideration to the seniority of debt
is the cumulative deduction method.
For cumulative deduction methods, assume these hypothetical
data: Fruit Crate Manufacturing Co., Inc., has:
$49,730 = earnings before interest and taxes ($39,390 + 10,340)
$4,210 = interest on 7% senior notes.
$6,130 = interest on 9% junior notes.
The coverage on the senior notes would be:
= 11.81 times
$49,730
ᎏ
$4,210
$75,562
ᎏᎏ
$302,010
$75,562
ᎏᎏᎏ
$75,562 + 226,448
SECTION
III
188
p03.qxd 11/28/05 1:39 PM Page 188
The coverage on the junior notes, after the senior debt has been
covered, is:
= 4.40 times
Using this method, the coverage ratio on the junior notes takes
into consideration the fact that there are outstanding senior oblig-
ations.
Both of these methods ignore the fact that the payment of inter-
est is only part of the obligation covered by debt service. Debt ser-
vice includes payment of both interest and principal. And because
these payments are made from cash, a more appropriate ratio may
be the cash flow coverage ratio. One adjustment should be made in
computing this ratio. Interest payments are accounted for before
taxes, whereas principal payments are treated as after-tax dollars.
To adjust for the tax effect, you must adjust the principal by the fac-
tor [1/(1 − t)], where t is the effective tax rate. So:
Cash flow coverage ratio =
If you had a $10,000/year principal payment and a 46 percent
tax rate, it would require:
$10,000 × [1/(1 − .46)] or
$10,000 × (1.85), or $18,500 in before-tax dollars
to meet that principal obligation
This type of analysis can, in some cases, be expanded to con-
sider other fixed obligations, such as dividends on preferred stock,
lease payments, and long-term essential capital expenditures.
Debt ratios or coverage ratios may not give an accurate picture
of the company’s ability to meet obligations. Because of the timing
of the payment of debt obligations, the average interest rates, and
other factors, you may wish to calculate other ratios showing the
relationship of profitability to sales or to investment.
Annual cash flow before
interest and taxes
ᎏᎏᎏᎏ
Interest and principal [1/(1 − t)]
$49,730 − 4,210
ᎏᎏ
$10,340
Performance Measurement Systems
CHAPTER
6
189
p03.qxd 11/28/05 1:39 PM Page 189
Evaluating the Operations of the Business
Profitability Ratios
When the profitability on sales ratio and the profitability on invest-
ment ratios are considered, they can give an indication of your effi-
ciency of operation. The first such ratio is the gross profit margin.
For Fruit Crate Manufacturing Co., Inc., the gross profit mar-
gin is:
==33%
This ratio gives the percentage of profit relative to the sales after
deducting the cost of goods sold. A more reflective ratio of prof-
itability is the net profit margin:
For Fruit Crate Manufacturing Co., Inc., the net profit margin is:
= 4.2%
This ratio gives a measure of overall efficiency after taking into
consideration expenses and taxes but not extraordinary charges.
With these two ratios you can, over time, evaluate operational
changes. For example, if the gross profit margin remained rela-
tively constant over time, but the net profit margin declined, it
shows that either the tax rate has changed or selling and adminis-
trative expenses have increased. The relative change between these
ratios can identify areas where management attention may be
necessary.
As another example, if the gross profit margin declines, the cost
of goods sold has increased. This could signal several things:
• The firm may have had to lower its product prices to be com-
petitive.
• The cost of labor, materials, or purchased components may have
increased.
• Overall efficiency may have declined.
$20,483
ᎏᎏ
$492,374
Net profit (after taxes)
ᎏᎏᎏ
Sales
$161,991
ᎏᎏ
$492,374
$492,374 − 330,383
ᎏᎏᎏ
$492,374
SECTION
III
190
p03.qxd 11/28/05 1:39 PM Page 190
Another group of profitability ratios relate profits to investment.
For example, the formula for the rate of return on common stock
equity is:
For Fruit Crate Manufacturing Co., Inc. (no preferred stock
involved):
= 0.90 or 9%
This ratio gives an indication of the earning power on the book
investment of the shareholders’ interest. A more general ratio used
to analyze profitability is the return on assets ratio. Use this formula
to calculate this ratio:
For Fruit Crate Manufacturing Co., Inc.:
= 5.5%
Profits are considered after interest is paid to creditors; to some
extent this ratio may be inappropriate because some of these same
creditors provide the means by which part of the assets are sup-
ported. When the finance charges are large, it may be better for com-
parative purposes to calculate a different ratio. An arguably more
appropriate ratio may be the net operating profit rate of return. It is cal-
culated as follows:
For Fruit Crate Manufacturing Co., Inc.:
= 13.24%
$49,730
ᎏᎏ
$375,714
Earnings before interest and taxes
ᎏᎏᎏᎏ
Total assets (tangible)
$20,483
ᎏᎏ
$375,714
Net profits (after taxes)
ᎏᎏᎏ
Total assets (tangible)
$20,483
ᎏᎏ
$226,448
Net profit after taxes − Preferred stock dividend
ᎏᎏᎏᎏᎏᎏ
Net worth − Par value of preferred stock
Performance Measurement Systems
CHAPTER
6
191
p03.qxd 11/28/05 1:39 PM Page 191
Evaluating the Operations of the Business
Turnover and Earning Power Ratios
The asset turnover ratio relates total sales to total tangible assets.
Like many of the ratios discussed before, the meaningfulness of this
ratio lies in the trend the company establishes and how it compares
with similarly situated, comparable businesses in the same indus-
try. The ratio is used as a measure or indicator of how well the com-
pany uses its resources to generate output.
The asset turnover ratio is calculated as:
For Fruit Crate Manufacturing Co., Inc., the asset turnover
ratio is:
= 1.31
A shortcoming of this ratio is that it puts a premium on busi-
nesses that have more fully depreciated equipment than on more
new investment, which may distort efficiency. New equipment
should be producing goods at lower per-unit costs than older, out-
of-date equipment. As a consequence, this ratio should be used in
conjunction with other ratios.
The earning power ratio on total assets is obtained when the
asset turnover is multiplied by the net profit margin, generating the
earning power percentage:
Earning power =×
=
Because the net profit margin ignores the asset utilization and
the turnover ratio does not consider profitability, each by itself is an
inadequate measure of operating efficiency. The earning power ratio
resolves these shortcomings. From this ratio, it is clear that earning
power will increase if there is an increase in turnover, net profit
margin, or both.
Net profits (after taxes)
ᎏᎏᎏ
Total assets (tangible)
Net profit (after taxes)
ᎏᎏᎏ
Sales
Sales
ᎏᎏᎏ
Total assets (tangible)
$492,374
ᎏᎏ
$375,714
Sales
ᎏᎏᎏ
Total tangible assets
SECTION
III
192
p03.qxd 11/28/05 1:39 PM Page 192
Using Performance Measurements for Predictions
Any ratio calculation is based on historical information, which
may have no bearing whatsoever on future results. For example,
the profitability ratio for a Christmas ornaments company may
look awful for the first two-thirds of a year, leading you to assume
a continuing pattern of losses, only to see a late-season surge in
sales volume that completely overturns all assumptions based on
previously calculated ratios. Because of their historical founda-
tion, does this mean that ratios are useless for predicting the
future? Not at all. However, the results they show must be tem-
pered by your knowledge of the business, as well as a comparison
to a variety of other performance measures. For example, if the
current ratio suddenly drops from 2:1 to 1:1, this may signify that
a company is rapidly using up its available resources to pay its lia-
bilities, which is a clear preliminary signal of bankruptcy. However,
the ratio can also be completely misleading, because a company
simply may have chosen to use much of its current assets to pay
off a long-term debt in advance of its scheduled payment date.
The correct interpretation would have required either a complete
knowledge of the subject company’s financial transactions (which
is not always easy to come by) or a more comprehensive view of
other ratios. For example,if the current ratio had been supple-
mented by the debt to equity ratio, then it would have been an
easy matter to see the drop in the current ratio being offset by the
improvement in the debt to equity ratio. Thus, ratio analysis must
be supplemented by other information before it can be used as a
predictive tool.
For prediction purposes, the ratio format shown in Figure 6.2
can be of considerable use. Having just noted that a number of
measures, combined together, are superior to a single ratio for
predictive purposes, we have created a mix of ratios that tell a
more comprehensive story of a company’s financial condition.
The measures are described in month-to-month format, so that
the observer can see a clear trend line of financial performance.
Figure 6.2 uses a mix of ratios and percentages, as well as the
Performance Measurement Systems
CHAPTER
6
193
p03.qxd 11/28/05 1:39 PM Page 193
Evaluating the Operations of the Business
monthly sales figure, to determine what is happening to Com-
pany XYZ.
In Figure 6.2, the trend line of sales has gone up substantially,
as Company XYZ has clearly obtained much new business, begin-
ning in the month of May. However, this sales increase is coincident
with a marked drop in profitability, probably because the company
has increased its incremental sales by selling at too low a margin,
thereby converting itself from a low-volume, high-margin company
into the reverse: a high-volume, low-margin company. Further, to
meet the demands of the company’s sales growth, note that the
return on assets has dropped markedly, probably due to the pur-
chase of new fixed assets that are needed to produce the added vol-
ume. The turnover ratios for both accounts receivable and inventory
have also dropped, implying that the company’s working capital
investment has increased, probably due in part to worsening credit
problems with its new customers. The increase in assets and work-
ing capital have contributed to a shortage of cash, as evidenced by
the worsening current ratio, not to mention the increase in debt, as
revealed by the debt to equity ratio. To make matters worse, the
added expenses and reduced margins associated with these extra
sales have resulted in a much higher break-even point, so that the
company must maintain a very high sales level in order to cover its
costs. This type of more comprehensive analysis, when set up in a
multiperiod format, is much more revealing for prediction purposes
than a single-ratio examined for a single period. From this wider
range of information, we can easily determine the course of a com-
pany’s future finances, as well as possible reasons for the current
situation, and suggestions for further improvements. To use the
example in Figure 6.2, we can predict a speedy demise for this com-
pany, because its cash requirements for working capital and fixed
assets vastly exceed the ability of operations to spin off substantial
cash. Our recommendation, based on the analysis, would be to
eliminate the new customers and return to the smaller sales levels
that also resulted in higher margins.
Only by creating a complete picture of a company’s financial
condition, which requires a mix of ratios, percentages, and other
calculations, can you have a firm basis on which to predict future
financial performance.
SECTION
III
194
p03.qxd 11/28/05 1:39 PM Page 194
195
FIGURE
6.2
Predictive Ratio and Margin Analysis
Low-Margin Sales Added Here
Measurement Jan Feb Mar Apr
May Jun Jul Aug Sep Oct Nov
Dec
Sales (000s)
$550 $560 $565 $570
$800 $950 $1,150 $1,300 $1,500 $1,780
$2,000 $2,125
Breakeven (000s) $450 $450 $450 $450
$600 $850 $950 1,150 $1,350 $1,550 $1,800
$1,950
Current Ratio
2.5:1 2.5:1 2.5:1 2.5:1 2.0:1 1.7:1 1.5:1
1.2:1 1.0:1 .8:1 .7:1 .6:1
Receivable Turnover
888886665555
Inventory Turnover
777776666655
Debt/Equity
.2:1 .2:1 .2:1 .2:1 .2:1 .4:1 .6:1 .8:1
1:1 1.3:1 1.5:1 1.7:1
Gross Margin
25% 26% 26% 26% 27% 24% 23%
22% 21% 21% 21% 21%
Net Margin
6% 7% 7% 7% 8% 5% 4%
3% 2% 2% 2% 2%
Times Interest Earned 3.0×
3.0× 3.0×
3.0×
2.7× 2.5×
2.4×
2.1×
1.9×
1.7× 1.3×
1.0×
Return on Assets 18% 20% 20% 20%
22% 16% 14% 12% 10% 8% 6%
4%
p03.qxd 11/28/05 1:39 PM Page 195
Evaluating the Operations of the Business
Operating Ratios
Operating ratios may be even more useful than financial ratios
because of the timely nature of their calculation and the decision-
specific nature of their use. While these ratios are in keeping with the
thinking of most engineers and managers of sales, service and man-
ufacturing can also use the principles of operating ratios effectively.
Comparison of Financial and Operating Ratios
Similarities
• Both financial and operating ratios are most useful when the
information generated by the ratio is timely. Ratios are like
other tools; they are beneficial only if you have them when
you need them.
• As with financial ratios, operating ratios can be generated for
any two numbers, for example, the number of salespeople and
the dollars of sales per month. These two numbers will generate
an average sales per salesperson, against which there may be a
relative performance index. Also like financial ratios, unless
there is a relationship, the resulting ratio is meaningless.
• Like financial ratios, operating ratios should not be accepted at
face value. For the sales per person ratio, assume we find the
average to be 17 sales per salesperson per day in an automo-
bile dealership. Two of the salespeople make 43 and 53 sales
per day, respectively, and the remaining five salespeople make
3 sales, 6 sales, 5 sales, 5 sales, and 4 sales, respectively. It would
appear that you could replace the five salespersons with one
aggressive person and be better off. However, additional infor-
mation may reveal that the low-volume employees are auto-
mobile showroom salespeople and the other two are in the
parts department. The parts room accounts for only 17 percent
of the revenues but has 28.6 percent of the sales force. Several
more ratios can be generated that would help in determining
whether the sales force is well managed, efficient, and eco-
nomical. Standing alone, no one ratio is as useful as a series of
related ratios.
SECTION
III
196
p03.qxd 11/28/05 1:39 PM Page 196
• Ratios for operations, like financial ratios, can be more effec-
tive if they are “trended.” Taking the salesroom salespeople’s
past 12 months average ratio of sales per day, we observe these
data:
Jan. 3.6 July 4.9
Feb. 4.2 Aug. 2.1
Mar. 5.4 Sept. 4.7
Apr. 6.1 Oct. 7.0
May 7.7 Nov. 6.3
June 6.3 Dec. 4.1
From this we see a two-peak cycle of automobile sales. The
dealership can plan when it should order more cars to increase
the inventory in anticipation of seasonal sales. It also may help
plan for sales incentives, promotional advertising, vacation
schedules, and other operational elements.
• The cost of generating the data necessary for any ratio should
not exceed the benefit derived from the information produced
from the data. As with any tool, a ratio should itself have a
favorable cost-benefit relationship. In other words, the benefits
should outweigh the costs.
• Ratios are useless if they do not meet a need. Looking back, the
ratio of average sales per salesperson per period was designed to
measure the relative performance of sales personnel. It did not
do that adequately. It failed to inform management what the
meaningful performance was for automobiles versus parts sales
personnel.
• Properly structured, an operating ratio or series of ratios can be
used for planning and control. As an example, some of the
financial ratios mentioned can be used to evaluate credit policy.
The same is true for operating ratios. If we monitor how well
auto sales personnel are doing individually, compared to the
monthly historical figures, we have a quantitative measure of
individual performance. If we look at the aggregate sales figures
of average sales per person per day against the historical aver-
age, we have a measure of how well the business is doing com-
pared with past performance.
Performance Measurement Systems
CHAPTER
6
197
p03.qxd 11/28/05 1:39 PM Page 197
Evaluating the Operations of the Business
Dissimilarities
• Financial ratios relate to numbers from the balance sheet and
income statement, whereas operational ratios are oriented more
toward production, service, and sales—figures that may not be
accumulated in the accounting system. Because of this, standard
financial ratios are more likely to be routinely prepared, whereas
operating ratios are more often tailored to meet particular needs.
There is a greater tendency to compare financial ratios among
businesses almost indiscriminately—resulting in bad compar-
isons among dissimilar businesses. Because operating ratios may
be tailored, there is less of a tendency for misapplication and
greater reliance on historical trends.
• Operating ratios often can be calculated very quickly from obvi-
ous data. For the example of average sales per salesperson,
management can have an accurate number for the previous
day’s sales for each member of the sales force at the start of each
workday. It is often more difficult to compile and verify the
financial data.
Use of Operating Ratios
Operating ratios can be used to evaluate any function. There may
be a very large number of data-gathering efforts necessary to com-
pile the needed input for ratio generation. Data gathering is costly
and time consuming. It represents an investment that should have
an expectation of a return to justify the expenditure. Therefore,
you should first implement the use of ratios that have the greatest
return or control. The ability to improve control through ratio gen-
eration and evaluation should be directed at critical steps in the
process.
Breakdowns at critical steps may halt all production. For exam-
ple, in a law firm specializing in appeals, time constraints are exter-
nally generated by rules of court with limited opportunities for
extensions of time or deviations. Operationally, research is accom-
plished using sophisticated terminals connected to national data
banks. Writing and editing is done on word processing software. All
work flows through personnel highly skilled in the use of word
processors. A breakdown in the word processing function could be
SECTION
III
198
p03.qxd 11/28/05 1:39 PM Page 198
very serious for the meeting of critical deadlines. Often the speed of
input into the word processor is slower than dictation. Therefore,
the ratio of skilled typists to writers may be critical. Ratio analysis
can play a key role in determining a proper relationship.
There is a general five-step process for designing and imple-
menting a control system based on ratio analysis. The number of
steps may vary based on system complexity.
The five steps are:
1. Analyze the process or system: Write a step-by-step description
of the process.
2. Look for and identify critical steps: Is there any one step through
which most or all work flows?
3. Analyze the critical step: Is it a potential bottleneck or constric-
tion? Why is it a bottleneck?
4. Set a target performance ratio: Determine from past historical
data how well you have done and ask, “How much better can
we do?”
5. Evaluate performance and feedback: How well are you now
doing? How do you improve the system? What is the justifi-
cation?
Applications
Operating ratios can be applied to any business. The next case study
applies a ratio analysis to a service company (a law firm). Other sug-
gestions will be given for a retail store and a manufacturing firm.
The firm of Simmer, Braize, and Broyle, P.A., is a Midwest law
firm composed of 6 partners and 11 associate attorneys. They rep-
resent three large automobile insurance companies in defense liti-
gation. The firm’s business is basically steady, with two small
seasonal variations. The firm has a sophisticated word processing
system with satellite terminals; one draft, high-speed printer; one
letter-quality printer; and a laser printer. The firm has two senior
secretaries, two junior secretaries, and one clerk-typist/receptionist.
As the caseload has grown, one senior secretary spends almost all
her time setting up new case files.
The firm noticed that the secretaries were putting in more
Performance Measurement Systems
CHAPTER
6
199
p03.qxd 11/28/05 1:39 PM Page 199
Evaluating the Operations of the Business
overtime, and the senior partner was concerned that things were
getting done only just in time. Ratio analysis was undertaken by an
associate who had an undergraduate degree in business.
• She analyzed the flow of paper from the receipt of a complaint
through the final order of the trial court. She prepared a flow-
chart of what work was done, when, and by whom.
• She discovered two critical steps:
1. All work product passed through the two junior secretaries
and one senior secretary as they input, edited, and printed
out lawyers’ work products.
2. The reproduction and mailing of letters, pleadings, and briefs.
• The technical word processing function was on the verge of
becoming a bottleneck. The work just seemed to take too long
to process.
• The reproduction facility was a disaster. The equipment was
always breaking down; when it worked, people were constantly
walking back to work without copies because “the line was too
long” or “a long critical job was on the machine.”
• After studying the number of words processed by each of the
three secretaries, she found an average of 52 words per minute.
Not to be fooled by averages, she looked at the distribution. The
two junior secretaries typed at 38 and 42 words per minute
each and the senior secretary typed at 75. The other senior sec-
retary, who only set up files, could type at 81 words per minute.
The associate, told that this secretary had been hired because of
her typing speed, calculated that if the senior secretary switched
roles with the junior secretary, the firm could target word input
at 67 words per minute, average, without changing personnel
(a 29 percent increase). The junior secretary and the reception-
ist would be able to prepare all the files as they came in. The
associate found that the senior secretary had started or updated
61 files per day. She set a target of 45 files for the junior secre-
tary and 20 for the receptionist (because of her other duties).
• She ran a study of the copier by asking each user to log in the
number of copies made of each original and the number of orig-
inals. From this, she learned several things. There were only
SECTION
III
200
p03.qxd 11/28/05 1:39 PM Page 200
two basic types of copying requirements: (1) long runs (many
copies of large jobs with many originals) and (2) short runs (few
originals, few copies). The long runs, on average, consumed 6
hours a day total time and the short runs 1.5 hours. The aver-
age short run took less than 30 seconds, but the average long
run took 17 minutes. Twenty-one long runs and about 200 short
runs were run each day. With the machine breakdowns consid-
ered, the copier (owned by the firm) worked properly on aver-
age 8.2 hours each 9-hour day. Often copies were run through
lunch hour on a staggered secretarial shift.
• From these ratios, the associate made these recommendations:
Buy a highly reliable small copier and dedicate it to short runs.
Hire a clerk to do the copying. As justification, she made these
findings based on ratio analysis:
• On average, each secretary saved up five small runs or one
long run before going to the machine.
• On average, the machine was tied up doing long runs or broken
down 6.8 hours out of every 9 hours, roughly 75 percent of the
time. On three out of every four trips to the machine, a secretary
found it occupied by a long run. Because the secretaries made 40
successful trips to the copier per day (200 short runs/5 runs per
trip), they were making approximately 120 unsuccessful trips to
the machine. If they waited for a long run to finish rather than
returning to their desk, they waited 8
1
⁄2 minutes (17/2).
• By assigning a clerk to copying, all unsuccessful trips were elim-
inated. Even though an unsuccessful trip to the copier took only
45 seconds, 1.5 hours of secretarial time was saved (120 trips ×
45 seconds).
• By reducing the demand on the copier, the breakdown rate
was expected to improve.
• The biggest bonus to the firm was the actual freeing up of 7.5
hours of secretarial time. Simply to do the copying, a secretary
stood at the machine for 6 hours a day for long runs and 1.5
hours per day for short runs. This, coupled with the 1.5 hours of
time saved on unsuccessful trips, amounted to enough savings
in dollars of overtime to pay for the small-run copier in nine
months and still pay the salary and benefits of the clerk.
Performance Measurement Systems
CHAPTER
6
201
p03.qxd 11/28/05 1:39 PM Page 201
Evaluating the Operations of the Business
Ratio analysis improved the operation of the firm, gave it quan-
tifiable measures of performance, and got some control over the
operation.
Other Ratios
A list of other operating ratios a firm might generate follows; it is
not meant to be complete.
For the law firm, other ratios were considered:
• Total hours worked to hours spent on task for which hired
• Clerical hours to professional hours
• Billable hours to hours worked
• Billable hours brought to firm (new clients, new or repeat
work) to hours billed
For a retail store:
• Number of customers making purchases to the number of cus-
tomers coming through door
• Number of sales to number of customers waited on (by each
salesperson)
• Number of sales per hour of the day
• Dollars of sales per dollars of inventory (by product or product
type)
• Number of sales to number of salespersons
For a manufacturing firm:
Lower Management
• Hours of setup time to hours of run time
• Hours of downtime to available hours
• Hours of downtime to run time
• Hours of sick time to hours worked
• Labor hours per product produced
• Hours of rework to hours of production
• Number of quality control steps or inspections to hours to pro-
duce or steps to produce
• Work area per employee
SECTION
III
202
p03.qxd 11/28/05 1:39 PM Page 202
Middle Management
• Number of supervisors to direct laborers
• Number of indirect laborers to direct laborers
• Scrapped product to good finished goods
• Number of returns to goods sold
Upper Management
• Dollars of profit to cost to produce
• Number of products back-ordered to number delivered
• Dollars of sales to number of employees
• Lost time accidents to hours worked
• Number of service employees to manufacturing employees
• Number of units shipped per day
For the accounting department:
• Purchase discounts taken to total discounts
• Transactions processed per person
• Transaction error rate
• Average time to issue invoices
• Time to produce financial statements
• Percentage of tax filing dates missed
• Bad debt percentage
• Percent of cash applied on day of receipt
For the engineering department:
• Bill of material accuracy
• Labor routing accuracy
• Percentage of existing parts used in new products
• Average number of distinct products per design platform
• Ratio of actual cost to target cost
• Warranty claims percentage
• Time from design inception to production
For the logistics department:
• Production schedule accuracy
• Days of inventory on hand
• Obsolete inventory percentage
• Inventory accuracy
• Percentage of certified suppliers
Performance Measurement Systems
CHAPTER
6
203
p03.qxd 11/28/05 1:39 PM Page 203
Evaluating the Operations of the Business
• On-time parts delivery percentage
• Purchased component defect rate
• Picking accuracy for assembled products
• On-time delivery percentage
For the production department:
• Utilization percentage for bottleneck operation
• Break-even plant capacity
• Unit output per direct labor hour
• Average equipment setup time
• Unscheduled downtime percentage
• Scrap percentage
• Maintenance expense to fixed assets ratio
For the sales and marketing department:
• Market share
• Customer turnover
• Browse to buy conversion ratio
• Direct mail effectiveness ratio
• Quote to close ratio
• Sales per salesperson
• Days of backlog
Each manager or supervisor concerned with the operations of the
firm or store should monitor at least two or three critical ratios on a
continuous basis. This information may be plotted on a daily basis to
accumulate historical information that could be used for planning,
control, and budgeting. Often this information will point up areas of
critical concern before it has a fatal effect. Therefore, ratios, if prop-
erly structured and monitored, can be powerful management tools.
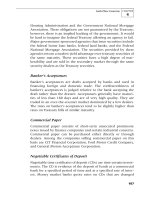
The Balanced Scorecard
Too often, a company focuses exclusively on its financial results. By
doing so, it may be forcing attention away from other key measures
that ultimately have a strong impact on financial performance and
enhance that performance in the long run. To counteract this prob-
lem, Robert Kaplan and David Norton published The Balanced
SECTION
III
204
p03.qxd 11/28/05 1:39 PM Page 204
Scorecard (Harvard Business School Press, 1996). In this book, the
authors make a strong case in favor of splitting up a company’s key
performance measurements into four areas—the financial, cus-
tomer, internal business processes, and learning and growth areas.
These areas are designed to build on each other, so that a proper
level of attention to the three nonfinancial measurement areas will
result in an improved set of financial measurements as well. An
example of this measurement system is shown in Figure 6.3. In it,
we see that the learning and growth measurements, shown in the
lower left-hand corner, are designed to improve the performance
of employees through training as well as reduced turnover (on
the grounds that fewer employee departures results in fewer new
employees, hence a more experienced staff). Measurements for
the last month are compared to those from previous periods, so that
employees can see trends in the measurements. Success in the learn-
ing and growth area should result in an improvement in the com-
pany’s internal business processes, which are itemized in the lower
right corner of the figure. In this area, increased employee train-
ing has led to improved processing time for customer orders as well
as the near completion of a just-in-time manufacturing system.
These process changes should result in improved customer-related
measurements, which are noted in the upper right corner. With
improved product quality, on-time shipments, and customer satisfac-
tion, we assume that financial performance will improve, which will
be reflected in the final box in the upper left corner. In this area, the
financial measures are closely tied to the corporate goal, which is
listed at the top of the page: to spin off enough cash from operations
to fund new facilities and acquire competitors. Thus, the balanced
scorecard reporting system results in a coherent set of interlocking
measurements that are directly tied to a company’s goals.
The balanced scorecard must be individualized for each com-
pany that uses it, since each one operates within a unique set of
constraints. The measurements used in the example are designed
for a manufacturing facility, and so would be inappropriate for use
by a service company. To obtain the correct set of measurements for
a balanced scorecard, a company’s senior management group should
compile a short list of the most appropriate measures, possibly with
the assistance of a trained facilitator who can keep the discussion
Performance Measurement Systems
CHAPTER
6
205
p03.qxd 11/28/05 1:39 PM Page 205
Evaluating the Operations of the Business
SECTION
III
206
FIGURE 6.3
The Balanced Scorecard
XYZ Company
Balanced Scorecard
Goal: To spin off enough cash flow to build new facilities and acquire competitors.
Financial:
Net profits 6%
This Month
This Quarter
Last Year
4.5%
3.4%
2.6%
Inventory Turns 20%
This Month
This Quarter
Last Year
16.0%
12.5%
12.0%
Receivable Turns 9.0%
This Month
This Quarter
Last Year
8.2%
7.6%
8.1%
Actual
Goal Customer:
Customer Satisfaction 95%
This Month
This Quarter
Last Year
59.5%
54.0%
50.0%
On-Time Shipments 98%
This Month
This Quarter
Last Year
71.0%
68.0%
42.0%
Quality Percentage 99.5%
This Month
This Quarter
Last Year
94.5%
91.3%
89.2%
Actual
Goal
Learning & Growth:
Employee Turnover
10%
This Month
This Quarter
Last Year
19.0%
21.0%
38.0%
Training Hours per
Employee Annualized
40
This Month
This Quarter
Last Year
29
25
21
Actual
Goal
Internal Business Processes:
Just-in-Time System
Percentage Complete 100%
This Month
This Quarter
Last Year
65%
45%
20%
Average Time to
Process Orders
2 Days
This Month
This Quarter
Last Year
2.9 Days
3.2 Days
3.5 Days
Actual
Goal
p03.qxd 11/28/05 1:39 PM Page 206