advanced financial accounting 7th edition_19 pptx
Bạn đang xem bản rút gọn của tài liệu. Xem và tải ngay bản đầy đủ của tài liệu tại đây (790.08 KB, 37 trang )
652 Part 3 · Accounting and price changes
The foregoing argument was not accepted by those charged with the task of reforming
accounting practice except in the period when it was advocated that both current cost and
historical cost accounts should be published. Conventional wisdom decreed that one set of
current value accounts was enough. The question of which asset valuation method should be
adopted was therefore central to the current value accounting debate.
The net realisable value (NRV) approach possesses a number of virtues. The total of the net
realisable values of a company’s assets does provide some measure of the risks involved in
lending to or investing in the company, in that the total indicates the amount that would be
available for distribution to creditors and shareholders should the business be wound up. This
point is, of course, dependent on the problems associated with the determination of net realis-
able values which were discussed in Chapter 4, and in particular the assumptions that are made
about the circumstances surrounding the disposal of the assets. It has also been argued, notably
by Professor R.J. Chambers, that the profit derived from a variant of the net realisable value
asset valuation basis,
6
shows, after adjusting for changes in the general price level, the extent to
which the potential purchasing power of the owners of an enterprise has increased over the
period. However, the potential would only be realised if all the assets were sold, and it must be
noted that in reality companies do not sell off all their assets at frequent intervals.
Advocates of net realisable value were, originally, mostly to be found in academia but, in the
1980s, support for this view emerged from a professional accountancy body in the form of a dis-
cussion document issued by the Research Committee of the Institute of Chartered Accountants
of Scotland.
7
The model advocated by the committee and their arguments in favour of the net
realisable value approach will be discussed in a little more detail in Chapter 21.
The general view of the supporters of CCA is that, in practice, companies continue in the
same line or lines of business for a considerable time, making only marginal changes to the
mix of their activities. It is therefore argued that if only one current value profit is to be pub-
lished then it should be based on the replacement cost approach. For if it is assumed that a
company is going to continue in the same line of business then it should only be regarded as
maintaining its ‘well-offness’ if it has generated sufficient revenue to replace the assets used
up. Thus, replacement cost was the preferred choice of those groups in the UK and most
overseas countries that recommended the introduction of CCA. A strict adherence to the use
of replacement cost, however, would not allow accounts to reflect the fact that companies do
change their activities or the manner in which they conduct their present activities and that
all the assets owned at any one time would not necessarily be replaced. Thus, some modifica-
tion of the replacement cost approach is required.
Deprival value/Value to the business
A suitable basis of asset valuation, which would lead to the use of replacement cost in those
circumstances where the owner would – if deprived of the asset – replace it and the use of a
lower figure if the asset was not worth replacement, was suggested by Professor J.C.
Bonbright in 1937. Professor Bonbright wrote, ‘The value of a property to its owner is ident-
ical in amount with the adverse value of the entire loss, direct and indirect, that the owner
might expect to suffer if he were deprived of the property’.
8
We have already introduced this
approach in Chapter 5.
6
A method known as Continuously Contemporary Accounting (CoCoA).
7
Making Corporate Reports Valuable, Kogan Page, London, 1988.
8
J.C. Bonbright, The Valuation of Property, Michie, Charlottesville, Va., 1937 (reprinted 1965).
Chapter 20 · Current cost acounting 653
Professor Bonbright’s main concern was with the question of the legal damages which
should be awarded for the loss of assets. He was not concerned with the impact of asset valu-
ation on the determination of accounting profit. Others, notably Professor W.T. Baxter in
the UK, recognised the relevance of this approach to accounting and developed the concept
in the context of profit measurement. Professor Baxter coined the term ‘deprival value’,
which neatly encapsulates the main point that the value of an asset is the sum of money that
the owner would need to receive in order to be fully compensated if deprived of the asset. It
must be emphasised that the exercise is of a hypothetical nature; the owner need not be
physically dispossessed of the asset in order for its deprival value to be determined. This
approach was proposed in the Sandilands Report and, renamed ‘Value to the Business’ or
‘Current Cost’, it became the asset valuation basis of CCA. Thus, in a current cost balance
sheet, assets would be shown at their deprival value, while a current cost profit and loss
account would show the current operating profit, determined as the difference between the
revenue recognised in the period and the deprival values of the assets consumed in the gen-
eration of revenue.
As we have seen earlier the ASB had, for many years, accepted the view that the value-to-
the-business model provides the most appropriate way of measuring the current value of an
asset but that more recently, as a result of its desire to achieve greater international agree-
ment, it has adopted a slightly different fair value approach (see, for example, Chapter 5).
Before turning to a discussion of CCA, it might be helpful if we explored the meaning of
deprival value in a little more detail. Ignoring non-pecuniary factors, the deprival value of an
asset cannot exceed its replacement cost, for the owner deprived of an asset could restore the
original position through the replacement of the asset. The owner might of course incur addi-
tional costs (e.g. a loss of potential profit) if there was any delay in replacement – the indirect
costs referred to in Professor Bonbright’s original definition. There may be circumstances
where these additional costs may be so substantial that they will need to be included in the
determination of the replacement cost, but generally these additional factors are ignored.
The owner might not feel that the asset was worth replacing, in which case the use of the
asset’s replacement cost would overstate its deprival value. Suppose that a trader owns 60
widgets, the current replacement cost of which is £3 per unit. Let us also assume that the
trader’s position in the market has changed since acquiring the widgets, that it will only be
possible to sell them for £2 each, and that this estimate can be made with certainty. The
trader’s other assets consist of cash of £100.
The trader’s wealth before the hypothetical loss of the widgets is £220 (actual cash of £100
plus the certain receipt of £120). Let us now assume that the trader is deprived of the wid-
gets. It is clear that the trader would only need to receive £120 in compensation, i.e. the net
realisable value of the widgets, to restore the original position. The trader, if paid £180 (the
replacement cost), would end up better off.
In order for an asset’s deprival value to be given by its net realisable value, the net realisable
value must be less than its replacement cost. Otherwise a rational owner (and in this analysis it
is assumed that owners are rational) would consider it worthwhile replacing the asset.
We must now consider a different set of circumstances under which the owner would not
replace the asset but has no intention of selling it. The asset may be a fixed asset that is obso-
lete in the sense that it would not be worth acquiring in the present circumstances of the
business. The asset is still of some benefit to the business and it is thought that this benefit
exceeds the amount that would be obtained from its immediate sale, i.e. its net realisable
value. This benefit will, at this stage, be referred to as the asset’s ‘value in use’.
An example of this type of asset might be a machine that is used as a standby for when
other machines break down. The probability of breakdowns may be such that it would not
654 Part 3 · Accounting and price changes
be worth purchasing a machine to provide cover because the replacement cost is greater than
the benefit of owning a spare machine. It must be emphasised that the relevant replacement
cost in this analysis is the cost of replacing the machine in its present condition and not the
cost of a new machine. The machine may have a low net realisable value (which may be neg-
ative if there are costs associated with the removal of the machine) which is less than its value
in use. In such circumstances an asset’s deprival value will be given by its value in use, which
would be less than its replacement cost but greater than its net realisable value.
As will be seen, the determination of an asset’s value in use often proves to be a difficult
task. In certain circumstances it may be possible to identify the cash flows that will accrue to
the owner by virtue of ownership of the asset and thus, given that an appropriate discount
rate can be selected, its present value can be found. In other instances the amount recover-
able from further use may have to be estimated on a more subjective basis. However, this
estimate will approximate to the asset’s present value and hence we will, at this stage, use the
term present value (PV) for simplicity.
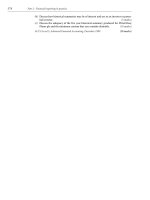
The above discussion is summarised in Figure 20.2.
In the case of a fixed asset, the replacement cost is the lowest cost of replacing the services
rendered by that asset rather than the cost of the physical asset itself. The replacement cost of
stock will depend on the normal pattern of purchases by the business and thus it will be
assumed that the usual discount for bulk purchases will be available.
The net realisable value of work-in-progress that would, in the normal course of business,
require further processing before it is sold needs careful interpretation. The conventional
definition of net realisable value in relation to stock is the ‘actual or estimated selling price
(net of trade but before settlement discounts) less (a) all further costs to completion and (b)
all costs to be incurred in marketing, selling and distributing’.
9
There is an alternative defini-
tion that is the amount that would be realised if the asset were sold in its existing condition
less the cost of disposal. For the purposes of determining the asset’s deprival value, the
higher of the two possible net realisable values will be taken.
Assume that a business holds an item of work-in-progress which could be sold for £200 in
its existing condition, but which could, after further processing costing £30, be sold for £250.
Replacement cost (RC)
Deprival value
is the lower of
Present value (PV)
and the higher of
Net realisable value (NRV)
Figure 20.2 A definition of deprival value
9
SSAP 9 Stocks and Long-term Contracts, revised September 1988.
Chapter 20 · Current cost acounting 655
Also assume that its replacement cost is £350 and thus its replacement cost does not yield its
deprival value.
In this case the asset’s deprival value is £220 so long as the period required to complete and
market the stock is brief enough for us to be able to ignore the effect of discounting. It is clear
that, before the hypothetical deprival of the asset, the business would expect to receive £220
from its sale after taking account of the additional processing costs. If, on the other hand, the
increase in the sales proceeds that would be expected if the asset were processed was less than
the additional manufacturing costs, a rational owner would sell the asset in its existing condi-
tion and the net sales proceeds under these circumstances would give its deprival value.
In the context of Figure 20.2, six different situations can be envisaged:
1 RC < NRV < PV; then the deprival value is given by the RC. In this case the asset’s RC is
less than both its NRV and PV. It is worth replacing and because its PV is greater than its
NRV it is likely that the asset involved is a fixed asset that will be retained for use within
the company.
2 RC < PV < NRV; then the deprival value is given by the RC. As (1) except that as the
asset’s NRV exceeds its PV the asset will be sold and is probably part of the trading stock
of the business.
3 PV < RC < NRV; then the deprival value is given by the RC. The asset would be replaced
and then sold. It is almost certain to be part of the trading stock.
4 NRV < RC < PV; then the deprival value is given by the RC. This is likely to be a fixed
asset. It is worth replacing since its PV is greater than its RC.
5 NRV < PV < RC; then the deprival value is given by the PV. This asset is not worth
replacing, but given that it is owned it will be retained since its PV is greater than its NRV.
This is likely to be a fixed asset that would not now be worth purchasing but is worth
retaining because of its comparatively low NRV.
6 PV < NRV < RC; then the deprival value is given by the NRV. This is the second case
where the asset’s value to the business is not its RC. The asset is not worth replacing nor is
there any point in keeping it. It is obviously an asset that should be sold immediately. It
might be an obsolete fixed asset whose scrap value is now greater than the benefit that
would be obtained from its retention. Alternatively, the asset might be an item of trading
stock in respect of which there has been a change in the business’s place in the market, i.e.
it can no longer acquire or manufacture the stock for an amount which is less than its sell-
ing price net of expenses.
It is clear that the deprival value of a fixed asset can only be given by its replacement cost or
present value. The deprival value of an asset is based on its net realisable value only when it
would be in the interest of the business to dispose of the asset. Thus, following the conven-
tional definition of a current asset – an asset which will be used up within a year of the balance
sheet date or within the operating cycle of the business, whichever is the longer – an asset
whose deprival value is given by the net realisable value should be classified as a current asset.
The trading stock of a business is, by definition, an asset which is held for sale and hence
its deprival value will either be its replacement cost or its net realisable value but not its pre-
sent value (although in the case of stock which will not be sold for a considerable time its net
realisable value may itself be based on the present value of future cash flows).
The deprival value of other current assets may be any of the three possible figures. Consider,
as an example, the case of an unexpired insurance premium. Its deprival value is the loss that
would be suffered if the insurance company could no longer honour its obligations. If the busi-
ness felt that it was worth replacing the asset and would take out a new policy to cover the risk,
the asset’s deprival value would be given by its replacement cost. But suppose that it was
656 Part 3 · Accounting and price changes
believed that the cost of the new policy would outweigh the benefits that would be afforded by
the policy. If the perceived benefits from the policy exceed the amount that could be obtained
if the business surrendered the policy, the asset’s deprival value would be its ‘present value’ (or
value in use), which would be an amount which is less than the replacement cost but greater
than its net realisable value (or the surrender value of the policy). It may be that the net realis-
able value exceeds the perceived benefit that would flow from the retention of the policy. In
this instance, the deprival value of the asset is its net realisable value but, if this was indeed the
case, the business should, in any event, surrender the policy.
The basic elements of current cost accounting
We are now in a position to introduce the basic elements of current cost accounting. In
order to be able to concentrate on the principles involved we shall use very simple examples.
The current cost balance sheet
In a current cost balance sheet both assets and liabilities should in principle be shown at cur-
rent cost, that is at deprival value or value to the business.
The current cost of short-term monetary assets will be the same as the amounts at which
they appear in historical cost accounts. Hence, the assets that will appear at a different
amount in a current cost balance sheet will be non-monetary assets, usually tangible fixed
assets, investments and stocks.
In theory, liabilities should also be stated in terms of their ‘current costs’. To do this we
need to turn the definition of current cost around and ask how much the debtor would gain
if he or she were released from the obligation to repay the debt. Clearly, all other things
being equal, the longer the period before the debt is due, the less the gain from the extinction
of the debt.
The ‘current cost’ or ‘relief value’ of a liability could be calculated by reference to its pre-
sent value. Thus, if we ignore interest costs, the balance sheet figure for a debt of £100 000
repayable next month would be higher than a debt of the same nominal value repayable in
ten years’ time, the difference between the two figures depending on the discount rate.
In the early attempts to introduce CCA, liabilities continued to be recorded at their nom-
inal values. However, there have been a number of developments in such areas as accounting
for leases and retirement benefits, which are resulting in long-term liabilities being measured
on the basis of their present values.
The total owners’ equity in a current cost balance sheet is, as in a historical cost balance
sheet, the difference between the assets and liabilities, but part of it will be treated as a
reserve reflecting the amounts needed to be retained within the business to deal with the
effect of changing prices. The size of the reserve, and its appropriate description, will depend
on the selected capital maintenance concept (see Chapter 4).
The current cost profit and loss account
A current cost profit and loss account includes a number of items not found in one based on the
historical cost convention. The actual number will depend on the chosen capital mainte
nance
Chapter 20 · Current cost acounting 657
concept, which may be ‘operating capital maintenance’ or ‘financial capital maintenance’.
We shall look at each in turn.
Operating capital maintenance
We will first examine a current cost profit and loss account based on the maintenance of
operating capital. Operating capital may be defined in a number of ways, but it is usual to
think of it as the productive capacity of the company’s assets in terms of the volume of goods
and services capable of being produced. Thus, from this standpoint, a company will only be
deemed to have made a profit if its productive capacity at the end of a period is greater than
it was at the start of the period after adjusting for dividends and capital introduced and with-
drawn.
The most convenient way of measuring a company’s operating capital is by using, as a
proxy, its net operating assets. So, a company will only be deemed to have made a profit if it
has maintained the level of its net operating assets. As we shall see later, it is difficult to reach
agreement as to what constitutes net operating assets. At this stage we will regard net operat-
ing assets as a company’s fixed assets, stock and all monetary assets less current liabilities.
As explained in Chapter 4, if the company is partly financed by creditors, the profit attrib-
utable to the equity holders is different from, and in periods of rising prices greater than, the
entity profit (current cost operating profit) on the assumption that part of the additional
funds needed to maintain the operating capital is provided by creditors.
There are four ‘current cost adjustments’ which might appear in a current cost profit and
loss account and which may be regarded as ‘converting’ a historical cost profit into a current
cost profit. The first three are the ‘current cost operating adjustments’ and the fourth is the
gearing adjustment:
1 Cost of sales adjustment (COSA): This is the difference between the current cost of goods
sold and the historical cost.
2 Depreciation adjustment: This is the difference between the depreciation charge for the
year based on the current cost of the fixed assets and the charge based on their historical
cost.
3 Monetary working capital adjustment (MWCA): Monetary working capital may be defined
as cash plus debtors less current liabilities. In order to operate, most companies need to
invest in monetary working capital as well as in fixed assets, thus they might need to hold
a certain level of cash and sell on credit but will also be able to buy on credit. All other
things being equal, an increase in prices will mean that a company will have to increase its
investment in monetary working capital, and the purpose of the MWCA is to show the
additional investment required to cope with price increases. Of course, some companies
can operate with negative working capital, for example a supermarket chain which buys
on credit but sells for cash. In such instances an increase in prices will result in a reduc-
tion in monetary working capital and the MWCA would then be a negative figure
reflecting that reduction.
4 The gearing adjustment: The gearing adjustment is the link between the current cost oper-
ating profit and the current cost profit attributable to the equity shareholders. It depends
on the assumption that part of the additional funds required to be invested in the business
as a result of increased prices will be provided by long-term creditors.
These adjustments are illustrated below.
Since X Limited started trading all prices have remained constant; hence the balance sheet as
at 1 January 20X2, shown below, satisfies both the historical cost and current cost conventions.
658 Part 3 · Accounting and price changes
Balance Sheet as at 1 January 20X2
££
Share capital and Fixed assets
reserves 4500 purchased 31 Dec 20XI 3600
Loan (interest free) 4500 Stock (200 units) 2000
Debtors 2400
Cash 1000
–––––– ––––––
£9000 £9000
–––––– ––––––
–––––– ––––––
X Limited buys for cash and sells on one month’s credit.
The company incurs no overhead expenses.
The fixed asset is to be written off over three years on a straight-line basis.
The mark-up is constant at 20 per cent on historical cost determined using the first-in
first-out method of stock valuation.
Stock is held constant at 200 units: the monthly sales are 200 units. The cost of stock at
the end of the previous month was £10 per unit; the cost of purchases increased by 10 per
cent at the beginning of the month. The replacement cost of the fixed asset increased by 50
per cent on that date. Thereafter all prices are held constant.
All profits are paid out by way of dividend at the end of each month.
We will first present the historical cost accounts for January 20X2:
Historical cost profit and loss account for the month of January 20X2
££
Sales, 200 × £10 × 1.2 2400
less Opening stock 2000
Purchases, 200 × £10 × 1.1 2200
––––––
4200
Less Closing stock 2200 2000
–––––– ––––––
400
Less Depreciation 1/36 of £3600 100
––––––
Profit for month 300
less Dividend £300
––––––
––––––
Historical cost balance sheet as at 31 January 20X2
££
Fixed assets 3500
Stock 2200
Debtors 2400
Cash £(1000 + 2400 – 2200 – 300)* 900
––––––
£9000
––––––
––––––
Share capital and reserves 4500
Loan (interest free) 4500
––––––
£9000
––––––
––––––
* Opening balance plus cash collected from debtors less purchases less dividends.
Chapter 20 · Current cost acounting 659
We will now look at the four adjustments on the assumption that the current cost of the
assets is given by their replacement cost.
Cost of sales adjustment (COSA)
£
Replacement cost of the 200 units sold
200 × £10 × 1.1 2200
Historical cost of goods sold 2000
––––––
COSA £200
––––––
––––––
Depreciation adjustment
Depreciation charge for month based on the
current cost of the fixed assets
1/36 × £3600 × 1.5 150
Depreciation charge based on
historical costs 100
––––
Depreciation adjustment £50
––––
––––
Note that in this simple introductory example we have assumed away the problem of the val-
uation of part-used assets, i.e. there is no prior or backlog depreciation.
10
Monetary working capital adjustment (MWCA)
The company’s opening monetary working capital consists of a cash balance of £1000, which
represents half its monthly purchases (at the old prices) and debtors of £2400 (one month’s
sales). Hence, if it is assumed that for operational reasons the company will need to maintain
the same relative position, an increase in the cost of purchases of 10 per cent will mean that
the company’s investment in working capital will also need to increase by 10 per cent.
Its opening monetary working capital was £3400;
11
hence the MWCA is 10 per cent of
£3400 = £340.
The current cost operating profit and operating capability
Before turning to the gearing adjustment it is instructive to see what has happened so far. We
started with a profit on the historical cost basis of £300 and have made three adjustments,
10
Backlog depreciation represents the restatement of the depreciation charged in prior periods necessary to reflect
the increase of the value of the asset that has occurred in the current period.
11
Debtors include the profit on the sales. Strictly the profit element should be eliminated from the calculation of
the MWCA as follows:
£
Cost of stock with debtors
× £2400 2000
Cash balance 1000
––––––
MWC £3000
––––––
MWCA 10% of £3000 £300
––––––
We shall, however, ignore this complication.
10
––
12
660 Part 3 · Accounting and price changes
the cumulative effect of which is:
££
Historical cost profit 300
less COSA 200
Depreciation adjustment 50
MWCA 340 590
–––– ––––
Current cost operating loss £290
––––
––––
This example is based on the maintenance of operating capital, and the current cost operat-
ing loss of £290 can be related to the company’s operating capacity as measured by its
holding of net operating assets in the following way.
In order to be in the same position at the end of the month as it was at the beginning the
company would need to:
(a) be able to replace that part of the fixed asset that has been consumed during the period
(we will assume for the sake of the argument that the asset can be replaced in bits). At
current prices it will need to set aside £150 to replace one-thirty-sixth of the asset (1/36
× £5400 = £150);
(b) hold stocks of £2200;
(c) carry debtors equal to one month’s sales at the new price, £2640 (£2400 + 10% of £2400);
(d) hold a cash balance of £1100 (half the cost of one month’s purchases).
We can now compare the required holding of assets with that which actually exists.
Required holding of assets
££
Fixed assets
remaining 3500
required for replacement 150
Stock 2200
Debtors 2640
Cash 1100
––––––
9590
Assets available at the end of
the month
Fixed assets 3500
Stock 2200
Debtors 2400
Cash 900 9000
–––––– ––––––
Shortfall 590
––––––
––––––
The shortfall can be explained by two factors
£
Dividend paid 300
Current cost operating loss 290
––––
590
––––
––––
Thus, it appears that, if it is the company’s intention to maintain its operating capital, it
should not have paid the dividend, but even if the dividend had not been paid, the com-
pany’s operating capital would have been reduced by £290.
Many advocates of CCA would say that the above line of argument is unduly prudent
because it ignores the fact that part of the company is financed by long-term creditors. They
would include a gearing adjustment of some kind.
Chapter 20 · Current cost acounting 661
The gearing adjustment
The purpose of the gearing adjustment is to show how much of the additional investment
required to counter the effects of increased prices would be provided by longer-term creditors
12
on the assumption that the existing debt-to-equity ratio, in this example 1:1, will be maintained.
Unfortunately, the gearing adjustment is another example of a failure to agree on the most
appropriate method and there are at least two ways of calculating the gearing adjustment. The
most commonly used, the so-called restricted or partial gearing adjustment, was based on the
assumption that the current cost profit attributable to shareholders should bear the burden of
only that part of the cost of sales, depreciation and monetary working capital adjustments
financed by the shareholders, in this case 50 per cent. Thus, the restricted gearing adjustment is
a credit to current cost operating profit of 50 per cent of the total of the three adjustments, i.e.:
£
COSA 200
Depreciation adjustment 50
MWCA 340
––––
£590
––––
––––
The gearing adjustment, 50% of £590 = £295.
Putting all this together, the current cost profit attributable to shareholders can be deter-
mined as follows:
££
Historical cost profit 300
less COSA 200
Depreciation adjustment 50
MWCA 340 590
–––– ––––
Current cost operating loss 290
Add Gearing adjustment 295
––––
Current cost profit attributable to
shareholders £5
––––
––––
Thus, the company could pay a dividend of £5 and still maintain its operating capital so long
as the long-term creditors provide (or will provide if asked at some stage in the future) £295.
Some argue that this gearing adjustment is unduly restrictive because it fails to take into
account unrealised holding gains (UHG) that will be reflected in a current cost balance sheet
and which will reduce the debt-to-equity ratio thus affording the opportunity for further
borrowings. In this case the unrealised holding gain on the fixed asset is 50 per cent of
35/36ths of £3600 = £1750.
The alternative, the natural or full gearing adjustment, is based on the sum of the UHG
and the current cost adjustments – in this case 50 per cent of (£590 + £1750) = £1170, and
thus the current cost profit attributable to shareholders becomes £880.
The use of the full gearing adjustment is based on the assumption that creditors would be
prepared to lend the company an additional £1170 that would maintain the existing debt-to-
equity ratio.
12
Short-term creditors, such as trade creditors, have been ignored in this example. In practice, short-term creditors
were included in monetary working capital.
662 Part 3 · Accounting and price changes
The current cost accounts
The current cost profit and loss account for January, using the restricted gearing adjustment,
can be presented as follows:
Current cost profit and loss account for the month of January 20X2
££
Sales 2400
Cost of goods sold:
Historical cost 2000
COSA 200 2200
–––– –––––
200
Depreciation:
Historical cost 100
Depreciation adjustment 50 150
–––– ––––
50
MWCA 340
––––
Current cost operating loss 290
Gearing adjustment (restricted) 295
––––
Current cost profit attributable to
shareholders 5
Dividend, assumed equal to
Profit £5
––––
––––
A distinction can be made between the three current cost operating adjustments. One, the
depreciation adjustment, represents the restated value of the cost of an asset consumed
during the period and will thus be credited to the provision for depreciation. The other
adjustments relate to the additional investments required to maintain operating capability
and will be credited to a current cost reserve account.
Another adjustment is required in the balance sheet in respect of the fixed asset. At the
beginning of the month the fixed asset’s current cost (equal in this instance to its historical
cost) was £3600. This increased by 50 per cent to £5400 on the first day of the month.
However, the decision to depreciate the asset on a straight-line basis assumes that one-thirty-
sixth of the asset is used up in the month and hence 1/36 of the total gain of £1800, £50, is
realised and the balance unrealised.
The total gain of £1800 is debited to the fixed asset account and credited to the current
cost reserve account.
The gearing adjustment is debited to the current cost reserve account.
The current cost balance sheet as at 31 January 20X2 is therefore:
££
Fixed assets at current cost 5 400
less Provision for depreciation 150 5250
––––––
Stock 2 200
Debtors 2 400
Cash (assuming a dividend of £5)* 1 195
––––––––
£11 045
––––––––
––––––––
Chapter 20 · Current cost acounting 663
££
Share capital and reserves 4 500
Current cost reserve account (see below) 2 045
–––––––
6 545
Loan (interest free) 4 500
––––––––
£11 045
––––––––
––––––––
Current cost reserve
Gain on fixed assets 1 800
COSA 200
MWCA 340
–––––––
2 340
less Gearing adjustment 295
–––––––
£2 045
–––––––
–––––––
*1000 + 2400 – 2200 – 5 = £1195
If we had used the full gearing adjustment, £1170, the current cost profit attributable to
shareholders, and in this case the dividend, would be £880, thus reducing the assets to £10 170
and the current cost reserve to £1170. These figures illustrate the argument in favour of the
full gearing adjustment because if the creditors did increase their loan by the amount of this
gearing adjustment, £1170, the original debt-to-equity ratio of 1 : 1 would be maintained. The
introduction of funds equal to the restricted gearing adjustment would not have the same
effect because of the failure to recognise the unrealised holding gain.
The consequences of using the different approaches are illustrated in the following sum-
mary balance sheets that assume that additional borrowings, equal to the appropriate
gearing adjustment, are obtained.
Restricted Full gearing
gearing adjustment adjustment
£ £££
Sundry assets 9 850 9 850
Cash 1 195 320
––––––– –––––––
11 045 10 170
Additional cash generated
by fresh borrowings 295 1170
––––––– –––––––
£11 340 £11 340
––––––– –––––––
––––––– –––––––
Share capital and reserves 4 500 4 500
Current cost reserve account 2 045 1 170
––––––– –––––––
6 545 5 670
Original loan 4 500 4 500
Additional loan 295 4 795 1 170 5 670
–––––– ––––––– –––––– –––––––
£11 340 £11 340
––––––– –––––––
––––––– –––––––
Debt-to-equity ratio 1 : 1.36 1 : 1
Financial capital maintenance
We will now consider current cost accounts in which profit is measured on the basis of finan-
cial capital maintenance. The focus here is on the shareholders and whether their interest in the
664 Part 3 · Accounting and price changes
company has increased or not. There are two versions of financial capital maintenance, one
based on monetary units and the second based upon purchasing power units. While the
former ignores inflation, the latter takes into account inflation, as measured, say, by the RPI,
and hence attempts to show whether or not the interest of the shareholders in the company
has increased in ‘real’ terms. For the remainder of this chapter, we shall confine ourselves to
this real terms version of financial capital maintenance.
If it is assumed that no capital is introduced or withdrawn during the period, the ‘real
terms’ profit can be found as follows:
(a) Measure the shareholders’ funds at the beginning of the period based on the current cost
of assets.
(b) Restate that amount in terms of pounds of purchasing power at the balance sheet date
by use of a relevant index of general prices (such as the RPI).
(c) Compare the restated amount from (b) with the shareholders’ funds at the end of the
year, based on the current cost of assets. If shareholders’ funds at the end of the period
exceed the restated figure for the beginning of the period, a ‘profit’ has been made.
Using our earlier illustration and assuming that on average prices increased by 20 per cent
over one month and that no dividends were paid, we can calculate the total real gain as follows:
(a) Shareholders’ funds based on current costs as at 1 January 20X2, £4500.
(b) If prices increased on average by 20 per cent over the month, shareholders’ funds would
need to amount to £5400 (£4500 × 1.20) if real financial capital is to be maintained.
(c) Calculation of total real gain
£
Shareholders’ funds at 31 January 20X2
at current cost
Fixed assets 5 250
Stock 2 200
Debtors 2400
Cash (before dividend) 1200
–––––––
11 050
less Loan 4 500
–––––––
Funds at 31 January 20X2 6 550
Funds at 1 January 20X2, restated in terms of
31 January 20X2 purchasing power 5 400
–––––––
Total real gains for January £1150
–––––––
–––––––
The above calculation gives no indication of how the gain was achieved. There are many
ways of presenting a profit and loss account based on the maintenance of financial capital.
One simple version based on our illustration is given below.
It starts in a similar fashion to the profit and loss account based on the maintenance of
operating capital, in that it shows a current cost operating profit but without the inclusion of
the monetary working capital adjustment which, along with the gearing adjustment, is
inconsistent with the approach taken to monetary items in a system which does not seek to
indicate the additional finance required to sustain a given level of net operating assets.
To the modified current cost operating profit are added the holding gains, distinguished
between realised and unrealised. The cost of sales and depreciation adjustments are realised
holding gains, which means that they are debited in the first part of the statement but are
added back, or credited, in the second section.
Chapter 20 · Current cost acounting 665
The sum of the modified current cost operating profit and the total holding gains is
described as the ‘total gains’.
Finally, the ‘inflation adjustment’ is deducted from the total gains to give the total real gains.
Profit and loss account for January 20X2
‘Real terms’ (based on the maintenance of financial capital)
££
Sales 2400
Cost of goods sold: historical cost 2000
COSA 200
Depreciation: historical cost 100
depreciation adjustment 50 2350
–––––– ––––––
Current cost operating profit 50
add Realised holding gains:
Cost of sales adjustment 200
Depreciation adjustment 50
––––––
250
Unrealised holding gains: fixed asset 1750 2000
–––––– ––––––
Total gains 2050
less Inflation adjustment (20% × £4 500) 900
––––––
Total real gains £1150
––––––
––––––
Summary
We started the chapter by describing the theoretical roots of current cost accounting and
paid tribute to the contributions made by Edwards and Bell, Bonbright and Baxter. We
explained that Edwards and Bell developed the distinction between holding and operating
gains while Bonbright and, subsequently, Baxter developed the ideas associated with the
deprival value concept, which is also known as value to the business and current cost.
We then introduced the basic elements of Current Cost Accounting (CCA), using the
deprival value concept of asset valuation and two different possible concepts of capital main-
tenance, operating capital maintenance and financial capital maintenance respectively. The
first requires four current cost adjustments which we described and illustrated, namely the
cost of sales, depreciation, monetary working capital and gearing adjustments. The second
replaces the monetary working capital and gearing adjustments by an inflation adjustment
based on a general index such as the Retail Price Index (RPI).
Recommended reading
See end of Chapter 21.
Questions
See end of Chapter 21.
In the previous two chapters we examined the attempts of the ASC to design a system of
accounting to replace or supplement the traditional historical cost accounts. In Chapter 19,
we explored the Current Purchasing Power (CPP) model while, in Chapter 20, we introduced
the basic elements of the Current Cost Accounting (CCA) model.
In this chapter, we start by assessing the virtues of this CCA system for some of the main
purposes for which periodic financial statements are used. We then explore an alternative
system, real terms current cost accounting, which combines the most useful features of
both CPP and CCA.
As long ago as 1988 the Institute of Chartered Accountants of Scotland publication,
Making Corporate Reports Valuable,
1
took a much more revolutionary approach to the
reform of accounting and we outline the major features of this report which include a call for
further study of a system of accounting based upon the valuation of assets at their net real-
isable values rather than at their current cost.
Finally we explore the evolution of the ASB’s approach to dealing with changing prices,
an approach which undoubtedly reflects the reduced interest in such changes during the era
of low inflation rates experienced in the last decade of the twentieth century and maintained
in the early years of this century. The ASB approach has severe limitations, even in a period
of low inflation, but nonetheless lays good foundations to cope with the situation when the
merits of an approach to financial reporting based on a systematic use of current values
becomes more widely accepted or, of course, when inflation rates begin to rise again.
The utility of current cost accounts
In Chapter 4 we identified some of the main purposes served by the publication of periodic
financial statements and examined the extent to which traditional historical cost financial
statements served those purposes. Here we assess the extent to which current cost accounts
would satisfy those same purposes, namely control, taxation, consumption and valuation.
Control
Current cost accounts are likely to be more helpful than historical cost accounts or current
purchasing power accounts in helping shareholders and others to assess how well or badly
the directors have employed the resources which have been entrusted to them, especially
1
P.N. McMonnies (ed.), Making Corporate Reports Valuable, Institute of Chartered Accountants of Scotland and
Kogan Page, London, 1988.
Beyond current cost accounting
chapter
21
overview
Chapter 21 · Beyond current cost accounting 667
through the use of such measures as return on capital employed. The current cost accounts
attempt to show the current values of the assets of the company and whether or not the net
assets have increased during a period after allowing for either specific or general price
changes, depending upon which capital maintenance concept is applied. Thus, it may be
argued that the current cost accounts would provide a better vehicle for the exercise of con-
trol by shareholders and others.
There were obvious weaknesses with the ASC’s preferred current cost model, notably the
complete absence of regard to changes in the general price level found in the operating capi-
tal maintenance variant, and the partial treatment provided by the financial capital
maintenance approach.
Taxation
If one makes the not unreasonable assumption that a government would only wish to levy
taxation on any surplus that is generated after the substance of the business has been main-
tained, then it can be seen that CCA is likely to provide a better basis for taxation than the
historical cost or CPP methods.
It must be recognised that the amount of taxation payable by a company depends not
only upon the way in which its taxable profit is calculated, but also upon the nominal tax
rate applied to that taxable profit. Even if the government were to adopt current cost profits,
rather than historical cost profits, as the basis for the computation of taxable profits, it might
still wish to raise the same amount from the taxation of business profits. If such were the
case, there would be a redistribution of the tax burden within the business sector, with no
change in the total burden on that sector.
Current cost accounting does prima facie seem to provide a suitable basis for taxation, but
since equity and clarity are desirable characteristics of any system of taxation much more will
have to be done if taxes are to be based on current cost accounting. In particular, the degree
of choice allowed to companies, especially with regard to the capital maintenance concept,
would need to be reduced. It is unlikely that the Inland Revenue would accept the degree of
subjectivity involved in any system of current cost accounting that has yet been developed.
The treatment of the gearing adjustment would also require careful consideration. It is
reasonable to include the gearing adjustment in arriving at the profit subject to taxation, as it
does offset the cost of interest which is charged to the accounts, so only the real cost of inter-
est as opposed to the nominal charge would be allowed against tax. However, if this were
done, there would be a strong case for not taxing the whole of the interest payments received
by lenders, thus allowing them some relief from inflation. Such a change would have signifi-
cant consequences for the whole of the tax system – both personal and corporate – and is
unlikely to be made without a good deal of discussion.
Consumption
As is the case with taxation, the extent to which financial statements assist in the making and
monitoring, by shareholders and others, of the consumption or dividend decision depends
on the concept of capital that is to be ‘maintained’. Although at its present state of develop-
ment there is no general agreement as to the most suitable capital maintenance concept for
CCA, it does not seem unreasonable to suggest that both the operating and financial capital
668 Part 3 · Accounting and price changes
bases provide more useful information than that provided by the historical cost model
which, as we have argued at various places in this book, can be extremely dangerous in that
dividends may be paid unwittingly out of capital.
In developing the CCA model, its advocates placed considerable emphasis on the divi-
dend decision, but in some respects this aim resulted in a degree of complexity that hindered
the acceptance of current cost accounting. The gearing adjustment was perhaps the most
striking example. Such complexity may be inevitable in a system of accounting that does
attempt to reflect reality – for reality is rarely simple. To take the dividend decision as an
example, the desires of a short-term shareholder and a director/shareholder interested in
security of employment will be very different. If CCA is complex because it tries to present
information that will be of value to both groups, should such complexity be condemned?
2
In developing CCA the emphasis was also placed on the needs of larger companies but it
is often in the humbler parts of the business world that we find disasters caused by a level of
consumption (through drawings or dividends) which is not supported by profits. If those
responsible for the conduct of small and medium-sized enterprises are presented, as they are,
with historical cost accounts which indicate they have generated a healthy profit, can one be
surprised if some of them ‘blow the lot’, rather than intuitively estimating the cost of sales
and other adjustments in order to see how much of that apparent profit needs to be retained
to keep the business operating at its existing level?
If it is not yet possible to devise a suitable method for applying CCA principles in a way
that would be appropriate to the circumstances of smaller enterprises, then, at the very least,
the traditional historical cost accounts should carry a health warning.
Va luation
The sum of the values of the assets less liabilities of a business as shown in a current cost bal-
ance sheet will not, other than in the simplest of cases, be the same as the value of the
businesses as a whole, but it is likely that the current cost total will give a better approxima-
tion to this value than the figures that are disclosed by the historical cost accounts.
It is not necessary at this stage to spell out the reasons why there is a difference between
the total of the values of the individual assets less liabilities and the value of the business as a
whole, as the subject of the valuation of a business was discussed earlier. The main reason for
the difference is that which is covered by the concept of goodwill, which recognises that an
existing business will usually possess substantial intangible assets such as reputation, estab-
lished relationships with suppliers and customers, and managerial skills, which are not
recorded in a balance sheet.
The above discussion of goodwill was based on the assumption that the value of the busi-
ness was greater than the total of the values of the assets less liabilities. The reverse can also
be true, and a potential weakness of the CCA model is that it can overstate the value of the
assets in particular because of the existence of interdependent assets. This problem arises
from the fact that assets will be valued at their replacement cost unless a permanent diminu-
tion in value has been recognised. If each asset is considered individually and the values
aggregated, it may be seen that they are collectively not worth replacing and thus that a value
less than the sum of their replacement values should be placed on them. A hypothetical
example of this situation is that of a railway line which runs through two tunnels. Assume
2
As is it is stated in the Statement of Principles (Para. 3.37), ‘Information that is relevant and reliable should not be
excluded from the financial statements simply because it is too difficult for some users to understand’.
Chapter 21 · Beyond current cost accounting 669
that the present value of the railway line is £400 000 and the replacement cost of each tunnel
is £250 000. If each tunnel is considered in isolation, it is clear that if either were destroyed it
would be worth replacing, and thus would be valued for CCA purposes at £250 000.
However, it is clear that if both tunnels were simultaneously destroyed they would not be
replaced because the total replacement cost would exceed the benefit that would be derived
from the action.
The appropriate action in the above example is to treat the railway line as an income-
generating unit
3
and value the assets of the unit on the basis of their value in use. However, it
will not always be possible to identify where such treatment is necessary and hence the risk of
the overstatement of the assets still remains and is likely to be greater when applying current
cost rather than historical cost accounting principles.
Thus, while it will generally be true that the current cost balance sheet totals will provide a
closer approximation to the value of the business than historical cost information, there will
still be substantial differences between the two values. This is not to be taken as a criticism of
CCA in that the designers of the system did not set this as one of the objectives of CCA.
However, it is likely that many laypeople will not fully appreciate this point, and there may
well be some confusion on the part of the general public, who may believe that a system of
current cost accounts should tell them how much a business is worth.
Interim summary
CCA is certainly not the perfect system of accounting in that there is more than one way of
reflecting the activities of a business. Neither is it a perfect system of accounting in that, even
within its own parameters, it is capable of improvement. The important practical question
that had to be addressed was whether the benefits of current cost accounts exceeded the costs
of developing the system and of preparing those accounts.
Attempts were made to try to answer this question, including studies commissioned by
the ASC on the implementation of SSAP 16. The general conclusion was that there were
some advantages to be gained from the publication of current cost information in that its
availability provided a better basis for decision making than a complete reliance on historical
cost accounts.
The fact that current cost accounts never really took hold suggests either that the benefits
did not exceed the costs or that those parties on which the costs fell, the companies and
auditors, have much more political clout with the standard setters than the users, who would
be expected to benefit from the information.
CPP and CCA combined
The relationship between accounting for changes in specific prices and accounting for
changes in general prices has always been uneasy. As described in Chapter 19, the early
moves to reform in the UK tended to polarise the position – the reformed models were
based on either CPP or CCA ignoring inflation. So why not combine the most helpful fea-
tures of CCA and CPP? Such an approach has been advocated by a number of accountants,
3
FRS 8 Impairment of Fixed Assets and Goodwill, see Chapter 5.
670 Part 3 · Accounting and price changes
mostly of the academic variety.
4
The change in shareholders’ equity derived from a set of
fully stabilised
5
financial statements based on ‘value to the business’ asset valuation is the
same as that derived from the ASC’s approach, but there is an important difference because
of the treatment of price changes during the year and because of the treatment of monetary
items. A fully stabilised set of financial statements will, for example, show the loss or gain on
holding monetary assets and liabilities.
The basic principles can be illustrated in the following example.
Guy started a business on 1 January 20X3 with £1000 which he used to purchase 100 units of
stock for £10 each. Trading was not overactive during the year and the only sales were 60 units
for £18 each on 31 December 20X3.
For simplicity we will assume that he incurred no overheads during the year. Let us suppose
that the general price level increased by 10 per cent over the year while the replacement cost of
stock increased by 15 per cent. Then Guy’s only sales transaction can be analysed as follows:
£
Cost of sales 600
Inflation increase 60
–––––
Cost of sales restated in current pounds (at 31.12.19X3) 660
Price increase in excess of inflation 30
–––––
Replacement cost at date of sale 690
Sales 1080
–––––
Profit £ 390
–––––
–––––
If we had prepared a standard CCA profit and loss account we would also have shown a profit of
£390, as this is the difference between the sales proceeds and the current cost of the stock con-
sumed. The major difference between the CCA approach and the above is that, in the latter, the
CCA cost of sales adjustment of £90 has been broken down into two elements: (a) £60, which
represents the amount by which the cost of the stock held needed to increase in order to keep
step with inflation, and (b) £30, the amount by which the increase in the current cost of the stock
exceeded inflation. The justification for disaggregating the CCA cost of sales adjustment in this
way is that, if account is taken of the fall in the value of money, then the whole of £90 cannot be
regarded as a realised holding gain, as £60 merely represents that which is required to keep step
with inflation and is not a ‘real gain’. In consequence, that element of the nominal gain which is
required to keep step with inflation (£60 in this case) is sometimes known as the fictitious holding
gain, whereas the real realised holding gain (or loss) is the difference between the current cost of
the asset at the date at which it is consumed and the restated historical cost (i.e. the historical
cost adjusted for the change in the general price level).
Example 21.1
4
See, for example, W.T. Baxter, Accounting Values and Inflation, McGraw-Hill, London, 1975.
5
Fully stabilised means that all items are expressed in forms of a constant purchasing power, usually the unit of
purchasing power on the balance sheet date.
Chapter 21 · Beyond current cost accounting 671
If we now turn our attention to the closing stock the same approach can be used, i.e.:
££
Current cost of closing stock £400 × 1.15 460
Historical cost of closing stock 400
Inflation adjustment (fictitious unrealised holding gain) 10% 40 440
–––– ––––
Real unrealised holding gain £20
––––
––––
Opening financial capital was £1000 and, if real financial capital is to be maintained, this amount
must be enhanced by 10 per cent to take account of the fall in the value of money.
On the basis of the above considerations, Guy’s accounts for 20X3 would appear as follows:
Profit and loss account 20X3
£
Sales 1080
Current cost of goods sold 690
–––––
Operating profit £390
–––––
–––––
Statement of gains/losses 20X3
£
Operating profit 390
Realised real holding gain 30
Unrealised real holding gain 20
–––––
£440
–––––
–––––
Balance sheet as at 31 December 20X3
££
Capital 1.1.X3 1000
Inflation adjustment 10% 100 1100
–––––
Reserves
Realised gains
Operating 390
Holding 30 420
–––––
Unrealised gains 20
–––––
£1540
–––––
–––––
Stock at current cost (40 items @
£11.50) 460
Cash (60 @ £18) 1080
–––––
£1540
–––––
–––––
The capital and reserves section of the balance sheet well illustrates the different views that may
be taken with regard to distribution. If it is accepted that capital is maintained if assets less liabil-
ities at the balance sheet date equal opening capital after adjusting for inflation, then the
maximum that could be distributed without diminishing capital is £440. If it is argued that only
realised profits should be distributed then the dividend should be restricted to £420. If it is argued
that the business must retain sufficient funds to maintain the same level of activity (i.e. be able to
replace the 60 units sold) the maximum dividend is equal to the realised operating gain of £390.
▲
672 Part 3 · Accounting and price changes
This last line of argument brings us to the current cost account approach that it is the operat-
ing capability of the business that must be kept intact if capital is to be maintained. Thus, it can
be seen that within the combined CCA/CPP approach it is possible to focus on a profit calculated
on the basis of physical capital maintenance. The authors, along with most other writers on the
subject, would not, however, advocate that this be done, as they believe that the concept of
‘operating capability’ is unclear and ambiguous. However, even if the maintenance of real finan-
cial capital is taken to be the benchmark used to measure profit, it may still be of value to show
what proportion of the operating profit has been paid out by way of dividend so that users can
see the extent to which the reserves of the business have increased or decreased after setting
aside a sum to allow for increases in specific prices over the rate of inflation. The formulation
used in the above simple example would allow this assessment to be made as well as showing
the extent to which the total gains are realised.
Before turning to a slightly more complex example, we will discuss those issues, which we
were able to sidestep in our very simple example – the monetary working capital and gearing
adjustments.
The monetary working capital and gearing adjustments arise from the attempts to measure
changes in operating capability. The first attempts to show the increased investment required
in monetary working capital, and the second strives to show the extent to which the increased
investment in stocks, fixed assets and monetary working capital would be provided by credi-
tors. These adjustments are not required in a stabilised accounting system based on the
maintenance of real financial capital. In such a system, the impact of inflation on monetary
items is the loss or gain on both the business’s short- and long-term monetary positions mea-
sured in the way described in Chapter 19.
Example 20.2 illustrates one way of combining current cost asset valuation with the main-
tenance of real financial capital.
Suppose that Park Limited started business on 1 January 20X2. On that date the company issued
12 000 £1 shares and £4000 of debentures and purchased fixed assets for £12 000 and stock of
£6000. The purchases were partly financed by an overdraft of £2000.
Park’s balance sheet at 1 January 20X2 is then
££
Share capital £12 000 Fixed assets £12000
Debentures 4 000 Stock (100 units) 6 000
Overdraft (2 000)
–––––––– ––––––––
£16 000 £16000
–––––––– ––––––––
–––––––– ––––––––
We will assume that all transactions took place on 1 July 20X2. On that date Park Limited pur-
chased another 400 units for £75 (total £30 000) and sold 380 units for £36 000. Closing stock at
FIFO cost is thus £9000.
Overhead expenses, including debenture interest, all paid for cash on 1 July 20X2, amounted
to £5000. On 1 July the company paid its suppliers £27 000 and received £31 000 from its cus-
tomers; thus trade creditors at 31 December 20X2 amounted to £3000 and trade debtors
equalled £5000. The company’s overdraft at the year end was:
Example 21.2
Chapter 21 · Beyond current cost accounting 673
£
Overdraft at 1 January 20X2 2 000
add Paid to suppliers 27 000
Paid for overheads 5 000
–––––––
34 000
less Received from customers 31 000
–––––––
Overdraft at 31 December 20X2 £3 000
–––––––
–––––––
Depreciation is to be provided at 20 per cent per annum on a straight-line basis.
Assume that the appropriate price indices moved as follows:
Date 1 January 1 July 31 December
General price index 90 100 110
Stock price index 80 100 120
Fixed asset price index 95 100 105
Note that the stock price index increased by more than the rate of inflation while the fixed asset
price index rose by less (i.e. the price of the fixed assets fell in real terms).
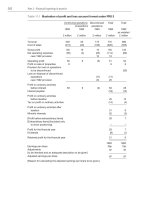
In order to see clearly how certain elements of CCA can be combined with a set of CPP
accounts, it is helpful to prepare first the CPP accounts. These will appear as follows:
CPP accounts
Profit and loss account for 20X2 £(31 Dec) £(31 Dec) Workings
Sales, 36 000 × 110/100 £39 600
less Opening stock,
£6000 × 110/90 7 333
Purchases,
£30 000 × 110/100 33 000
–––––––
40 333
less Closing stock,
£90 000 × 110/100 9 900 30433
––––––– –––––––
Gross profit 9 167
less Overheads,
£5000 × 110/100 5500
Depreciation,
£2400 × 110/90 2 933 8 433
––––––– –––––––
734
Gain on short-term monetary items 344 (A1)
Gain on long-term monetary items 889 1 233 (A1)
––––––– –––––––
CPP profit for the year £1 967
–––––––
–––––––
▲
674 Part 3 · Accounting and price changes
Balance sheet as at 31 December 20X2
£(31 Dec) £(31 Dec)
Fixed assets
Cost
£12 000 × 110/90 14 667
less Accumulated
depreciation,
£2400 × 110/90 2933 11 734
–––––––
Current assets
Stock, £900 × 110/100 9 900
Debtors 5 000
–––––––
14 900
Current liabilities
Creditors (3 000)
Overdraft (3000) 8 900
––––––– –––––––
20 634
Debentures 4 000
–––––––
£16 634
–––––––
–––––––
Share capital,
£12 000 × 110/90 14 667
Retained profits 1 967
–––––––
£16 634
–––––––
–––––––
CPP workings
(A1) Loss on short-term monetary items is given by:
Conversion
Actual £ factor £(31 Dec)
1 Jan Opening balance 2 000 110/90 2 444
1 July Sales 36 000 110/100 39 600
Purchases 30 000 110/100 33 000
Overheads 5 000 110/100 5 500
31 Dec Closing balance 1 000 1 344
––––––– ––––––– ––––––– –––––––
£37 000 £37000 £40 944 £40 944
––––––– ––––––– ––––––– –––––––
––––––– ––––––– ––––––– –––––––
Gain on short-term monetary items is £(31 Dec) (1344 – 1000) = £(31 Dec) 344.
Gain on long-term monetary liabilities is:
£(31 Dec) 4000
(
– 1
)
= £(31 Dec) 889
Real holding gains
Four adjustments need to be calculated, the realised and unrealised real gains (or losses) on
stock and fixed assets expressed in closing pounds.
(a) Real realised gain on stock (the cost of sales adjustment) Stock with a historical cost of
£27 000 was sold on 1 July by which date the stock price index had moved to 100, i.e. the
replacement cost at date of sale was:
Opening stock, £(1 Jan) 6000 × 100/80 £(1 July) 7 500
1 July purchases £(1 July) 21 000
–––––––
£(1 July) 28 500
–––––––
–––––––
110
––––
90
Chapter 21 · Beyond current cost accounting 675
These are 1 July pounds and have to be converted to year-end pounds:
£(1 July) 28 500 × 110/100 £(31 Dec) 31 350
Cost of goods sold per CPP profit and loss account £(31 Dec) 30 433
–––––––
Cost of sales adjustment £(31 Dec) 917
–––––––
–––––––
(b) Real realised loss on fixed assets (depreciation adjustment)
£(31 Dec)
Depreciation charge based on movement in specific
prices, £2400 × 105/95 2 653
Depreciation charge per CPP accounts 2 933
––––––
Depreciation adjustment (loss) (280)
––––––
––––––
Note:
(i) Depreciation is based on year-end prices.
(ii) The loss means that the cost of the asset consumed (deemed to be 20% of the fixed
assets) increased by less than the rate of inflation.
(c) Real unrealised gain on stock
£(31 Dec)
Closing stock
At replacement cost, £9000 × 120/100 10 800
At adjusted historical cost £900 × 110/100 9 900
––––––
Real unrealised gain 900
––––––
––––––
(d) Real unrealised loss on fixed assets
£(31 Dec)
Net book value at 31 Dec
At replacement cost 80% of £12 000 × 105/95 10611
At adjusted historical cost (per CPP accounts), 80%
of £12 000 × 110/90 11 734
––––––
Real unrealised loss
6
(1 123)
––––––
––––––
We are now in a position to present the accounts, which we will do in summarised form:
Profit and loss account
£(31 Dec) £(31 Dec)
Sales 39 600
less: Current cost of goods sold 31 350
Overheads 5500
Depreciation 2 653 39 503
–––––– ––––––
Current cost operating profit 97
––––––
––––––
▲
6
Since this is the first year in the life of the assets and as depreciation is based on year-end values, there is no back-
log depreciation.
676 Part 3 · Accounting and price changes
Statement of gains and losses
£(31 Dec) £(31 Dec)
Current cost operating profit 97
Gains/losses on assets
Realised
Gain on stock 917
Loss on fixed assets (280) 637
––––––
Unrealised
Gain on stock 900
Loss on fixed assets (1123) (223)
––––––
Gains on monetary items (per CPP accounts)
Short term 344
Long term 889 1233
–––––– ––––––
1744
––––––
––––––
Balance sheet as at 31 December
£(31 Dec) £(31 Dec)
Fixed assets, net current replacement cost 10 611
Current assets
Stock at replacement cost 10 800
Debtors 5000
––––––
15 800
Current liabilities
Creditors (3 000)
Overdraft (3 000) 9800
–––––– –––––––
20 411
Debentures (4 000)
–––––––
16 411
–––––––
–––––––
Share capital
Issued 12000
Inflation adjustment
7
2 667 14 667
––––––
Reserves 1 744
–––––––
16 411
–––––––
–––––––
A real alternative – Making Corporate Reports Valuable
Even a casual perusal of the earlier chapters of this book would lead the reader to conclude
both that most accountants (both theoretical and practical) who have thought seriously about
the issues agree that historical cost accounting is unhelpful and, in periods of rapid price
changes, positively dangerous and that the current cost accounting path to reform has proved
difficult to travel and may not bring us to the promised land. Perhaps we should approach the
problem from another direction? Is there a real alternative? Some, but as yet very few, accoun-
tants believe that there is. In the 1960s and 1970s, a number of theoreticians, notably
7
In years other than the first, the inflation adjustment would be applied to the opening balance of shareholders’
equity. In this case the inflation adjustment is £12000 (110/90 – 1) = £2667.