Barfield Raiborn Kinney Cost Accounting_3 pot
Bạn đang xem bản rút gọn của tài liệu. Xem và tải ngay bản đầy đủ của tài liệu tại đây (620.01 KB, 50 trang )
three days for a local seafood festival. To produce this order, WF&B workers had
to work overtime. People’s Seafood Stores’ bill for the shipment should reflect the
overtime charges.
Because people historically performed the majority of production activity, di-
rect labor once represented a primary production cost. Now, in highly automated
work environments, direct labor often comprises less than 10 to 15 percent of to-
tal manufacturing cost. Soon, managers may find that almost all direct labor cost
is replaced with a new production cost—the cost of robots and other fully auto-
mated machinery. Consider the accompanying News Note regarding the diminished
cost and size of direct labor in the era of high technology.
Overhead
Overhead is any factory or production cost that is indirect to manufacturing a prod-
uct or providing a service and, accordingly, does not include direct material and
direct labor. Overhead does include indirect material and indirect labor as well as
any and all other costs incurred in the production area.
8
As direct labor has be-
come a progressively smaller proportion of product cost in recent years, overhead
has become progressively larger and merits much greater attention than in the past.
The following comments reflect these fundamental changes in the way manufac-
turing is conducted:
Automation, technology and computerization have shifted costs, making
the typical manufacturing process less labor intensive and more capital inten-
sive. This shift has changed the cost profile of many industries. No longer do di-
rect materials and labor costs make up the major portion of total product cost.
Instead, overhead, which is shared by many products and services, is the dom-
inant cost.
9
Part 2 Systems and Methods of Product Costing
92
Workers who specifically work on
a product should be classified
as direct labor and their wages
can be assigned, without any
allocation method, to production.
Why and how are overhead
costs allocated to products
and services?
6
8
Another term used for overhead is burden. Although this is the term under which the definition appears in SMA No. 2, Man-
agement Accounting Terminology, the authors believe that this term is unacceptable because it connotes costs that are extra,
unnecessary, or oppressive. Overhead costs are essential to the conversion process, but simply cannot be traced directly to
output.
9
Sidney J. Baxendale and Michael J. Spurlock, “Does Activity-Based Cost Management Have Any Relevance for Electricity?”
Public Utilities Fortnightly (July 15, 1997), p. 32.
Overhead costs are either variable or fixed based on their behavior in response
to changes in production volume or some other activity measure. Variable over-
head includes the costs of indirect material, indirect labor paid on an hourly ba-
sis (such as wages for forklift operators, material handlers, and others who sup-
port the production, assembly, and/or service process), lubricants used for machine
maintenance, and the variable portion of factory electricity charges. Depreciation
calculated using either the units-of-production or service life method is also a vari-
able overhead cost; this depreciation method reflects a decline in machine utility
based on usage rather than time passage and is appropriate in an automated plant.
Fixed overhead comprises costs such as straight-line depreciation on factory
plant assets, factory license fees, and factory insurance and property taxes. Fixed
indirect labor costs include salaries for production supervisors, shift superinten-
dents, and plant managers. The fixed portion of factory mixed costs (such as main-
tenance and utilities) is also part of fixed overhead. An example of fixed overhead
for a professional sports team is depreciation of arena seating. The accompanying
News Note on page 94 discusses a trend in cost management that does not sit too
well with some sports fans.
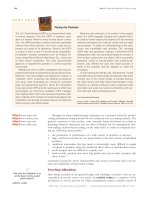
One important overhead cost is the amount spent on quality. Quality is a
managerial concern on two general levels. First, product or service quality from
the consumer perspective is an important consideration because consumers want
the best quality they can find for the money. Second, managers are concerned
about production process quality because higher process quality leads to greater
Chapter 3 Organizational Cost Flows
93
Firms See High-Wage Germany in A New Light
NEWS NOTEINTERNATIONAL
They’re still talking about it. The roof-raising ceremony for
Motorola’s new $110-million cellular-telephone factory in
Germany [in 1998] was one of a kind.
But how typical is Motorola with its big investment in
Germany? Isn’t this the land of the fading economic mir-
acle? The place where consumer demand is flat on its
back, and where no one can agree on how to bring down
unemployment hovering near the double digits? Is Mo-
torola crazy to bet on Germany? German manufacturing
labor costs may be the highest in the world—more than
$31 an hour, or nearly twice the U.S. figure—and people
here may regularly disappear for the world’s longest va-
cations and sick leaves. You can’t lay off thousands here
in one fell swoop.
Consider Varta, a big German maker of batteries. Un-
til last year, it was making small, rechargeable “button-
cell” batteries at a big plant in Singapore, a city-state
known for its disciplined work force and other competi-
tive strengths. That plant had seven production lines and
employed about 500 people.
But in 1995—way too early to be influenced by the
current Asian financial upheavals—Varta decided to
move its button-cell operation back home to Germany.
Here, according to board member Wout van der Kooij,
Varta has been able to set up far more modern machin-
ery and, beginning this year, is able to produce 50% more
batteries than in Singapore in a tenth the space. Only 70
Germans will be needed to run the plant.
“If you need to pay only 70 people, then the high wage
cost of Germany is not relevant anymore,” Van der Kooij
said. “What is relevant,” he said, “is Germany’s techno-
logical infrastructure: the host of skilled electrochemical
engineers and related technicians available on the job
market. Electrochemists are virtually nonexistent in South-
east Asia,” Van der Kooij said. But with their abundance
here in Germany, Varta could install its state-of-the-art
equipment, confident of maintaining it, repairing it and
buying needed supplies without ever leaving the com-
pany’s own backyard.
Because the German working class tends to be so
well-educated, [Norbert] Quinkert [Motorola Country
Manager] said, “Motorola’s existing cell-phone factory
here has higher productivity than the company’s other
such plants in China, Scotland, and Illinois. The only bad
mark Motorola’s German plant gets,” he said, “is for its
high direct labor costs—but labor accounts for only 2%
of the total cost of manufacturing a cellular phone.”
SOURCE
: Mary Williams Walsh, “Firms See High-Wage Germany in a New Light,”
Los Angeles Times—Sunday Home Edition
(April 12, 1998), p. D1.
/>magic
/>redskins
customer satisfaction through minimizing production cycle time, cost, and defects.
Both levels of quality generate costs that often total 20 to 25 percent of sales.
10
The two categories of quality costs are the cost of control and the cost of failure
to control.
The cost of control includes prevention and appraisal costs. Prevention costs
are incurred to improve quality by precluding product defects and dysfunctional
processing from occurring. Amounts spent on implementing training programs, re-
searching customer needs, and acquiring improved production equipment are pre-
vention costs. Amounts incurred for monitoring or inspection are called appraisal
costs; these costs compensate for mistakes not eliminated through prevention.
The second category of quality costs is failure costs, which may be internal
(such as scrap and rework) or external (such as product returns caused by qual-
ity problems, warranty costs, and complaint department costs). Expenditures made
for prevention will minimize the costs that will be incurred for appraisal and fail-
ure. Quality costs are discussed in greater depth in Chapter 8.
In manufacturing, quality costs may be variable in relation to the quantity of
defective output, step fixed with increases at specific levels of defective output, or
fixed. Rework cost approaches zero if the quantity of defective output is also nearly
zero. However, these costs would be extremely high if the number of defective
parts produced were high. In contrast, training expenditures are set by manage-
ment and might not vary regardless of the quantity of defective output produced
in a given period.
Part 2 Systems and Methods of Product Costing
94
Stadium Squeeze Play
NEWS NOTE QUALITY
At a time when most indoor arenas are spending millions
of dollars on a slew of upgrades, from cigar bars to
gourmet chow, one aspect of the fan experience is qui-
etly shrinking: seat size. Indeed, many sports patrons are
being stuffed into chairs that are about as wide as a com-
puter keyboard, or the average coach-class airplane
seat.
And it’s only getting worse. A new basketball and
hockey arena that’s being built in Atlanta will be state-
of-the-art in all respects except one: seats that could be
as narrow as 18 inches in some places. Another, Den-
ver’s Pepsi Center, plans to jam in up to 30% more seats
per row.
For their part, National Basketball Association teams
and stadium officials say they’re simply trying to keep
pace with the soaring player salaries and construction
costs. At today’s ticket prices, one general-admission
seat can generate $1 million in revenue over a facility’s
lifetime, experts say. “If the Orlando Magic hadn’t reno-
vated its arena to fit an additional 2,000 seats four years
ago,” says team executive Pat Williams, “the Magic would
have had to hike ticket prices to an untenable level.”
“I know some longtime fans will never get over it,” Mr.
Williams says, “But without the extra seats we would have
been priced out of business.”
“It’s like a sardine can,” says a longtime Washington
Redskins fan who has season tickets at the team’s new
Jack Kent Cooke Stadium in suburban Maryland. “It’s
good to have someone you love sitting next to you.”
Back in Portland, Jerry Nothman, a former season
ticket holder, didn’t like his new basketball arena seat.
Arena officials say it’s possible some fans might have
wound up in narrower chairs when the team moved there
in 1995. But they insist that the average seat size is still
pretty much the same.
But Mr. Nothman isn’t buying it. And he’s not buying
season tickets anymore, either. Last year, he declined to
renew them for the first time in 22 years. “It was insult-
ing,” he says. “I don’t mind sitting on a wooden bench
for $7, but if someone is going to charge me $60, I ex-
pect a certain comfort level.”
SOURCE
: Sam Walker, “Stadium Squeeze Play,”
The Wall Street Journal
(March
26, 1999), pp. W1, W4. Permission conveyed through the Copyright Clearance
Center.
10
“Measuring the Cost of Quality Takes Creativity” (Grant Thornton) Manufacturing Issues (Spring 1991), p. 1.
Chapter 3 Organizational Cost Flows
95
ACCUMULATION AND ALLOCATION OF OVERHEAD
Direct material and direct labor are easily traced to a product or service. Overhead,
on the other hand, must be accumulated over a period and allocated to the prod-
ucts manufactured or services rendered during that time. Cost allocation refers to
the assignment of an indirect cost to one or more cost objects using some rea-
sonable basis. This section of the chapter discusses underlying reasons for cost
allocation, use of predetermined overhead rates, separation of mixed costs into
variable and fixed elements, and capacity measures that can be used to compute
predetermined overhead rates.
Why Overhead Costs Are Allocated
Many accounting procedures are based on allocations. Cost allocations can be made
over several time periods or within a single time period. For example, in financial
accounting, a building’s cost is allocated through depreciation charges over its use-
ful or service life. This process is necessary to fulfill the matching principle. In cost
accounting, production overhead costs are allocated within a period through the
use of predictors or cost drivers to products or services. This process reflects ap-
plication of the cost principle, which requires that all production or acquisition
costs attach to the units produced, services rendered, or units purchased.
Overhead costs are allocated to cost objects for three reasons: (1) to determine
a full cost of the cost object, (2) to motivate the manager in charge of the cost ob-
ject to manage it efficiently, and (3) to compare alternative courses of action for
management planning, controlling, and decision making.
11
The first reason relates
to financial statement valuations. Under generally accepted accounting principles
(GAAP), “full cost” must include allocated production overhead. In contrast, the
assignment of nonfactory overhead costs to products is not normally allowed un-
der GAAP.
12
The other two reasons for overhead allocations are related to inter-
nal purposes and, thus, no hard-and-fast rules apply to the overhead allocation
process.
Regardless of why overhead costs are allocated, the method and basis of the
allocation process should be rational and systematic so that the resulting informa-
tion is useful for product costing and managerial purposes. Traditionally, the in-
formation generated for satisfying the “full cost” objective was also used for the
second and third objectives. However, because the first purpose is externally fo-
cused and the others are internally focused, different methods can be used to pro-
vide different costs for different needs.
Predetermined Overhead Rates
In an actual cost system, actual direct material and direct labor costs are accu-
mulated in Work in Process Inventory as the costs are incurred. Actual production
overhead costs are accumulated separately in an Overhead Control account and
are assigned to Work in Process Inventory at the end of a period or at completion
of production.
The use of an actual cost system is generally considered to be less than desir-
able because all production overhead information must be available before any cost
allocation can be made to products or services. For example, the cost of products
and services produced in May could not be calculated until the May electricity bill
is received in June.
11
Institute of Management Accountants, Statements on Management Accounting Number 4B: Allocation of Service and Adminis-
trative Costs (Montvale, N.J.: NAA, June 13, 1985), pp. 9–10.
12
Although potentially unacceptable for GAAP, certain nonfactory overhead costs must be assigned to products for tax
purposes.
actual cost system
cost allocation
An alternative to an actual cost system is a normal cost system, which uses
actual direct material and direct labor costs and a predetermined overhead (OH)
rate or rates. A predetermined overhead rate (or overhead application rate) is
a budgeted and constant charge per unit of activity that is used to assign overhead
cost from an Overhead Control account to Work in Process Inventory for the pe-
riod’s production or services.
Three primary reasons exist for using predetermined overhead rates in prod-
uct costing. First, a predetermined rate allows overhead to be assigned during the
period to the goods produced or services rendered. Thus, a predetermined over-
head rate improves the timeliness (though it reduces the precision) of information.
Second, predetermined overhead rates compensate for fluctuations in actual
overhead costs that are unrelated to activity. Overhead may vary monthly because
of seasonal or calendar factors. For example, factory utility costs may be highest
in the summer. If monthly production were constant and actual overhead were as-
signed to production, the increase in utilities would cause product cost per unit to
be higher in the summer than in the rest of the year. If a company produced 3,000
units of its sole product in each of the months of April and July but utilities were
$600 in April and $900 in July, then the average actual utilities cost per unit for
April would be $0.20 ($600 Ϭ 3,000 units) and $0.30 ($900 Ϭ 3,000) in July. Al-
though one such cost difference may not be significant, numerous differences of
this type could cause a large distortion in unit cost.
Third, predetermined overhead rates overcome the problem of fluctuations in
activity levels that have no impact on actual fixed overhead costs. Even if total
production overhead were the same for each period, changes in activity would
cause a per-unit change in cost because of the fixed cost element of overhead. If
a company incurred $600 utilities cost in each of October and November but pro-
duced 3,750 units of product in October and 3,000 units of product in November,
its average actual unit cost for utilities would be $0.16 ($600 Ϭ 3,750 units) in Oc-
tober but $0.20 ($600 Ϭ 3,000 units) in November. Although one such overhead
cost difference caused by fluctuation in production activity may not be significant,
numerous differences of this type could cause a large distortion in unit cost. Use
of an annual, predetermined overhead rate would overcome the variations demon-
strated by the examples above through application of a uniform rate of overhead
to all units produced throughout the year.
To calculate a predetermined OH rate, divide the total budgeted overhead cost
at a specific activity level by the related activity level for a specific period:
Predetermined OH Rate ϭ
Overhead cost and its related activity measure are typically budgeted for
one year “unless the production/marketing cycle of the entity is such that the
use of a longer or shorter period would clearly provide more useful informa-
tion.”
13
For example, the use of a longer period would be appropriate in a com-
pany engaged in activities such as constructing ships, bridges, or high-rise office
buildings.
A company should use an activity base that is logically related to overhead
cost incurrence. The activity base that may first be considered is production vol-
ume, but this base is reasonable if the company manufactures only one type of
product or renders only one type of service. If multiple products or services exist, a
summation of production volumes cannot be made to determine “activity” because
of the heterogeneous nature of the items.
To most effectively allocate overhead to heterogeneous products, a measure
of activity must be determined that is common to all output. The activity base
Total Budgeted OH Cost at a Specified Activity Level
ᎏᎏᎏᎏᎏᎏ
Volume of Specified Activity Level
Part 2 Systems and Methods of Product Costing
96
normal cost system
predetermined overhead
rate
13
Institute of Management Accountants, Statements on Management Accounting Number 2G: Accounting for Indirect Production
Costs (Montvale, N.J.: NAA, June 1, 1987), p. 11.
should be a cost driver that directly causes the incurrence of overhead costs. Di-
rect labor hours and direct labor dollars have been commonly used measures of
activity; however, the deficiencies caused by using these bases are becoming more
apparent as companies become increasingly automated. Using direct labor to al-
locate overhead costs in automated plants results in extremely high overhead rates
because the costs are applied over a smaller number of labor hours (or dollars).
In automated plants, machine hours may be more appropriate for allocating over-
head than either direct labor base. Other traditional measures include number of
purchase orders and product-related physical characteristics such as tons or gal-
lons. Additionally, innovative new measures for overhead allocation include num-
ber or time of machine setups, number of parts, quantity of material handling time,
and number of product defects.
APPLYING OVERHEAD TO PRODUCTION
The predetermined overhead rates are used throughout the year to apply overhead
to Work in Process Inventory. Overhead may be applied as production occurs,
when goods or services are transferred out of Work in Process Inventory, or at the
end of each month. Under real-time systems in use today, overhead is frequently
applied continuously. Applied overhead is the amount of overhead assigned to
Work in Process Inventory as a result of incurring the activity that was used to de-
velop the application rate. Application is made using the predetermined rate(s) and
the actual level(s) of activity.
Overhead can be recorded either in separate accounts for actual and applied
overhead or in a single account. If actual and applied accounts are separated, the
applied account is a contra account to the actual overhead account and is closed
against it at year-end. The alternative, more convenient, recordkeeping option is
to maintain one general ledger account that is debited for actual overhead costs
and credited for applied overhead. This method is used throughout the text.
Additionally, overhead may be recorded in a single overhead account or in
separate accounts for the variable and fixed components. Exhibit 3–8 presents the
alternative overhead recording possibilities.
If separate rates are used to apply variable and fixed overhead, the general
ledger would most commonly contain separate variable and fixed overhead ac-
counts. When separate accounts are used, mixed costs must be separated into their
variable and fixed components or assigned to either the variable or fixed overhead
general ledger account. Because overhead costs in an automated factory represent
an ever larger part of product cost, the benefits of separating costs according to
their behavior are thought to be greater than the time and effort expended to make
that separation.
Chapter 3 Organizational Cost Flows
97
EXHIBIT 3–8
Cost Accounting System
Possibilities for Manufacturing
Overhead
VOH Actual
XXX
VOH Applied
YYY
VOH
Actual Applied
XXX YYY
Manufacturing
Overhead
Total Total
actual applied
XXX YYY
XX YY
FOH Actual
XX
FOH Applied
YY
FOH
Actual Applied
XX YY
Separate Accounts For Actual &
Applied and For Variable & Fixed
Combined Accounts
For Actual & Applied;
Separate Accounts
For Variable & Fixed
Combined Account
For Actual & Applied
and For Variable & Fixed
applied overhead
Regardless of the number (combined or separate) or type (plantwide or de-
partmental) of predetermined overhead rates used, actual overhead costs are deb-
ited to the appropriate overhead general ledger account(s) and credited to the var-
ious sources of overhead costs. Applied overhead is debited to Work in Process
Inventory and credited to the overhead general ledger account(s). Actual activity
causes actual overhead costs to be incurred and overhead to be applied to Work
in Process Inventory. Thus, actual and applied overhead costs are both related to
actual activity, and only by actual activity are they related to each other.
Assume that during March 2001, the Cutting and Mounting Department incurs
5,000 machine hours. Actual variable and fixed overhead costs for the month were
$10,400 and $7,300, respectively. Assume also that applied variable overhead for March
is $10,000 (5,000 ϫ $2.00) and applied fixed overhead is $7,150 (5,000 ϫ $1.43).
The journal entries to record actual and applied overhead for March 2001 are
Variable Manufacturing Overhead 10,400
Fixed Manufacturing Overhead 7,300
Various Accounts 17,700
To record actual manufacturing overhead.
Work in Process Inventory 17,150
Variable Manufacturing Overhead 10,000
Fixed Manufacturing Overhead 7,150
To apply variable and fixed manufacturing
overhead to WIP.
At year-end, actual overhead will differ from applied overhead and the difference
is referred to as underapplied or overapplied overhead. Underapplied overhead
means that the overhead applied to Work in Process Inventory is less than actual
overhead; overapplied overhead means that the overhead applied to Work in
Process Inventory is greater than actual overhead. Underapplied or overapplied
overhead must be closed at year-end because a single year’s activity level was used
to determine the overhead rate(s).
DISPOSITION OF UNDERAPPLIED AND OVERAPPLIED OVERHEAD
Disposition of underapplied or overapplied overhead depends on the significance
of the amount involved. If the amount is immaterial, it is closed to Cost of Goods
Sold. When overhead is underapplied (debit balance), an insufficient amount of
overhead was applied to production and the closing process causes Cost of Goods
Sold to increase. Alternatively, overapplied overhead (credit balance) reflects the
fact that too much overhead was applied to production, so closing overapplied
overhead causes Cost of Goods Sold to decrease. To illustrate this entry, note that
the Cutting and Mounting Department has an overhead credit balance at year-end
of $40,000 in Manufacturing Overhead as presented in the upper left section of
Exhibit 3–9; we first assume this amount to be immaterial for illustrative purposes.
The journal entry to close overapplied overhead that is assumed to be immaterial is
Manufacturing Overhead 40,000
Cost of Goods Sold 40,000
If the amount of underapplied or overapplied overhead is significant, it should
be allocated among the accounts containing applied overhead: Work in Process
Inventory, Finished Goods Inventory, and Cost of Goods Sold. A significant amount
of underapplied or overapplied overhead means that the balances in these accounts
are quite different from what they would have been if actual overhead costs had
been assigned to production. Allocation restates the account balances to conform
more closely to actual historical cost as required for external reporting by gener-
ally accepted accounting principles. Exhibit 3–9 uses assumed data for the Cutting
and Mounting Department to illustrate the proration of overapplied overhead among
the necessary accounts; had the amount been underapplied, the accounts debited
Part 2 Systems and Methods of Product Costing
98
underapplied overhead
overapplied overhead
What causes underapplied
or overapplied overhead and
how is it treated at the end
of a period?
7
and credited in the journal entry would be the reverse of that presented for over-
applied overhead. A single overhead account is used in this illustration.
Theoretically, underapplied or overapplied overhead should be allocated based
on the amounts of applied overhead contained in each account rather than on total
account balances. Use of total account balances could cause distortion because they
contain direct material and direct labor costs that are not related to actual or applied
overhead. In spite of this potential distortion, use of total balances is more common
in practice for two reasons. First, the theoretical method is complex and requires de-
tailed account analysis. Second, overhead tends to lose its identity after leaving Work
in Process Inventory, thus making more difficult the determination of the amount of
overhead in Finished Goods Inventory and Cost of Goods Sold account balances.
ALTERNATIVE CAPACITY MEASURES
One primary cause of underapplied or overapplied overhead is a difference in
budgeted and actual costs. Another cause is a difference in the level of activity or
capacity chosen to compute the predetermined overhead and the actual activ-
ity incurred. Capacity refers to a measure of production volume or some other
activity base. Alternative measures of activity include theoretical, practical, normal,
and expected capacity.
The estimated maximum potential activity for a specified time is the theoretical
capacity. This measure assumes that all factors are operating in a technically and
humanly perfect manner. Theoretical capacity disregards realities such as machinery
breakdowns and reduced or stopped plant operations on holidays. Choice of this
level of activity provides a probable outcome of a material amount of underapplied
overhead cost.
Chapter 3 Organizational Cost Flows
99
Manufacturing Overhead Account Balances
Actual $220,000 Work in Process Inventory $ 45,640
Applied 260,000 Finished Goods Inventory 78,240
Overapplied $ 40,000 Cost of Goods Sold 528,120
1. Add balances of accounts and determine proportional relationships:
Balance Proportion Percentage
Work in Process $ 45,640 $45,640 Ϭ $652,000 7
Finished Goods 78,240 $78,240 Ϭ $652,000 12
Cost of Goods Sold 528,120 $528,120 Ϭ $652,000 81
Total $652,000 100
2. Multiply percentages times overapplied overhead amount to determine the amount of
adjustment needed:
Adjustment
Account % ؋ Overapplied OH ؍ Amount
Work in Process 7 ϫ $40,000 ϭ $ 2,800
Finished Goods 12 ϫ $40,000 ϭ $ 4,800
Cost of Goods Sold 81 ϫ $40,000 ϭ $32,400
3. Prepare journal entry to close manufacturing overhead account and assign adjustment
amount to appropriate accounts:
Manufacturing Overhead 40,000
Work in Process Inventory 2,800
Finished Goods Inventory 4,800
Cost of Goods Sold 32,400
EXHIBIT 3–9
Proration of Overapplied
Overhead
capacity
theoretical capacity
Reducing theoretical capacity by ongoing, regular operating interruptions (such
as holidays, downtime, and start-up time) provides the practical capacity that
could be achieved during regular working hours. Consideration of historical and
estimated future production levels and the cyclical fluctuations provides a normal
capacity measure that encompasses the long run (5 to 10 years) average activity of
the firm. This measure represents a reasonably attainable level of activity, but will
not provide costs that are most similar to actual historical costs. Thus, many firms use
expected annual capacity as the selected measure of activity. Expected capacity
is a short-run concept that represents the anticipated activity level of the firm for
the upcoming period, based on projected product demand. It is determined dur-
ing the budgeting process conducted in preparation of the master budget for that
period. The process for preparing the master budget is presented in Chapter 13.
If actual results are close to budgeted results (in both dollars and volume), this
measure should result in product costs that most closely reflect actual costs and,
thus, an immaterial amount of underapplied or overapplied overhead.
14
Part 2 Systems and Methods of Product Costing
100
practical capacity
normal capacity
expected capacity
14
Except where otherwise noted in the text, expected annual capacity has been chosen as the basis to calculate the prede-
termined fixed manufacturing overhead rate because it is believed to be the most prevalent practice. This choice, however,
may not be the most effective for planning and control purposes as is discussed further in Chapter 10 with regard to standard
cost variances.
ACCUMULATION OF PRODUCT COSTS—ACTUAL COST SYSTEM
Product costs can be accumulated using either a perpetual or a periodic inventory
system. In a perpetual inventory system, all product costs flow through Work in
Process Inventory to Finished Goods Inventory and, ultimately, to Cost of Goods
Sold. The perpetual system continuously provides current information for financial
statement preparation and for inventory and cost control. Because the costs of
maintaining a perpetual system have diminished significantly as computerized pro-
duction, bar coding, and information processing have become more pervasive, this
text assumes that all companies discussed use a perpetual system.
The Midwestern Polyethylene Products Corporation is used to illustrate the flow
of product costs in a manufacturing organization. The April 1, 2001, inventory ac-
count balances for Midwestern were as follows: Raw Material Inventory (all direct),
$73,000; Work in Process Inventory, $145,000; and Finished Goods Inventory,
$87,400. Midwestern uses separate variable and fixed accounts to record the in-
currence of overhead. In this illustration, actual overhead costs are used to apply
overhead to Work in Process Inventory. However, an additional, brief illustration
applying predetermined overhead in a normal cost system is presented in the
section following the current illustration. The following transactions keyed to the
journal entries in Exhibit 3–10 represent Midwestern’s activity for April.
During the month, Midwestern’s purchasing agent bought $280,000 of direct
materials on account (entry 1), and the warehouse manager transferred $284,000
of materials into the production area (entry 2). Production wages for the month
totaled $530,000, of which $436,000 was for direct labor (entry 3). April salaries
for the production supervisor was $20,000 (entry 4). April utility cost of $28,000
was accrued; analyzing this cost indicated that $16,000 was variable and $12,000
was fixed (entry 5). Supplies costing $5,200 were removed from inventory and
placed into the production process (entry 6). Also, Midwestern paid $7,000 for
April’s property taxes on the factory (entry 7), depreciated the factory assets $56,880
(entry 8), and recorded the expiration of $3,000 of prepaid insurance on the fac-
tory assets (entry 9). Entry 10 shows the application of actual overhead to Work
in Process Inventory for, respectively, variable and fixed overhead for Midwestern
during April. During April, $1,058,200 of goods were completed and transferred to
Chapter 3 Organizational Cost Flows
101
(1) Raw Materials Inventory 280,000
Accounts Payable 280,000
To record cost of direct materials purchased on account.
(2) Work in Process Inventory 284,000
Raw Materials Inventory 284,000
To record direct materials transferred to production.
(3) Work in Process Inventory 436,000
Variable Overhead Control 94,000
Salaries & Wages Payable 530,000
To accrue factory wages for direct and indirect labor.
(4) Fixed Overhead Control 20,000
Salaries & Wages Payable 20,000
To accrue production supervisors salaries.
(5) Variable Overhead Control 16,000
Fixed Overhead Control 12,000
Utilities Payable 28,000
To record mixed utility cost in its variable and fixed amounts.
(6) Variable Overhead Control 5,200
Supplies Inventory 5,200
To record supplies used.
(7) Fixed Overhead Control 7,000
Cash 7,000
To record payment for factory property taxes for the period.
(8) Fixed Overhead Control 56,880
Accumulated Depreciation—Equipment 56,880
To record depreciation on factory assets for the period.
(9) Fixed Overhead Control 3,000
Prepaid Insurance 3,000
To record expiration of prepaid insurance on factory assets.
(10) Work in Process Inventory 214,080
Variable Overhead Control 115,200
Fixed Overhead Control 98,880
To record the application of actual overhead costs to
Work in Process Inventory.
(11) Finished Goods Inventory 1,058,200
Work in Process Inventory 1,058,200
To record the transfer of work completed during the period.
(12) Accounts Receivable 1,460,000
Sales 1,460,000
To record the selling price of goods sold on account during
the period.
(13) Cost of Goods Sold 1,054,000
Finished Goods Inventory 1,054,000
To record cost of goods sold for the period.
EXHIBIT 3–10
Midwestern Polyethylene
Products Corporation—
April 2001 Journal Entries
Finished Goods Inventory (entry 11). Sales of $1,460,000 on account were recorded
during the month (entry 12); the goods that were sold had a total cost of $1,054,000
(entry 13). An abbreviated presentation of the cost flows is shown in selected
T-accounts in Exhibit 3–11.
Part 2 Systems and Methods of Product Costing
102
EXHIBIT 3–11
Selected T-Accounts for
Midwestern Polyethylene
Products Corporation
Raw Materials Inventory
Beg. bal. 73,000 (2) 284,000
(1) 280,000
End. bal. 69,000
Work in Process Inventory
Beg. bal. 145,000 (11) 1,058,200
(2) DM 284,000
(3) DL 436,000
(10) OH 214,080
End. bal. 20,880
Fixed Overhead Control
(4) 20,000 (10) 98,880
(5) 12,000
(7) 7,000
(8) 56,880
(9) 3,000
Finished Goods Inventory
Beg. bal. 87,400 (13) CGS 1,054,000
(11) CGM 1,058,200
End. bal. 91,600
Cost of Goods Sold
(13) CGS 1,054,000
Variable Overhead Control
(3) 94,000 (10) 115,200
(5) 16,000
(6) 5,200
COST OF GOODS MANUFACTURED AND SOLD
The T-accounts in Exhibit 3–11 provide detailed information about the cost of ma-
terials used, goods transferred from work in process, and goods sold. This infor-
mation is needed to prepare financial statements. Because most managers do not
have access to the detailed accounting records, they need to have the flow of costs
and the calculation of important income statement amounts presented in a for-
malized manner. Therefore, a schedule of cost of goods manufactured (CGM) is
prepared as a preliminary step to the determination of cost of goods sold (CGS).
15
CGM is the total production cost of the goods that were completed and transferred
to Finished Goods Inventory during the period. This amount is similar to the cost
of net purchases in the cost of goods sold schedule for a retailer.
Formal schedules of cost of goods manufactured and cost of goods sold are
presented in Exhibit 3–12 using the amounts shown in Exhibits 3–10 and 3–11.
The schedule of cost of goods manufactured starts with the beginning balance of
Work in Process (WIP) Inventory and details all product cost components. The cost
of materials used in production during the period is equal to the beginning bal-
ance of Raw Materials Inventory plus raw materials purchased minus the ending
balance of Raw Materials Inventory. If Raw Materials Inventory includes both di-
rect and indirect materials, the cost of direct material used is assigned to WIP In-
ventory and the cost of indirect materials used is included in variable overhead.
Because direct labor cannot be warehoused, all charges for direct labor during the
period are part of WIP Inventory. Variable and fixed overhead costs are added to
direct material and direct labor costs to determine total manufacturing costs.
Beginning Work in Process Inventory cost is added to total current period
manufacturing costs to obtain a subtotal amount that can be referred to as “total
costs to account for.” The value of ending WIP Inventory is calculated (through
techniques discussed later in the text) and subtracted from the subtotal to pro-
vide the cost of goods manufactured during the period. The schedule of cost of
How is cost of goods
manufactured calculated?
cost of goods manufactured
8
15
A service business prepares a schedule of cost of services rendered.
goods manufactured is usually prepared only as an internal schedule and is not
provided to external parties.
In the schedule of cost of goods sold, cost of goods manufactured is added
to the beginning balance of Finished Goods (FG) Inventory to find the cost of
goods available for sale during the period. The ending FG Inventory is calculated
by multiplying a physical unit count times a unit cost. If a perpetual inventory sys-
tem is used, the actual amount of ending FG Inventory can be compared to that
which should be on hand based on the finished goods account balance recorded
at the end of the period. Any differences can be attributed to losses that might
have arisen from theft, breakage, evaporation, or accounting errors. Ending Fin-
ished Goods Inventory is subtracted from the cost of goods available for sale to
determine cost of goods sold.
Chapter 3 Organizational Cost Flows
103
MIDWESTERN POLYETHYLENE PRODUCTS CORPORATION
Schedule of Cost of Goods Manufactured
For the Month Ended April 30, 2001
Beginning balance of Work in Process, 4/1/01 $ 145,000
Manufacturing costs for the period:
Raw materials (all direct):
Beginning balance $ 73,000
Purchases of materials 280,000
Raw materials available $353,000
Ending balance 69,000
Total raw materials used $284,000
Direct labor 436,000
Variable overhead:
Indirect labor $ 94,000
Utilities 16,000
Supplies 5,200 115,200
Fixed overhead:
Supervisor’s salary $ 20,000
Utilities 12,000
Factory property taxes 7,000
Factory asset depreciation 56,880
Factory insurance 3,000 98,880
Total current period manufacturing costs 934,080
Total costs to account for $1,079,080
Ending work in process, 4/30/01 (20,880)
Cost of goods manufactured $1,058,200
MIDWESTERN POLYETHYLENE PRODUCTS CORPORATION
Schedule of Cost of Goods Sold
For the Month Ended April 30, 2001
Beginning Finished Goods, 4/1/01 $ 87,400
Cost of Goods Manufactured 1,058,200
Cost of Goods Available for Sale $1,145,600
Ending Finished Goods, 4/30/01 (91,600)
Cost of Goods Sold $1,054,000
EXHIBIT 3–12
Cost of Goods Manufactured
and Cost of Goods Sold
Schedules
ACCUMULATION OF PRODUCT COSTS—NORMAL COST SYSTEM
In a normal cost system, only entry 10, which applies overhead to WIP Inventory,
is different from that presented in Exhibit 3–10. Assume, for the purpose of illus-
trating what happens using a normal cost system, that the predetermined variable
overhead rate is $2.40 per machine hour, that the predetermined fixed overhead
rate is $2.04 per machine hour and that 48,000 machine hours were incurred by
Midwestern in April. These statistics are used to exactly match the information in
the actual cost illustration above and for simplifying the illustration by precluding
the presence of under- or overapplied overhead for April at Midwestern.
However, predetermined overhead most often does not match actual overhead.
Monthly under- or overapplied overhead that does occur is accumulated and dis-
posed of at year-end in the manner described earlier in this chapter. In a normal
cost system, entry 10 of Exhibit 3–10 is the only entry that is different from its
counterpart in an actual cost system because, instead of applying actual overhead,
predetermined overhead is applied to WIP Inventory. Although the numbers appear
to be the same amounts in this simplified case as in the original entry 10, the man-
ner in which they are derived is entirely different (and in a realistic setting, the
dollar amounts are virtually always different). In a normal cost setting, the credits
to the variable and fixed overhead accounts are calculated as follows:
Variable overhead credit ϭ $2.40 ϫ 48,000 machine hours
ϭ $115,200
Fixed overhead credit ϭ $2.06 ϫ 48,000 machine hours
ϭ $ 98,880
The debit to WIP Inventory is the sum of these two credits:
WIP Inventory debit ϭ $115,200 ϩ $98,880 ϭ $214,080
The complete entry follows:
10) Work in Process Inventory 214,080
Variable Overhead Control 115,200
Fixed Overhead Control 98,880
To record the application of
predetermined
overhead
costs to WIP Inventory.
Some accountants prefer to streamline the presentation of the Schedule of Cost
of Goods Manufactured and Sold when perpetual inventory accounting is used.
Such an alternative is presented in Exhibit 3–13; in addition, the use of normal
costing supports condensing the overhead presentation further.
Part 2 Systems and Methods of Product Costing
104
MIDWESTERN POLYETHYLENE PRODUCTS CORPORATION
Schedule of Cost of Goods Manufactured
For the Month Ended April 30, 2001
Beginning balance of Work in Process, 4/1/01 $ 145,000
Manufacturing costs for the period:
Total raw materials used $284,000
Direct labor 436,000
Variable overhead applied 115,200
Fixed overhead applied 98,880
Total current period manufacturing costs 934,080
Total costs to account for $1,079,080
Ending Work in Process, 4/30/01 (20,880)
Cost of goods manufactured $1,058,200
(continued)
EXHIBIT 3–13
Cost of Goods Manufactured
and Cost of Goods Sold
Schedules
Chapter 3 Organizational Cost Flows
105
MIDWESTERN POLYETHYLENE PRODUCTS CORPORATION
Schedule of Cost of Goods Sold
For the Month Ended April 30, 2001
Beginning Finished Goods, 4/1/01 $ 87,400
Cost of Goods Manufactured 1,058,200
Cost of Goods Available for Sale $1,145,600
Ending Finished Goods, 4/30/01 (91,600)
Cost of Goods Sold $1,054,000
EXHIBIT 3–13
(Concluded)
Wisconsin
Film & Bag
REVISITING
isconsin Film & Bag has grown 500 percent
since Jack Riopelle, president and chief operat-
ing officer, helped purchase the firm in 1993. The work-
force has expanded from 43 employees in 1993 to 285
employees in 1999 currently. At that time WF&B annual
sales exceed $30 million.
WF&B’s vision statement is as follows:
Wisconsin Film & Bag will become the standard by
which our competitors measure themselves. We in-
tend to be known as the company people want to
work for, buy from and sell to. This will be accom-
plished by achieving the following:
1. We will maintain a consistent attitude toward em-
ployee involvement and incorporate unconditional
integrity in all interactions with customers, suppli-
ers, employees, shareholders and the community.
2. We are committed to sustained, profitable growth
with a dedication toward excellence in quality,
service and creativity. We will also commit human
and capital resources to improve our quality,
control costs, and expand our capabilities to meet
our customers’ needs.
3. We will strive for preferred vendor status from each
of our customers and universal respect from all
our competitors.
4. We will become an industry leader by making
environmentally conscious decisions in every-
thing we do.
There is much evidence that the firm is progressing
toward this vision. Not only has the firm grown at a fast
pace, but it has also tried to be a good environmental
neighbor and a good citizen.
The firm’s first repelletizer, which repelletizes produc-
tion scrap and purchased film scrap, was installed in May
1995. This has allowed the firm to reuse its own internally
generated scrap and to use purchased scrap from outside
sources, saving over $100,000 annually in raw material
cost for production of “non-food-grade” products.
When WF&B recently opened its Hartland, Wisconsin
facility, it had trouble staffing manufacturing operations
because Western Waukesha County is a white-collar com-
munity. So the firm tapped into the area’s long-term unem-
ployed, providing assistance in locating competent day
care, reliable transportation, and training in life skills such
as reading a ruler, using a calculator, looking someone in
the eyes while talking, and budgeting paychecks. New
employees receive company T-shirts so they’re dressed
the same as the old-timers. WF&B assigns a 24-hour “Re-
tention Specialist” to each new hire to help resolve per-
sonal issues.
In 1999, WF&B received two awards: “Employer of
the Year” from the Private Industry Council of Waukesha-
Ozaukee-Washington counties and one of the 15 “Exem-
plary Employers” in the State of Wisconsin at the Sixth
Annual Governor’s Employment and Training Conference.
W
SOURCE
: Corporate Headquarters—Wisconsin Film & Bag, 3100 E. Richmond Street, Shawano, WI 54166.
Part 2 Systems and Methods of Product Costing
106
This chapter presents a variety of definitions and classifications of cost.
Historical, replacement, and budgeted costs are typically associated with time.
Historical costs are used for external financial statements; replacement and bud-
geted costs are more often used by managers in conducting their planning, con-
trolling, and decision-making functions.
Variable, fixed, mixed, and step costs describe cost behavior within the con-
text of a relevant range. Total variable cost varies directly and proportionately with
changes in activity; variable costs are constant on a per-unit basis. Costs that re-
main constant in total, regardless of changes in activity, are fixed. On a per-unit
basis, fixed costs vary inversely with activity changes. Mixed costs contain both a
variable and fixed component and are usually separated (using the high-low method
or least squares regression analysis) into these components for product costing and
management’s uses. Step costs can be variable or fixed, depending on the size of
the “step” change (small or large, respectively) that occurs relative to the change
in activity. Accountants select a relevant range that allows step variable costs to be
treated as variable and step fixed costs to be treated as fixed.
For financial statements, costs are either considered unexpired and reported
on the balance sheet as assets, or expired and reported on the income statement
as expenses or losses. Costs may also be viewed as product or period costs. Prod-
uct costs are inventoried and include direct material, direct labor, and manufac-
turing overhead. When the products are sold, these costs expire and become cost
of goods sold expense. Period costs are incurred outside the production area and
are usually associated with the functions of selling, administrating, and financing.
Costs are also said to be direct or indirect relative to a cost object. The mate-
rial and labor costs of production that are physically and conveniently traceable to
products are direct costs. All other costs incurred in the production area are indi-
rect and are referred to as manufacturing overhead.
The extensive activity required to convert raw materials into finished goods
distinguishes manufacturers and service companies from retailers. This conversion
process necessitates that all factory costs be accumulated and reported as product
costs under accrual accounting.
A predetermined overhead rate is calculated by dividing the upcoming period’s
budgeted overhead costs by a selected level of activity. (Budgeted overhead costs
at various levels of activity are shown on a flexible budget, which is discussed in
Chapter 10 on standard costing.) Predetermined overhead rates eliminate the prob-
lems caused by delays in obtaining actual cost data, make the overhead allocation
process more effective, and allocate a uniform amount of overhead to goods or
services based on related production efforts.
The activity base chosen to compute a predetermined overhead rate should
be logically related to cost changes and be a direct causal factor of that cost (a
cost driver) rather than simply a predictor. Units of output are a valid measure
only if the company produces a single product.
When a company uses a predetermined overhead rate, underapplied or over-
applied overhead results at the end of the year. This amount (if insignificant) should
be closed to Cost of Goods Sold or (if significant) allocated among Work in Process
Inventory, Finished Goods Inventory, and Cost of Goods Sold.
An internal management report, known as the cost of goods manufactured
schedule, traces the flow of costs into the production area and through conversion
into finished goods. This report provides the necessary information to prepare the
cost of goods sold section of a manufacturer’s income statement.
CHAPTER SUMMARY
Chapter 3 Organizational Cost Flows
107
Plantwide versus Departmental Overhead Application Rates
The Indianapolis Division of Alexander Polymers International is used to illustrate
the calculation of a single, plantwide overhead application rate. This division con-
tains two departments (Cutting and Mounting, and Packaging). At the end of 2000,
division management budgets its 2001 activity level at 75,000 machine hours and
manufacturing overhead costs at $399,750. If a plantwide predetermined overhead
application rate is calculated on per machine hour:
Plantwide OH Rate ϭ
ϭ
ϭ $5.33
Although a single plantwide overhead rate can be computed, such a process
is frequently not adequate. In most companies, work is performed differently in
different departments or organizational units. For example, although machine hours
may be an appropriate activity base in a highly automated department, direct labor
hours (DLHs) may be better for assigning overhead in a labor-intensive department.
In the quality control area, number of defects may provide the best allocation base.
Thus, because homogeneity is more likely within a department than among depart-
ments, separate departmental rates are generally thought to provide managers more
useful information than plantwide rates.
Exhibit 3–14 presents the calculations of separate departmental and plantwide
overhead rates for the Indianapolis Division of Alexander Polymers International.
The Cutting and Mounting Department is highly automated and, therefore, uses
machine hours as its overhead cost driver. In contrast, the Packaging Department
is more labor intensive and uses DLHs.
Least Squares Regression Analysis
Least squares regression analysis is a statistical technique that analyzes the re-
lationship between dependent and independent variables. Least squares is used to
develop an equation that predicts an unknown value of a dependent variable
$399,750
ᎏᎏ
75,000 MH
Total Budgeted OH Cost at a Specific Activity Level
ᎏᎏᎏᎏᎏᎏ
Volume of Specified Activity Level
APPENDIX
Cutting and Mounting Packaging
Budgeted annual overhead $240,100 $159,650
Budgeted annual direct labor hours (DLHs) 5,400 20,600
Budgeted annual machine hours (MHs) 70,000 5,000
Departmental overhead rates:
Cutting and Mounting (automated): $240,100 Ϭ 70,000 MHs ϭ $3.43 per MH
Packaging (manual): $159,650 Ϭ 20,600 DLHs ϭ $7.75 per DLH
Total plantwide overhead ϭ $240,100 ϩ $159,650 ϭ $399,750
Plantwide overhead rate (using DLHs): $399,750 Ϭ 26,000 DLHs ϭ $15.375 per DLH
Plantwide overhead rate (using MHs): $399,750 Ϭ 75,000 MHs ϭ $5.33 per MH
EXHIBIT 3–14
Departmental versus Plantwide
Overhead Rates
least squares regression
analysis
dependent variable
(cost) from the known values of one or more independent variables (activity).
When multiple independent variables exist, least squares regression also helps to
select the independent variable that is the best predictor of the dependent vari-
able. For example, managers can use least squares to decide whether machine
hours, direct labor hours, or pounds of material moved best explain and predict
changes in a specific overhead cost.
16
Simple regression analysis uses one independent variable to predict the de-
pendent variable. Simple linear regression uses the y ϭ a ϩ bX formula for a
straight line. In multiple regression, two or more independent variables are used
to predict the dependent variable. All examples in this appendix use simple re-
gression and assume that a linear relationship exists between variables so that each
one-unit change in the independent variable produces a constant unit change in
the dependent variable.
17
The least squares method mathematically fits the best possible regression line
to observed data points. A regression line is any line that goes through the means
(or averages) of the independent and dependent variables in a set of observations.
Numerous straight lines can be drawn through any set of data observations, but
most of these lines would provide a poor fit. Least squares regression analysis finds
the line of “best fit” for the observed data.
This line of best fit is found by predicting the a and b values in a straight-line
formula using the actual activity and cost values (y values) from the observations.
The equations necessary to compute b and a values using the method of least
squares are as follows
18
:
b ϭ
a ϭ y
ෆ
Ϫ bx
ෆ
where
x
ෆ
ϭ mean of the independent variable
y
ෆ
ϭ mean of the dependent variable
n ϭ number of observations
Using the Cutting and Mounting Department data for the Indianapolis Division
of Alexander Polymers International (presented in the chapter in Exhibit 3–7 and
excluding the March outlier), the following calculations can be made:
x y xy x
2
4,800 $ 192 $ 921,600 23,040,000
9,000 350 3,150,000 81,000,000
4,900 186 911,400 24,010,000
4,600 218 1,002,800 21,160,000
8,900 347 3,088,300 79,210,000
5,900 248 1,463,200 34,810,000
5,500 231 1,270,500 30,250,000
43,600 $1,772 $11,807,800 293,480,000
Α
xy Ϫ n (x
ෆ
)(y
ෆ
)
ᎏᎏ
Α
x
2
Ϫ n(x
ෆ
)
2
Part 2 Systems and Methods of Product Costing
108
16
Further discussion of finding independent variable(s) that best predict the value of the dependent variable can be found in
most textbooks on statistical methods treating regression analysis under the headings of dispersion, coefficient of correlation,
coefficient of determination, or standard error of the estimate.
17
Curvilinear relationships between variables also exist. For example, quality defects (dependent variable) tend to increase at
an increasing rate in relationship to machinery age (independent variable).
18
These equations are derived from mathematical computations beyond the scope of this text, but which are found in many
statistics books. The symbol Α means “the summation of.”
independent variable
simple regression
multiple regression
regression line
The mean of x (x
ෆ
) is 6,228.57 (43,600 Ϭ 7) and the mean of y (y
ෆ
) is $253.14
($1,772 Ϭ 7). Thus,
b ϭ
ϭ
ϭ $0.035
a ϭ $253.14 Ϫ $0.035 (6,228.57)
ϭ $35.14
Thus, the b (variable cost) and a (fixed cost) values for the department’s utility
costs are $0.035 and $35.14, respectively.
By using these values, predicted costs (y
c
values) can be computed for each
actual activity level. The line that is drawn through all of the y
c
values will be the
line of best fit for the data. Because actual costs do not generally fall directly on
the regression line and predicted costs naturally do, there are differences between
these two costs at their related activity levels. It is acceptable for the regression
line not to pass through any or all of the actual observation points because the
line has been determined to mathematically “fit” the data.
$770,898.53
ᎏᎏ
21,914,410.29
11,807,800 Ϫ 7(6,228.57)($253.14)
ᎏᎏᎏᎏ
293,480,000 Ϫ 7(6,228.57)(6,228.57)
Chapter 3 Organizational Cost Flows
109
actual cost system (p. 95)
applied overhead (p. 97)
capacity (p. 99)
conversion cost (p. 78)
cost (p. 77)
cost allocation (p. 95)
cost driver (p. 87)
cost object (p. 90)
cost of goods manufactured (p. 102)
dependent variable (p. 107)
direct cost (p. 89)
direct labor (p. 78)
direct material (p. 78)
distribution cost (p. 78)
expected capacity (p. 100)
expired cost (p. 77)
fixed cost (p. 85)
high-low method (p. 88)
historical cost (p. 98)
independent variable (p. 108)
indirect cost (p. 90)
inventoriable cost (p. 78)
least squares regression analysis (p. 107)
manufacturer (p. 79)
mixed cost (p. 86)
multiple regression (p. 108)
normal capacity (p. 100)
normal cost system (p. 96)
outlier (p. 88)
overapplied overhead (p. 98)
overhead (p. 78)
period cost (p. 78)
practical capacity (p. 100)
predetermined overhead rate (p. 96)
predictor (p. 87)
product cost (p. 78)
regression line (p. 108)
relevant range (p. 84)
service company (p. 79)
simple regression (p. 108)
step cost (p. 86)
theoretical capacity (p. 99)
underapplied overhead (p. 98)
unexpired cost (p. 77)
variable cost (p. 84)
KEY TERMS
Part 2 Systems and Methods of Product Costing
110
Predetermined Overhead Rate
Predetermined OH Rate ϭ
(Can be separate variable and fixed rates or a combined rate)
High-Low Method
(Using assumed amounts)
(Independent (Dependent Variable) Total Total
Variable) Associated Variable Cost Fixed
Activity Total Cost ؊ (Rate ؋ Activity) ؍ Cost
“High” level 14,000 $18,000 Ϫ $11,200 ϭ $6,800
“Low” level 9,000 14,000 Ϫ 7,200 ϭ 6,800
Differences 5,000 $ 4,000
$0.80 variable cost per unit of activity
Least Squares Regression Analysis
The equations necessary to compute b and a values using the method of least
squares are as follows:
b ϭ
a ϭ y
ෆ
Ϫ bx
ෆ
where
x
ෆ
ϭ mean of the independent variable
y
ෆ
ϭ mean of the dependent variable
n ϭ number of observations
Underapplied and Overapplied Overhead
Overhead Control XXX
Various accounts XXX
Actual overhead is debited to the
overhead general ledger account.
Work in Process Inventory YYY
Overhead Control YYY
Applied overhead is debited to WIP and
credited to the overhead general ledger account.
A debit balance in Manufacturing Overhead at the end of the period is underap-
plied overhead; a credit balance is overapplied overhead. The debit or credit bal-
ance in the overhead account is closed at the end of the period to CGS or pro-
rated to WIP, FG, and CGS.
Α
xy Ϫ n (x
ෆ
)(y
ෆ
)
ᎏᎏ
Α
x
2
Ϫ n(x
ෆ
)
2
Total Budgeted Overhead Cost
ᎏᎏᎏᎏᎏ
Total Budgeted Level of Volume or Activity
SOLUTION STRATEGIES
Chapter 3 Organizational Cost Flows
111
Raw (Direct) Materials Inventory
Purchases Issuances
Wages Payable
Wages owed
Manufacturing Overhead
Supplies used
Indirect labor
Electricity cost
Depreciation
expense
Rent expense
Assigned to
Work in
Process
Work in Process Inventory
Direct materials
Direct labor
Overhead
Cost of goods
completed
Finished Goods Inventory
Cost of goods
completed
Cost of goods
sold
Cost of Goods Sold
Cost of goods
sold
Direct Labor
Work in
Process
Inventory
Finished
Goods
Inventory
Cost of
Goods
Sold
FLOW OF COSTS
Direct Materials
Manufacturing Overhead
Cost of Goods Manufactured
Beginning balance of Work in Process Inventory $XXX
Manufacturing costs for the period:
Raw materials (all direct):
Beginning balance $XXX
Purchases of materials XXX
Raw materials available for use $XXX
Ending balance (XXX)
Direct materials used $XXX
Direct labor XXX
Variable overhead XXX
Fixed overhead XXX
Total current period manufacturing costs XXX
Total costs to account for $XXX
Ending balance of Work in Process Inventory (XXX)
Cost of goods manufactured $XXX
Cost of Goods Sold
Beginning balance of Finished Goods Inventory $XXX
Cost of goods manufactured XXX
Cost of goods available for sale $XXX
Ending balance of Finished Goods Inventory (XXX)
Cost of goods sold $XXX
Part 2 Systems and Methods of Product Costing
112
BagsSoStrong Company had the following account balances as of August 1, 2001:
Raw Materials (direct and indirect) Inventory $ 9,300
Work in Process Inventory 14,000
Finished Goods Inventory 18,000
During August, the company incurred the following factory costs:
• Purchased $82,000 of raw materials on account.
• Issued $90,000 of raw materials, of which $67,000 were direct to the product.
• Factory payroll of $44,000 was accrued; $31,000 was for direct labor and the
rest was for supervisors.
• Utility costs were accrued at $3,500; of these costs, $800 were fixed.
• Property taxes on the factory were accrued in the amount of $1,000.
• Prepaid insurance of $800 on factory equipment expired in August.
• Straight-line depreciation on factory equipment was $20,000.
• Predetermined overhead of $62,500 ($28,000 variable and $34,500 fixed) was
applied to Work in Process Inventory.
• Goods costing $170,000 were transferred to Finished Goods Inventory.
• Sales on account totaled $350,000.
• Cost of goods sold was $175,000.
• Selling and administrative costs were $140,000 (credit “Various Accounts”).
• Ending Work in Process Inventory is $3,300.
Required:
a. Journalize the transactions for August.
b. Prepare a schedule of cost of goods manufactured for August using normal
costing.
c. Prepare an income statement, including a detailed schedule of cost of goods
sold.
Solution to Demonstration Problem
a.
(1) Raw Materials Inventory 82,000
Accounts Payable 82,000
(2) Work in Process Inventory 67,000
Variable Overhead Control 23,000
Raw Materials Inventory 90,000
(3) Work in Process Inventory 31,000
Fixed Overhead Control 13,000
Salaries and Wages Payable 44,000
(4) Variable Overhead Control 2,700
Fixed Overhead Control 800
Utilities Payable 3,500
DEMONSTRATION PROBLEM
(5) Fixed Overhead Control 1,000
Property Taxes Payable 1,000
(6) Fixed Overhead Control 800
Prepaid Insurance 800
(7) Fixed Overhead Control 20,000
Accumulated Depreciation—Factory Equipment 20,000
(8) Work in Process Inventory 62,500
Variable Overhead Control 28,000
Fixed Overhead Control 34,500
(9) Finished Goods Inventory 171,200
Work in Process Inventory 171,200
(10) Accounts Receivable 350,000
Sales 350,000
(11) Cost of Goods Sold 175,000
Finished Goods Inventory 175,000
(12) Selling & Administrative Expenses 140,000
Various Accounts 140,000
b.
BAGSSOSTRONG
Cost of Goods Manufactured Schedule
For Month Ended August 31, 2001
Balance of Work in Process Inventory, 8/1/01 $ 14,000
Manufacturing costs for the period:
Raw materials:
Beginning balance $ 9,300
Purchases of materials 82,000
Raw materials available $91,300
Indirect materials used $23,000
Ending balance 1,300 (24,300)
Total direct materials used $67,000
Direct labor 31,000
Variable overhead 28,000
Fixed overhead 34,500
Total current period manufacturing costs 160,500
Total costs to account for $174,500
Balance of Work in Process Inventory, 8/31/01 (3,300)
Cost of goods manufactured* $171,200
*During August, factory overhead was overapplied by $1,200. Underapplied or overapplied overhead
is accumulated throughout the year and disposed of at year end.
c.
BAGSSOSTRONG
Income Statement
For the Month Ended August 31, 2001
Sales $350,000
Cost of Goods Sold
Finished Goods, 8/1/01 $ 18,000
Cost of Goods Manufactured 171,200
Cost of Goods Available $189,200
Finished Goods, 8/31/01 (13,000)
Cost of Goods Sold (176,200)
Gross Margin $173,800
Selling & Administrative Expenses (140,000)
Income from Operations $ 33,800
Chapter 3 Organizational Cost Flows
113
Part 2 Systems and Methods of Product Costing
114
1. Distinguish among the cost accounting uses of historical costs, replacement
costs, and budgeted costs.
2. How does a company determine its relevant range of activity? Of what use to
managers is the concept of a relevant range of activity?
3. Why is a cost referred to as variable if it remains constant per unit for all vol-
ume levels within the relevant range?
4. Would it be true that fixed costs will never change in an organization? Explain
the rationale for your answer.
5. What is the difference between a variable and a mixed cost, given that each
changes in total with changes in activity levels?
6. How do predictors and cost drivers differ? Why is such a distinction important?
7. The high-low method of analyzing mixed costs uses only two observation
points: the high and the low points of activity. Are these always the best points
for prediction purposes? Why or why not?
8. Relative to a set of data observations, what is an outlier? Why is it inappro-
priate to use outliers to determine the cost formula for a mixed cost?
9. What is a product cost? What types of costs are included in product costs for
retailers, manufacturers, and service companies?
10. What is a period cost? What types of costs are included in period costs for
retailers, manufacturers, and service companies?
11. Are all product costs unexpired costs and all period costs expired costs? Explain.
12. How is the concept of a direct cost related to that of a cost object?
13. Why are some material and labor costs that should, in theory, be considered
direct costs instead accounted for as indirect costs?
14. What is the process of conversion and why does this process create a need
for cost accounting?
15. What inventory accounts are shown on the balance sheet of a manufacturer
and what information is contained in each of these accounts?
16. Is allocation of manufacturing overhead to products necessary for external re-
porting purposes? Internal purposes? Provide explanations for your answers.
17. Compare and contrast a normal cost system and an actual cost system. Rela-
tive to an actual cost system, what are the advantages associated with the use
of a normal cost system? What are the disadvantages?
18. Discuss the reasons a company would use a predetermined overhead rate rather
than apply actual overhead to products or services.
19. When a normal cost system is used, how are costs removed from a single
Manufacturing Overhead account and charged to Work in Process Inventory?
20. What recordkeeping options are available to account for overhead costs in a
normal cost system? Which would be easiest? Which would provide the best
information and why?
21. If overhead was materially underapplied for a year, how would it be treated
at year-end? Why is this treatment appropriate?
22. What factors can cause overhead to be underapplied or overapplied? Are all
of these factors controllable by management? Why or why not?
23. Why can it be said that the cost of goods manufactured schedule shows the
flow of production costs in a manufacturing company?
24. Why is the amount of cost of goods manufactured different from the amount
of cost of goods sold? Could there be a situation in which these amounts are
equal? If so, explain.
25. (Appendix) Why are departmental overhead rates more useful for managerial
decision making than plantwide rates? Separate variable and fixed rates rather
than total rates?
QUESTIONS
26. (Appendix) Why would regression analysis provide a more accurate cost for-
mula for a mixed cost than the high-low method?
27. Using the Internet, find an article about costs. List and define as many differ-
ent types of costs from the article as you can.
Chapter 3 Organizational Cost Flows
115
28. (Terminology) Match the following lettered terms on the left with the appro-
priate numbered description on the right.
a. Budgeted cost 1. An expense or loss
b. Direct cost 2. A cost that remains constant on a
c. Distribution cost per-unit basis
d. Expired cost 3. A cost associated with a specific cost
e. Fixed cost object
f. Inventoriable cost 4. Direct material, direct labor, and
g. Period cost manufacturing overhead
h. Product cost 5. Product cost
i. Variable cost 6. A cost that varies inversely on a
per-unit basis with changes in activity
7. A cost primarily associated with the
passage of time rather than
production activity
8. An expected future cost
9. A cost of transporting a product
29. (Cost classifications) Indicate whether each item listed below is a variable (V),
fixed (F), or mixed (M) cost and whether it is a product or service (PT) cost
or a period (PD) cost. If some items have alternative answers, indicate the al-
ternatives and the reasons for them.
a. Wages of forklift operators who move finished goods from a central ware-
house to the loading dock.
b. Paper towels used in factory restrooms.
c. Insurance premiums paid on the headquarters of a manufacturing company.
d. Columnar paper used in an accounting firm.
e. Cost of labels attached to shirts made by a company.
f. Wages of factory maintenance workers.
g. Property taxes on a manufacturing plant.
h. Salaries of secretaries in a law firm.
i. Freight costs of acquiring raw materials from suppliers.
j. Cost of wax to make candles.
k. Cost of radioactive material used to generate power in a nuclear power plant.
30. (Company type) Indicate whether each of the following terms is associated with
a manufacturing (Mfg.), a retailing or merchandising (Mer.), or a service (Ser.)
company. There can be more than one correct answer for each term.
a. Prepaid rent
b. Merchandise inventory
c. Cost of goods sold
d. Sales salaries expense
e. Finished goods inventory
f. Depreciation—factory equipment
g. Cost of services rendered
h. Auditing fees expense
i. Direct labor wages
EXERCISES
31. (Degrees of conversion) Indicate whether each of the following types of orga-
nizations is characterized by a high, low, or moderate degree of conversion.
a. Bakery in a grocery store
b. Convenience store
c. Christmas tree farm
d. Textbook publisher
e. Sporting goods retailer
f. Auto manufacturer
g. Cranberry farm
h. Custom print shop
i. Italian restaurant
j. Concert ticket seller
32. (Cost behavior) O’Malley Company produces baseball caps. The company in-
curred the following costs to produce 2,000 caps last month:
Cardboard for the bills $ 1,200
Cloth materials 2,000
Plastic for headband straps 1,500
Straight-line depreciation 1,800
Supervisors’ salaries 4,800
Utilities 900
Total $12,200
a. What did each cap component cost on a per-unit basis?
b. What is the probable type of behavior that each of the costs exhibits?
c. The company expects to produce 2,500 caps this month. Would you expect
each type of cost to increase or decrease? Why? Why can’t the total cost of
2,500 caps be determined?
33. (Cost behavior) The Hudson Company manufactures high-pressure garden
hoses. Costs incurred in the production process include a rubber material used
to make the hoses, steel mesh used in the hoses, depreciation on the factory
building, and utilities to run production machinery. Graph the most likely cost
behavior for each of these costs and show what type of cost behavior is in-
dicated by each cost.
34. (Total cost determination with mixed cost) Heathcliff Accounting Services pays
$400 per month for a tax software license. In addition, variable charges average
$15 for every tax return the firm prepares.
a. Determine the total cost and the cost per unit if the firm expects to prepare
the following number of tax returns in March 2000:
1. 150
2. 300
3. 600
b. Why does the cost per unit change in each of the three cases above?
35. (High-low method) Information about Brightman Corporation’s utility cost for
the first six months of 2001 follows. The company’s cost accountant wants to
use the high-low method to develop a cost formula to predict future charges
and believes that the number of machine hours is an appropriate cost driver.
Machine Utility
Month Hours Expense
January 68,000 $1,220
February 62,000 1,172
March 66,300 1,014
April 64,000 1,195
May 67,500 1,300
June 62,500 1,150
Part 2 Systems and Methods of Product Costing
116