Currency Strategy A Practitioner s Guide To Currency Investing Hedging And Forecasting Wiley_8 docx
Bạn đang xem bản rút gọn của tài liệu. Xem và tải ngay bản đầy đủ của tài liệu tại đây (196.01 KB, 19 trang )
200 Currency Strategy
both different from each other. Consequently, the way they should be managed should also be
different.
Having decided to manage a portfolio’s currency risk, one then has to decide whether the
aim is to achieve total returns or relative returns.
10.10.1 Absolute Returns: Risk Reduction
Just as a corporation has to decide whether to run their Treasury operation as a profit or as
a loss reducing centre, so a portfolio manager has to make the same choice in the approach
they take to managing currency risk. If a portfolio manager is focused on maximizing absolute
returns, the emphasis in managing their currency risk is likely to be on risk reduction.In
order to achieve this, they will most likely adopt a strategy of passive currency management.
This involves adopting and sticking religiously to a currency hedging strategy, rolling those
hedges during the lifetime of the underlying investment. The two obvious ways of establishing
a passive hedging strategy are:
r
Three-month forward (rolled continuously)
r
Three-month at-the-money forward call (rolled continuously)
The advantage of passive currency management is that it reduces or eliminates the currency risk
(depending on whether the benchmark is fully or partially hedged). The disadvantage is that it
does not incorporate any flexibility and therefore cannotrespondto changes in market dynamics
and conditions. The emphasis on risk reduction within a passive currency management style
deals with the basic idea that the portfolio’s return in the base currency is equal to:
The return of foreign assets invested in + the return of the foreign currency
This is a simple, but hopefully effective way of expressing the view that there are two separate
and distinct risks present within the decision to invest outside of the base currency. The motive
of risk reduction is therefore to hedge to whatever extent decided upon the return of the foreign
currency.
10.10.2 Selecting the Currency Hedging Benchmark
The most disciplined way of managing currency risk from a hedging perspective is to use a
currency hedging benchmark. There are four main ones:
r
100% hedged benchmark
r
100% unhedged benchmark
r
Partially hedged benchmark
r
Option hedged benchmark
Being 100% hedged is usually not the optimal strategy, apart from in exceptional cases. Equally,
using a currency hedging benchmark of 100% unhedged would seem to defeat the object. Many
funds are not allowed to use options, thus in most cases the best hedging benchmark to use is
partially hedged.
10.10.3 Relative Returns: Adding Alpha
Portfolio or asset managers who are on the other hand looking to maximize relative returns com-
pared to an unhedged position will most likely adopt a strategy of active currency management
@Team-FLY
Applying the Framework 201
whether the emphasis is on adding alpha or relative return. Either the portfolio manager or a
professional currency overlay manager will “trade” the currency around a selected currency
hedging benchmark for the explicit purpose of adding alpha. In most cases, this alpha is mea-
sured against a 100% unhedged position, although it could theoretically be measured against
the return of the currency hedging benchmark. With active currency management, the emphasis
should be on flexibility, both in terms of the availability of financial instruments one can use
to add alpha and also in terms of the currency hedging benchmark itself. On the first of these,
an active currency manager should have access to a broad spectrum of currency instruments in
order to boost their chance of adding value. Similarly, their ability to add value is significantly
increased by the adoption of a 50% or symmetrical currency hedging benchmark rather than
by a 100% hedged or 100% unhedged benchmark.
10.10.4 Tracking Error
Just as corporations have to deal with “forecasting error” in terms of the deviation of forecast
exchange rates relative to the actual future rate, so investors have to deal with tracking error
within their portfolios, which is the return of the portfolio relative to the investment benchmark
index being used. A portfolio manager can significantly affect the tracking error of their
portfolio by the selection of the currency hedging benchmark. Empirically, it has been found
that a 50% or symmetrical currency hedging benchmark generates around 70% of the tracking
error of that generated by using a polar of 100% currency hedging benchmark. Put another
way, the tracking error of a polar currency hedging benchmark is around 1.41 times that of a
50% hedged benchmark. The advantage of a symmetrical or 50% currency hedged benchmark
for a portfolio manager is that it reduces tracking error and it also enables them to participate
in both bull and bear currency markets.
Two popular types of active currency management strategy are the differential forward strategy
and the trend-following strategy. Both of these strategies have consistently added alpha to a
portfolio if followed rigorously and interestingly have also proven to be risk reducing compared
to unhedged benchmarks. Thus, they also help to boost significantly the portfolio’s Sharpe ratio.
10.10.5 Differential Forward Strategy
Forward exchange rates are very poor predictors of future spot exchange rates, in contrast to
the theories of covered interest rate parity and unbiased forward parity. As a result, one can
take advantage of these apparent market “inefficiencies” by hedging the currency 100% when
the forward rate pays you to do it and hedging 0% when the forward rate is against you. The
differential forward strategy has generated consistently good results over a long time and over
a broad set of currency pairs.
10.10.6 Trend-Following Strategy
The idea behind this strategy is to go long the currency pair when the price is above a moving
average of a given length and to go short the currency pair when it is below. Currency managers
can choose different moving averages depending on their trading approach to the benchmark.
Lequeux and Acar (1998) showed that to be representative of the various durations followed
by investors, an equally weighted portfolio based on three moving averages of length 32, 61
and 117 days may be appropriate. If the spot exchange rate is above all three moving averages,
202 Currency Strategy
hedge the foreign currency exposure 100%. If above two out of the three, hedge one-third of
the position. In all other cases, leaves the position unhedged. Trend-following strategies have
shown consistent excess returns over sustained periods of time.
10.10.7 Optimization of the Carry Trade
As with corporations, institutional investors can use optimization techniques. With corpora-
tions, the aim is to achieve the cheapest hedge for the most risk hedged. In the case of the
investor, the aim here is to add alpha by improving on the simple carry trade. The idea behind
the carry trade itself is that, using a risk appetite indicator, the currency manager goes long a
basket of high carry currencies, when risk appetite readings are either strong or neutral, and
conversely goes short that basket of currencies when risk appetite readings go into negative
territory.
It is possible to fine tune or optimize this strategy to take account of the volatility and
correlation of currencies in addition to their yield differentials. This should produce better
returns than the simple carry trade strategy. The optimized carry trade hedges the currency
pairs according to the weights provided by the mean–variance optimization rather than simply
hedging the currency pairs exhibiting an attractive carry. The returns generated by the optimized
carry trade strategy are actually better than those generated by the differential forward strategy
on a risk-adjusted basis.
10.11 MANAGING CURRENCY RISK III — THE SPECULATOR
If the idea of currency hedging is controversial to some, then that of currency speculation is even
more so. Currency speculation — that is the trading of currencies with no underlying, attached
asset — makes up the vast majority of currency market flow. Given that the currency market
provides the liquidity for global trade and investment, it is therefore currency speculation
that is providing this liquidity. When looking at the issue of currency speculation, one should
immediately dispense with such descriptions of it being a “good” or a “bad” influence and
instead focus on what it provides. It is neither a benign nor a malign force. Rather, its sole
purpose is to make money. Furthermore, it does not act in a vacuum, but instead represents
the market’s response to perceived fundamental changes. Thus, it is a symptom rather than the
disease itself, which is usually bad economic policy.
Currency speculators are usually made up of one of three groups — interbank dealers, pro-
prietary dealers, or hedge or total return funds. However, at times, currency overlay managers
or corporate Treasurers can also be termed currency speculators if they take positions in the
currency markets which have no underlying attached asset.
10.12 CURRENCY STRATEGY FOR CURRENCY MARKET
PRACTITIONERS
Having gone through the main points that we have covered in this book so that they are clear, it
is now time to put them into practice. Currency market practitioners can use currency strategy
techniques for basically two activities:
r
Currency trading
r
Currency hedging
Applying the Framework 203
10.12.1 Currency Trading
This section includes currency speculators and active currency managers. Some corporate
Treasuries are run as a profit centre and thus this part will also be of interest to them. For the
purpose of dividing currency activity into trading and hedging, we assume the generalization
that corporate Treasury for the most part uses the currency market for hedging purposes. The
aim here is to show how a currency market practitioner can combine the strategy techniques
described in this book for the practical use of trading or investing in currencies. Given that I
focus primarily on the emerging market currencies, we will keep the focus to that sector of the
currency market, though clearly these strategy techniques can and should be used for currency
exposure generally. The example we use here is that of a recommendation I put out on January
10, 2002. The key point here is not just that the recommendation made or lost money, but also
how the strategy was arrived at. The aim is not to copy this specific recommendation, but to
be able to repeat the strategy method. Note that these types of currency strategies should be
attempted solely by professional and qualified institutional investors or corporations.
Example
On January 10, 2002, I released a strategy note, recommending clients to sell the US dollar
against the Turkish lira, via a one-month forward outright contract. For the past couple of
months, we had been taking a more positive and constructive view on the Turkish lira, in line
with the price action and more positive fundamental and technical developments. Thus, we
came to the conclusion that while the Turkish lira remained a volatile currency, it was trending
positively and was likely to continue to do so near term. Hence, we recommended clients to:
r
Sell USD–TRL one-month forward outright at 1.460 million
r
Spot reference: 1.395 million
r
Target: 1.350 million
r
Targeted return excluding carry: +3.2%
r
Stop: 1.460 million
From a fundamental perspective, we at the time took a constructive view on Turkey’s 2002 eco-
nomic outlook. While recognizing persistent risks to that outlook, the prospects for a virtuous
circle of investor confidence appeared to have improved significantly. To recap, the Turkish lira
had devalued and de-pegged in February of 2001 and since then had fallen substantially from
around 600,000 to the US dollar before the peg broke to a low of 1.65 million. That decline
in the lira’s value had severe consequences for the economy, triggering a dramatic spike in
inflation. Indeed, in the third quarter of 2001, currency weakness and rising inflation appeared
to have created a vicious circle, whereby each fed off the other.
The CEMC model tells us however that the low in a currency’s value after de-pegging and the
high in inflation are highly related, and that Phase II of the model is related to a liquidity-driven
rally in the value of the currency after inflation has peaked. By the end of 2001, inflation had
clearly peaked on a month-on-month basis and was close to peaking on a year-on-year basis
at just over 70%. Thus, from the perspective of the CEMC model, the signs were positive as
regards prospects for a continuation of the rally in the Turkish lira, which had begun somewhat
tentatively in November 2001. A further positive sign, also in line with Phase II of the CEMC
model, was a massive and positive swing in the current account balance, from a deficit of around
6% of GDP in 2000 to a surplus of around 1% in 2001. This was largely due to the collapse of
import demand in the wake of the pegged exchange rate’s collapse, just as the CEMC model
204 Currency Strategy
suggests. In January 2002, what we were witnessing was a classic liquidity-driven rally in
a currency which had hit its low after breaking its peg the previous year. This phenomenon
was far from unique to the Turkish lira. Exactly the same phenomenon was seen in the Asian
currencies after their crisis in 1997–1998, and to some extent also in the Russian rouble and
Brazilian real.
In addition to such economic considerations, favourable political considerations were also
an important factor, keeping Turkey financially well supported, particularly in the wake of the
successful passage of such important legislation as the tobacco and public procurement laws.
Strong official support for Turkey at the end of 2001 appeared to make 2002 financing and
rollovers look manageable. Finally, “dollarization” levels — that is the degree to which Turkish
deposit holders were changing out of lira and into US dollars — appeared to have peaked in
November 2001, after soaring initially in the wake of the lira’s devaluation in February 2001.
In our view, if the 1994 devaluation was any guide, this process of de-dollarization may
have been only in its early stages. Granted, any positive view on the Turkish lira still had
to be tempered with some degree of caution about the underlying risks. Any proliferation
of the anti-terrorism campaign to Iraq and/or renewed domestic political squabbling would
clearly have the potential to upset markets, as would any hint of delay in global recovery
prospects.
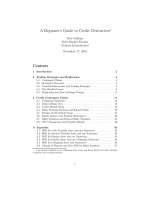
There was also the “technical” angle to consider. Despite the fact that the Turkish lira had
been a floating currency for only a relatively small period of time, the dollar–Turkish lira
exchange rate appeared to trade increasingly technically, in line with such technical indicators
as moving averages through September and October of 2001. Indeed, in November of 2001,
dollar–Turkish lira broke down through the 55-day moving average at 1.479 million for the
first time since the lira’s devaluation, and then formed a perfect head and shoulders pattern (see
Figure 10.1). The neckline of that head and shoulders pattern came in around 1.350 million,
which was why we put out target there. Such technical indicators as RSI and slow stochastics
were also pointing lower for dollar–Turkish lira.
In sum, both fundamentals, technicals and the CEMC model all seemed aligned at the
time for further Turkish lira outperformance. Looking at the dollar–Turkish lira exchange
rate through the signal grid, we would have come up with the results in Table 10.1. While
recommendations can be made on the basis of only one out of the four signals, they are clearly
more powerful — and more likely to be right — if all four signals are in line.
So what happened to our recommendation? To repeat, the aim here is not to focus overly
on the results of this specific recommendation, but rather on how a currency strategist puts a
recommendation together, using the currency strategy techniques we have discussed throughout
this book. This example is used only for the general purpose of showing how a recommendation
might be put together. As for this specific recommendation, the dollar–Turkish lira exchange
rate hit our initial target of 1.35 million spot, but we decided to keep it on. Subsequently, it
traded as low as 1.296 million, before trading back above 1.3 million. With a week left to go
Table 10.1 USD–TRL signal grid
Currency Flow Technical Long-term Combined
economics analysis analysis valuation signal
Buy/sell Sell Sell Sell Sell Sell
Applying the Framework 205
TRL=, Close(Bid) [Line][MA 55][MA 200] Daily
04Apr98 - 06Feb02
May98 Jul Sep Nov Jan99
Mar May Jul Sep Nov
Jan00 Mar May Jul Sep
Nov Jan01 Mar May Jul
Sep Nov Jan02
Pr
0.25M
0.3M
0.35M
0.4M
0.45M
0.5M
0.55M
0.6M
0.65M
0.7M
0.75M
0.8M
0.85M
0.9M
0.95M
1M
1.05M
1.1M
1.15M
1.2M
1.25M
1.3M
1.35M
1.4M
1.45M
1.5M
1.55M
1.6M
1.65M
TRL= , Close(Bid), Line
10Jan02 1385000
TRL= , Close(Bid), MA 55
10Jan02 1478764
TRL= , Close(Bid), MA 200
10Jan02 1368928
Figure 10.1 Dollar–Turkish lira: head and shoulders pattern
Source: Reuters.
@Team-FLY
206 Currency Strategy
before the forward contract matured, we decided to take profit on the recommendation for a
return, including carry, of +8.4%.
What is important to remember from this example is not that the recommendation made such
a return — I freely admit that I have put out recommendations that have lost money. Rather, the
important thing to remember is the discipline that was involved in putting the recommendation
together.
10.12.2 Currency Hedging
For its part, this section should be the focus of passive currency managers and corporations. Here
too, the discipline of how one puts together a currency strategy is the same, though the purpose
is different. The currency market practitioner has to form a currency view. That view can
come from the bank counterparties that the corporation or asset manager uses, but the currency
market practitioner should also have a currency view themselves, with which to compare
against such external views. The view itself is created from the signal grid, incorporating
currency economics, technicals, flow analysis and long-term valuation. The currency market
practitioner should be aware of all these aspects of the currency to which they are exposed.
Not being aware is the equivalent of not knowing the business you are in. In the example I
have chosen, we keep the focus on emerging market currencies, this time looking at the risk
posed by exposure to currency risk in the countries of Central and Eastern Europe.
Example
The Euro has flattered to deceive on many occasions. Countless times, currency strategists in
the US, the UK and Europe have forecast a major and sustained Euro rally, and for the most
part they have been wrong. This is not to say the Euro has not staged brief recoveries, notably
from its October 26, 2000 record low of 0.8228 against the US dollar, reaching at one point as
high as 0.9595. However, such recoveries have ultimately proved unsustainable, not least with
respect to both hopes and expectations.
This has been extremely important for UK, US and European corporations with factories
or operations in Central and Eastern Europe. The reasons for this are simple — just as the
Euro has been weak against the US dollar over the past two to three years, so it has also been
simultaneously weak against the currencies of Central and Eastern Europe. Indeed, there is a
close correlation between the two, not least because the Euro area receives around 70% of total
CEE exports. Equally, the Euro area is by some way the largest direct investor in CEE countries,
ahead of EU accession and ultimately adopting the Euro. The pull for convergence has been
irresistible. Substantial portfolio and direct investment inflows to CEE countries, combined
with broad Euro weakness, has meant that the Euro has weakened substantially against the
likes of the Czech koruna, Polish zloty, Slovak koruna and also the Hungarian forint, after
Hungary’s de-pegging in May 2001, in the period 2000–2002.
For corporations that invested in the CEE region, this has been excellent news. As the Euro
has weakened against CEE currencies, so the value of their investment has appreciated when
translated back into Euros. More specifically, consolidation of subsidiary balance sheets within
the group balance sheet has been favourable as the value of the Euro has declined.
This raises an obvious question — what happens if it goes up? As we saw when looking at
translation risk in Chapter 7, corporations face translation risk on the group balance sheet on
the net assets (gross assets − liabilities) of their foreign subsidiary. Usually, corporations do
Applying the Framework 207
not hedge translation risk given the cost, the potential for “regret” and the view that balance
sheet hedging to a certain extent negates the purpose of the original investment. However, as I
have tried to show, sustained exchange rate moves can have a significant impact on the balance
sheet if not hedged. Equally, the initial investment does not negate the need to manage the
balance sheet dynamically.
The threat in question is that of the Euro strengthening against CEE currencies. Readers
should note that once more that is a theoretical example and I do not mean to suggest that this
is in fact a threat. Rather, readers should be considering what they might have to do were it a
real threat. Consider then the possibility that the Euro might appreciate, perhaps significantly
against CEE currencies. For a corporation, this represents a balance sheet risk when translating
the value of foreign subsidiaries’ net assets back onto the group balance sheet. It might also
represent transaction and economic risk as well, in terms of the threat to dividend streams and
to the present value of future operating cash flows.
Thus, supposing there were a real threat of significant Euro appreciation against CEE cur-
rencies, that threat would according to our signal grid have to be quantified in terms of currency
economics, flows, technical analysis and long-term valuation. When — and only when — all
four are aligned in the form of a BUY signal should the corporation consider strategic hedging,
that is hedging more than just immediate receivables. For the purpose of this exercise, assume
that all four are indeed aligned. Our corporation therefore has to think seriously about hedging
the various types of currency risk associated with their investments in the CEE region.
How to go about hedging? Having first decided to carry out a hedge, using the combined
signal from a currency strategy signal grid, there are two further steps in this process. The first is
to quantify the specific type and amount of risk involved. For a corporation, this means whether
we are talking about transaction, translation or economic currency risk. The type of currency
risk may have a significant bearing on what type of currency hedging instruments will be used.
The second step in this process is to focus on the specific types of instruments involved. For
this purpose, I have provided a shortened version of the menu of possible structures available
in Chapter 7 (see Tables 10.2 and 10.3). The corporate Treasury should get its counterparty
bank to price up a menu of possible hedging strategies, which are in line with their currency
view, in order to be able to compare the costs and benefits of each strategy and arrive at the
cheapest hedging strategy for the most risk hedged.
The investor or asset manager will look at currency risk in a slightly different way, but for
that should still adopt the same degree of rigour in seeking to manage it. Passive currency
managers will presumably buy the same tenor of forward or option and continue to roll that
Table 10.2 Traditional hedging structures
Type Advantages Disadvantages
Unhedged Maintains possible yield on
underlying investment
Speculative, reflecting a view that
there is no or little FX risk
Vanilla EUR forward Covered against FX risk No flexibility, high cost if interest
rate differentials are large,
vulnerable to unfavourable FX
moves
Vanilla EUR call option Covered against FX risk, flexibility
(does not have to be exercised)
Premium cost
208 Currency Strategy
Table 10.3 Enhanced (option) hedging structures
Type Advantages Disadvantages
Seagull Partly covered against FX risk, can be
structured as zero cost
Not covered against a major FX move
Risk reversal Directional and vol play Cost of the RR given interest rate
differentials, though could be
structured to be zero cost
Convertible forward Converts to a forward at an agreed
rate during the tenor of the contract,
customer can take advantage of a
contrarian move in spot up to but
not including the KI
The strike is more expensive than the
forward and this has to be paid if
the structure is knocked-in
Enhanced forward If the currency stays within an agreed
range, the rate is significantly
improved relative to the vanilla
forward
If spot goes outside of the range, the
forward rate to be paid becomes
more expensive
position, though as the value of the underlying changes so they may have to adjust their hedges
in order to avoid slippage.
The line between currency trading and currency hedging blurs when it comes to active
currency managers who trade around a currency hedging benchmark. The difference between
the two clearly comes down to incentive, and also to whether one is targeting absolute or
relative returns. Active currency managers also hedge currency risk, either on a rigorous
basis relative to a currency hedging benchmark or on a purely discretionary basis. Within the
emerging markets, dedicated emerging market funds may have a currency overlay manager
who hedges/trades relative to a currency hedging benchmark. On the other hand, G7 funds
that allocate 2–3% of their portfolio to the emerging markets are unlikely to have a specific
currency hedging benchmark for such a small allocation, and are only likely to hedge currency
risk on a discretionary basis. The suggestion here is that both could do so more effectively and
more rigorously through the use of a signal grid and by comparing a menu of hedging structure
costs, assuming that their fund allows them to use more than just forwards.
10.13 SUMMARY
The aim of this chapter has been to bring together the core principles of currency strategy into
a coherent framework and then to apply them through practical examples to the real world
of the currency market practitioner. There are no doubt aspects of currency strategy that I
have missed out. For instance, I did not have a chapter specifically dedicated to the emerging
markets and how emerging market currency dynamics are specific and different from their
developed market counterparts. Rather than separate the book in that way, I did attempt to
outline the emerging market angle in each chapter as a more practical way of demonstrating
how the emerging markets are different in a number of important ways. Equally, some currency
strategists run their forecasts in the form of a model currency portfolio. For leveraged funds, this
is a particularly useful benchmark of performance. It would have been useful and interesting
to look at the trend in the currency market towards fewer currencies, and whether or not that
is a positive trend. Finally, it might have been instructive to look at structured products for the
purpose of hedging currency risk. Space and time have unfortunately meant that such issues will
Applying the Framework 209
have to wait until a second edition of this book. That said, such constraints notwithstanding,
I hope the reader feels that the book has examined the topic of currency strategy, if not
exhaustively, then certainly in sufficient scope and detail to be able to make a measurable
difference to their bottom line. Talk is cheap. The point of this book is to make a difference
to the total or relative returns of investors and speculators, and in terms of reducing hedging
costs and boosting the profitability of corporate Treasury operations. It is my sincere hope that
it has gone some way to achieving this aim.
@Team-FLY
Conclusion
There is no getting away from it — currency forecasting let alone hedging, investing or trading
remains a tricky business. To the uninformed, such activity represents little more than tossing
a coin. If I have succeeded at all in this book, then I hope to have shown that it is significantly
more complex and sophisticated a process than that.
Economic theory, despite the intellectual weight of many of the great theorists of our time,
has struggled in its ability to model and successfully predict short- or medium-term currency
moves on a consistent basis. In reaction, some have taken the easy way out by relapsing into
the excuse that short-term exchange rate moves obey a random walk and therefore cannot be
predicted. To me, this is nothing more than the reaction of those who do not actually know the
answer to the puzzle of predicting exchange rates, but are afraid to admit it. Indeed, the very
success of such analytical disciplines as flow and technical analysis suggests serious flaws,
both in the idea of exchange rates obeying a random walk and in the idea of markets being
perfectly efficient. Both capital flow analysis and “charting” have added significantly to the
profession of currency strategy, not least in its ability to deliver results — and herein lies the key.
The arguments against the likes of flow and technical analysis are usually emotionally — or
ideologically — rather than empirically based. No-one has actually proven that flow or technical
analysis do not work, and what empirical evidence we have in fact suggests that they do work
and frequently on a more consistent basis than traditional exchange rate models.
The focus of the currency strategist, and in turn the currency market practitioner, should be
purely practical. This is a business and a business has to achieve measurable results. If that
business is to succeed, its results have to outperform consistently. While there are no guar-
antees — and certainly not with regard to exchange rates — adopting an integrated approach
to currency analysis, incorporating currency economics, flow analysis, technical analysis and
long-term valuation based on traditional exchange rate models, gives you the best chance of
achieving that outperformance. At the end of the day, currency strategists do not have the lux-
ury of just giving a view. Your “P&L” is measured in terms of your reputation, and that in turn
is a direct function of the performance of your views over time. That is exactly how it should
be. For corporate Treasurers or for asset managers or currency speculators, they are not putting
theoretical money on the line. On the very first day I joined the bank in 1998 as the Asian
crisis continued to flare, I was asked by the Finance Director of a multinational corporation
whether they should hedge their exposure to the Hong Kong dollar and would the peg “go”? My
answer was equivocal, not because I am the sort to usually give equivocal answers but rather
because there were two questions involved! On the first, I said that the competitive depreciation
212 Currency Strategy
of Asian currencies against the Hong Kong dollar meant that the risk premium embedded in
Hong Kong dollar forward prices would most likely rise and potentially substantially. On the
second, I said that the peg would remain in place because of the solid foundations of Hong
Kong’s currency board system and the determination of the Hong Kong Monetary Authority
to keep it in place. Nowadays, this might seem like stating the obvious, but at the time there
was real fear in the market that Hong Kong’s “peg” might break, as was the case for Asian
currency pegs during the Asian currency crisis. I mention this example neither for the purpose
of 20/20 hindsight nor to “look good”. Rather, I have included it to show the stakes involved.
Of course, the Finance Director will have had his own informed view of the risks involved
in the corporation’s specific exposure to the Hong Kong dollar. At the time, he most likely
wanted an outsider’s view, either to confirm or to question his own view. That outsider’s view
of the currency strategist makes a difference to the end result. If it didn’t, professional currency
market practitioners would not waste their valuable time.
For both corporations and investors, the exchange rate remains a crucial consideration within
foreign or overseas investment. At some point, when the world has but one currency, this will
not be the case, but until that happy(?) day, it remains so. The techniques used today, not
just to give an exchange rate view but more specifically to analyse and hedge a corporation’s
balance sheet risk or for that matter to help a currency overlay manager to add alpha, have grown
significantly in terms of complexity and sophistication in the past few years. Furthermore, what
currency instruments were only recently deemed as complex within the developed markets
are now seen as plain vanilla relative to the increasingly tailored needs of currency market
practitioners — and moreover are increasingly being demanded by local market participants
within the emerging markets.
It was said at the outset and it has to be repeated here that there is no such thing as objectivity,
certainly not where human beings are concerned. This book is the result of my knowledge and
experience, for good or ill, and therefore it is naturally skewed in a particular direction. That
direction, that bias has stemmed from the view that there has been a gaping hole in the analysis
of the currency markets, a hole which this book attempts to fill. More specifically, having long
been fascinated by the subject of the currency markets, I have wanted to read a book which
went beyond the traditional exchange rate models, both for the purpose of examining how
the currency market practitioners themselves deal with currency risk and moreover to have
the temerity to suggest to currency market practitioners a more integrated and rigorous way
of doing so. In short, I could not find anything out there that was actually aimed at currency
market practitioners themselves, so I decided to write such a book myself.
This is not to say the book is complete. Frankly, practically any book that is focused on
financial market analysis, however seemingly exhaustive, is likely in practice to be incomplete.
Space and time simply do not allow for all aspects to be covered. For instance, I would have
liked to have dealt in more detail with such issues as how corporations can use investor-based
tools such as a risk appetite indicator or such techniques as the differential or trend-following
strategies to time tactical and strategic hedging. Equally, it might have been instructive to
look at how currency speculators take advantage of perceived inefficiencies in options markets
through non-directional or “non-linear” trading strategies. Finally, ahead of EU accession in
2004 or 2005 by a number of countries within Central and Eastern Europe, it might have
been interesting to look at the issue of asset manager hedging of currency risk. Assuming that
the magnetic pull relating to EU convergence continues to increase, should asset managers
consider hedging currency risk at all? As the reader can see, when you enter a field such as
currency analysis and strategy, there is no discernible end in sight. Subjects such as these must,
Conclusion 213
given the practical considerations of space and time, be left to the prospect of a second edition
of this book.
To conclude, the “problem” with trying to analyse, forecast, hedge, trade and invest in the
currency markets is that currencies are affected by so many factors simultaneously — and
to complicate matters further the importance of those factors may change over time — so
it is difficult to tell the combined impact of the sum of these factors. To date, none of the
traditional exchange rate models have been able to incorporate all of the possible factors that
might impact exchange rates to the extent that they are then able to predict exchange rates
on a consistent basis over a short-term time horizon. Given the number of possible factors
involved, this is hardly surprising. The changeability of the importance of these factors is a
further complication. For instance, in 2001 a key factor affecting exchange rates was foreign
direct investment or FDI. Indeed, in 2001 the top three currencies in the world against the US
dollar — the Mexican peso, Peruvian sol and Polish zloty — were all the recipient of major FDI
inflows which offset their current account deficits and thus gave them a basic balance surplus.
Within the developed markets, FDI inflows have played an important though changing role
in the performance of the US dollar. In 2000, the US was the recipient of huge FDI inflows,
which in turn was seen as a major contributing factor for US dollar strength. FDI inflows slowed
sharply in 2001, causing the market to anticipate that the US dollar would fall sharply. It did
not happen. While admittedly it did not hit new highs against its major counterparts, the US
dollar remained relatively strong as the shortfall in FDI inflows was made up for by portfolio
inflows, which in turn helped finance the current account deficit. The danger in setting rules
about how capital should flow to countries with the highest nominal or real interest rates was
also apparent in 2001. In that year, the Federal Reserve cut interest rates 11 times, bringing
the Federal funds’ target rate down from 6.50% to 1.75%, while the European Central Bank
only cut its refinancing rate from 4.50% to 3.25%. In other words, the difference between the
Fed funds rate and the ECB’s refinancing rate went from +200 to −150 bp. Despite that, the
Euro was still unable to rally on a sustained basis. Relative growth patterns, which at times
have been a key driver of the Euro–dollar exchange rate, were also not the main answer. In
late 2000 and 2001, US industrial production contracted for the longest consecutive period
since July 1932, or the Great Depression. In the end, the market came to the view that financial
markets rewarded aggressive growth-oriented monetary policy, such as that adopted by the
Federal Reserve, in the form of portfolio inflows. All that one can say about this is that such
market favouritism has not always been the case in the past and is unlikely to always be the
case going forward. Indeed, in the future, there may well be other factors that surpass this in
terms of their impact on the exchange rate.
The discipline of trying to analyse and forecast exchange rates continues to require great
flexibility. If any exchange rate model were able to successfully incorporate all major factors to
produce consistently accurate exchange rate forecasts, it would surely be worthy of the Nobel
Prize for Economics. For now, the best answer for currency market practitioners remains to
adopt an integrated approach to currency analysis and strategy, involving the four disciplines
of currency economics, flow analysis, technical analysis and long-term valuation based on the
traditional exchange rate models.
Finally, it should not be forgotten that, despite the increase in global trade flows and the
even greater increase in portfolio capital flows over the last two decades, the currency market
is essentially speculative in nature, that is to say a majority of currency market practitioners are
“speculators”, trading currencies without any underlying, attached asset. In trying to forecast
exchange rates, the forecaster is effectively trying to predict the sum of the intentions, views
214 Currency Strategy
and trading styles of all such currency market practitioners, which is why such disciplines as
flow analysis, technical analysis and behavioural finance — or the psychology of the market —
come in particularly handy. Newspapers and newswires frequently describe market movement
in emotionally laden terms such as “panic”, “sentiment” and “market psychology”. At the end
of the day, currency market participants are human beings. They act or react according to their
own views, their own biases, and their own “skews”. Just as information is not perfect, so the
way information is interpreted is often skewed one way or another. The field of behavioural
finance has done much generally to illuminate the psychological aspects of financial market
activity and more specifically to demonstrate the kinds of mistakes that market participants
tend to make on a consistent basis. Active currency market participants would do well to learn
and remember these for the purpose of avoiding them in future. Market “sentiment” can be a
powerful thing. It can continue and extend far beyond any fundamental valuation, and of course
the longer it does that the more powerful the snap back when it eventually comes.
In the end, it comes down to that most economic of concepts, incentive. Speculators, who
make up the majority of the currency market, trade for the most part for the purpose of capital
or directional gain rather than income. The incentive of the interbank dealer is that of a surfer,
to ride the waves of liquidity that ebb and flow in the market, for the most part offsetting client
flows, sometimes taking positions either in their favour or against them. Split-second timing and
reactions are needed, and mistakes are punished. Equally, traders need to trade in order to make
a living, even in the absence of fundamental changes in the economy. De facto, at those times
when there is no fundamental change, they have to rely on other types of analysis to explain and
forecast price action. It is no coincidence that technical analysis has so deeply penetrated the
interbank dealing community. That is not to say interbank dealers ignore fundamentals. Rather,
it is to say that their job requires they look at more than just fundamentals and specifically
those types of analysis that might be better suited to short-term exchange rate movement. In
short, the people who devise these exchange rate models should spend time on a dealing floor
before they finish their work.
Lastly, a key aspect of this book is that I have attempted to be much more user friendly than
the works on currency markets that I have been used to. These days, it is not enough to trot out
theory and leave it to the client to extrapolate some practical meaning. Anyone can do that. It
does not add value. Instead, as noted above, through this book I have tried to bridge the gap
between economic theory and market practice. It is my hope therefore that the people who
really matter, the practitioners of the currency markets, be they corporate Treasurers, investors
or speculators, will have benefited in a measurable and practical way by the experience in
managing their own respective currency risks. It is this aspect in particular which I hope has
differentiated this book from the vast majority of books and research papers on the subject of
exchange rates.
Index
absolute returns, 159–61, 200
active currency management, 163, 166–71
AFTA, 138
‘alpha’, 163–5, 200–1
animal spirits see flow
Argentine peso, 110
ASEAN, 138
Asia, 12, 36, 68, 110, 119
Asian crisis, 31, 62, 115, 122, 176–7
asset and liability management, 198
Australian dollar, 56
baht, Thai, 27, 115, 121, 177
Balance of Payments Approach, 34–41, 195
Bangkok International Banking Facility (BIBF),
122
Bank of America, 53
Bank of England, 2, 40, 69, 177
Bank of International Settlements, 2, 7, 179
Bank of Japan, 71
Bank of Thailand, 176–7
bar chart, 92, 94
bearish divergence, 100
behavioural finance, 67, 190
benchmarks for currency risk management, 154
Berlin Wall, demolition of, 6–7
‘Big Mac Index’, 20, 22–4
bilateral asymmetry, 164
Black Wednesday, 2
bolivar, Venezuelan, 38, 110
Brazil, 12, 68, 110, 119, 124
real, 27, 55, 57, 76
Bretton Woods system, 6, 11, 17, 34, 48, 83,
107, 118
budget exchange rate, 154–5, 199
Canadian dollar, 57
candlestick chart, 92, 95
capital flows, 110–11
capital mobility, 114
carry trade, optimization of, 169–71, 202
charting, 87–100, 194–5
currency order dynamics and technical levels,
87–9
psychological levels, 90–100
trends, 90
Chicago Board of Trade, 69
Chicago Mercantile Exchange, 69
Chile, 110
China, 29, 36
yuan, 121
CitiFX Flows, 5, 72–6
Citigroup, 76
classic accounting identity, 35
Classic Emerging Market Currency Crisis
(CEMC) Model, 11, 117, 119–28, 131, 197,
203–5
Colombia, 39, 110
convertibility risk, 171
“Core Principles for Managing Currency Risk”,
144–5
corporate risk optimizer (CROP), 152–3
corporate treasurers, 183–4
corporation and predicting exchange rates, 155–6
covered interest rate arbitrage, 32
crawling pegs, 111, 112
currency analysis, integrated approach, 188
currency board, 112
currency economics, 10, 47–64, 193
currency hedging, 146–7, 206–8
benchmarks, 161–3, 200
currency optimisation, 152–3
currency overlay, 184
currency risk
core principles for managing, 144–5
managing, 143
measuring, 143–4
tools for managing, 148–9
@Team-FLY
216 Index
currency speculation, 13, 187–90
currency strategy, 202–8
Czech Republic, 31, 110, 113
koruna, 45, 57, 176, 206
Daewoo, 126
Deutsche Bundesbank, 2, 31, 113
Deutschmark, 2, 31, 175, 176
differential forward strategy, 166–7, 201
direct investment flow, 44
divergence, 100
dollar
Canadian, 57
Singapore, 57, 125
US, 5, 8, 9, 26, 29, 40, 42, 56, 60–1, 84, 131–2
Dornbusch, Rudiger, 26
double average rate option (DARO), 155
Dow, Charles, 85
Dow Theory, 85
EBIT, 151
EBITDA, 151
economic currency risk, 142–3, 197, 198
Economist, The,22
Ecuador, 110
Efficient Market Theory, 4, 48–9
Elliott Wave Theory, 101, 102, 194
emerging markets, 37, 109–10, 171–3
EMFX Flow Model, 76–7
equity flow, 44
Euro, 2, 11, 12, 31, 40, 56, 72, 73–4, 108
European Central Bank, 84, 213
European Monetary System, 6
European Union (EU), 41, 56
accession, 31
Euro-Zone portfolio flow report, 79–80
exchange controls, 171
exchange rate mechanism (ERM), 2, 11, 13, 69,
107, 117, 133, 175–6, 177, 180
crises 1992 and 1993, 6, 11, 31, 115, 175
ERM II, 31
exchange rate regimes, 11, 110–18, 196
fixed, 24, 27, 35–6, 111–14
freely floating, 24, 27, 36–7, 112–13, 128–33,
196
pegged exchange rate regimes, 111–14, 196
real world relevance, 116–18
sustainability, 114–16
exchange rates, 1
drivers of, 44–5
real interest rate differentials and, 33–4
“external imbalance”, 38
Federal Reserve, 28, 29, 36, 45, 61, 86, 130, 213
Federal Reserve Bank of New York, 10, 40, 67,
69, 86
Fibonacci, Leonardo, 100–1, 194
Fibonacci fan lines, 101
Fibonacci retracement, 101
Fibonacci sequence, 100–1, 194
financial development, 114
first-generation crisis models, 132
Fisher, Irving, 32
Fisher Effect, 32, 33
fixed exchange rate regimes, 24, 27, 35–6, 111–14
fixed income flow, 44
floating exchange rate regimes, 24, 27, 36–7,
128–33, 196
fear of, 112–13
flow, 65–84
medium-term flow models, 77–81
option flow/sentiment models, 82–3
proprietary models, 72–6
short-term emerging market flow models, 76–7
short-term models, 69–77
speculative and non-speculative, 83–4
flow analysis, 5, 10, 193–4
forecasting error, 165, 201
forint, Hungarian, 45, 55, 57, 206
forward rate bias, 155, 166–7, 172
frame dependence, 190
Frankel, Jeffrey, 26
Friedman, Milton, 113
fundamental analysis, 9, 15–45
Fundamental Equilibrium Exchange Rate
(FEER), 38–9
Gann analysis, 194
Gann angles, 101
Gann lines, 101
Gann theory, 101–2
Glasnost,6
Global Hazard Indicator, 53
Golden ratio, 101
Gorbachev, Mikhail, 6
Gulf War, 131
hedge funds, 182–3
hedging, 159
balance sheet, 150–2
currency, 146–7, 206–8
economic exposure, 152
emerging market currency risk, 153–4
internal, 198
matched, 165–6, 198
natural, 68
transaction risk, 150
hedging structures
enhanced, 149
traditional, 148
heuristic-driven mistakes, 190
Hong Kong, 36, 110, 212
Index 217
Hong Kong Monetary Authority, 212
Hungary, 31, 110, 113
forint, 45, 55, 57, 206
IMM Commitments of Traders Report, 69, 70–2,
194
India, 24
Indonesia, 36, 39, 176
rupiah, 27, 115, 125, 186
inflation, 114, 172
Instability Index, 53–5, 189
interbank dealers, 180–1
Interest Rate Approach, 31–4, 195
interest rate parity theory, 31–4
international equity funds, 162
International Fisher Effect, 33, 34, 142, 172
International Monetary Fund (IMF), 65, 69, 109,
113, 117, 124, 133, 176
Quarterly Report on Emerging Market
Financing, 80–1
investor herding, 5
invoicing in foreign currency, 198
Israel, 24
Japan, 5, 21, 37, 40, 41, 62–3
government bonds, 42–3
yen, 4–5, 40, 43, 55, 74–6, 121
J-curve, 62–3
Keynes, John Maynard, 9, 47, 65
Korea, 36, 62, 126
won, 27, 115
koruna
Czech, 45, 57, 176, 206
Slovak, 55, 206
Krugman, Paul, 26
Krung Thai Bank, 126
labour market flexibility, 114
LCPI Index, 53
leading and lagging, 198
line chart, 92, 93
liquidity risk, 171
lira, Turkish, 204
Louvre Agreement, 6
LTCH failure, 182
Lucas, Edouard, 101
macro hedge funds, 186
Malaysia, 69, 110
ringgit, 125
managing currency risk, 12, 13
corporation and, 137–56, 197–9
investor and, 157–74, 199–202
speculator and, 175–91, 202
matched hedging, 165–6, 198
Mexico, 12, 39, 68, 109–10, 119
peso, 38, 45, 55, 57, 76–7, 116, 138, 176, 213
model analysis, 11, 119–33
momentum funds, 186–7
Monetary Approach, 25–31, 195
monetary credibility, 114
Morgan, J.P., 53
moving average, 92, 96, 102
moving average convergence divergence (MACD)
indicator, 97–100
Mundell-Fleming model, 27–9, 30–1, 36, 43, 110
NAFTA, 138
NASDAQ, 158, 182
National Bank of Poland, 50, 127, 128, 129
“natural” hedging, 68
netting, 198
New York Stock Exchange, 69
New Zealand dollar, 56
Nigeria, 39
Norway, 39
operational controls, key, for Treasury, 147–8, 198
optimization model, 198–9
option risk reversals, 194
order flow models, 194
oscillator, 97
passive currency management, 160
Perestroika,6
performance benchmarks, 147–8
Peruvian sol, 45, 213
peso
Mexican, 38, 45, 55, 57, 76–7, 116, 138, 176,
213
Philippine, 125
Plaza Agreement, 6, 28–9
Poland, 31, 50–3, 110, 113
zloty, 45, 55, 57, 82, 213
Portfolio Balance Approach, 41–3, 44, 195
position limits, 147
position monitoring, 147
price adjustment, 198
productivity, 39–41
proprietary dealers, 181
proprietary flow models, 72–6
Purchasing Power Parity, 3, 7, 8, 17–25, 32, 33,
34, 38, 39, 117, 142, 195, 199
corporate pricing strategy and, 20–1
misalignments, 9
real exchange rate and, 23–4
tradable and non-tradable goods, 20
Rand, South African, 77
random walk theory, 44, 87, 102
real, Brazilian, 27, 55, 57, 76
218 Index
Real Effective Exchange Rate (REER), 3, 38–9,
63, 117
relative returns, 163–6
relative strength index (RSI), 97, 98
resistance in technical analysis, 87–9
ringgit, Malaysian, 125
risk appetite, 188–9
risk appetite indicators, 53–7, 195–6
risk reduction, 160–1, 200
risk reversals, 82–3
rouble, Russian, 27, 37, 38, 178
rupiah, Indonesian, 27, 115, 125, 186
Russia, 12, 37, 39, 68, 110, 117, 119
rouble, 27, 37, 38, 178
Salomon Smith Barney, 53
second-generation crisis models, 132–3
sentiment models, 82–3, 194
Sharpe’s ratio, 158, 160, 201
Signal Grid, 13, 195
Singapore dollar, 57, 125
Slovakia, 31
koruna, 55, 206
Smithsonian Agreement, 6, 107
South Africa, 8–9, 12, 21, 59–60
Rand, 77
Soviet Union, end of, 6
speculation, 48, 49–53
speculative cycle model, 197
Speculative Cycle of Exchange Rates, 52–3,
127, 128–31
speculative excess, 49–50
speculative flow, 44
speculators, 185–7, 202
standard accounting identity for economic
adjustment, 58–61
Sterling, 56
Sterling crisis, 2
sticky prices, 26
support in technical analysis, 87–9
Swiss franc, 54, 55
Taiwan, 36
technical analysis, 10, 85–103, 187, 194–5
challenge of, 86–7
charting, 87–100, 194–5
currency order dynamics and technical
levels, 87–9
psychological levels, 90–100
trends, 90
currency market practitioners and, 102–3
original and basic concepts, 85–6
schools of (technical) thought, 100–2
support and resistance in, 87–9
technical indicator, 97
“tequila crisis”, 38
terms of trade, 39
Thailand, 36, 62, 120–8, 176
baht, 27, 115, 121, 177
third-generation crisis models, 133
Tobin Tax, 7
tracking error, 165–6, 201
trade flow, 44
trade-weighted exchange rate (NEER), 38, 63
transaction currency risk, 140, 197, 198
translation currency risk, 140–2, 197, 198
trend-following strategy, 167–9, 201–2
trend-line resistance, 90
trend-lines, 90, 91, 96
Turkey, 12, 68, 110, 119
lira, 204
UK, 39
economy, 13
united forward rate theory, 142
US Treasury, 4, 29, 30, 60, 69
“TIC” report, 77–9
USA, 5
dollar, 5, 8, 9, 26, 29, 40, 42, 56, 60–1, 84,
131–2
trade deficit, 8, 21
treasuries, 55, 102, 127, 206, 212
valuation, long-term, 195
value at risk (VaR), 143–4
Venezuela, 39
bolivar, 38, 110
Williamson, John, 38, 116
won, Korean, 27, 115
World Bank, 123, 176
yen, Japanese, 4–5, 40, 43, 55, 74–6, 121
yuan, China, 121
zloty, Polish, 45, 55, 57, 82, 213