Diary of a Professional Commodity Trader: Lessons from 21 Weeks of Real Trading_3 pptx
Bạn đang xem bản rút gọn của tài liệu. Xem và tải ngay bản đầy đủ của tài liệu tại đây (1.12 MB, 24 trang )
interplay between expected (hoped for!) profits and likely
periods of capital drawdown.
Historically, my average annual rate of return has been a
multiple of two to three times my worst annual drawdown.
There are several acceptable methods to express the
relationship between return and risk (including the Sterling
ratio, the Calmar ratio, the Sortino ratio, and the MAR
ratio). For any given year, my modified Calmar ratio (the
annual return divided by worst month ending drawdown)
has been all over the map, ranging from a negative number
to as high as 30 to 1.
The $100,000 asset increment is based on my desire to
limit my expected worst-case drawdown each year to 10
percent of trading capital. This does not mean that my
drawdowns will never exceed 10 percent—or that I will even
be profitable, for that matter. The point is that my unit of
capitalization is based on risk parameters, not on factors
often used by novice traders in making decisions about
their trading operations. I have actually heard novice
traders say something like the following: “I have a $25,000
account and the margin for a soybean contract is $2,500;
therefore I can afford to buy or sell 10 contracts.” As a
general rule, I will trade no more than a single contract of
soybeans per $100,000 of capital.
My guess—and it is only a guess—is that many other
professional traders consider a capital unit to be at least
$100,000. Some of the better-known commodity trading
advisors accept accounts capitalized by no less than
$500,000 or even $1 million. These amounts obviously
represent their standard trading unit.
Overall Risk Management
Successful trading operations are dictated primarily by how
risk is managed. Many novice commodity traders assume
each trade will be a winner. Professional traders manage
their trading to assume that each trade may be a loser.
Obviously, there is a major difference between the two
perspectives.
The Factor Trading Plan operates with several global
assumptions, including:
I have no idea where any given market is
headed. I may think I know, but in reality I do not
know. History has shown that my degree of
certainty about a given market’s direction is
inversely correlated with what actually happens.
In fact, I think a trader with excellent money
management practices could take the other side
of trades in which I have a strong belief and
make money consistently.
About 30 to 35 percent of my trades over an
extended period of time will be profitable.
The probability of my very next trade being
profitable is less than 30 percent.
As many as 80 percent of my trades over shorter
periods of time will be unprofitable.
There is a high probability each year that I will
incur eight or more losing trades in a row.
There will be losing weeks, losing months, and
even losing years in my trading operations.
Important risk management guidelines have been
incorporated into the Factor Trading Plan to address these
global assumptions. The primary guideline is that the risk
on any given trade is limited to 1 percent of trading assets,
and preferably closer to half of 1 percent of assets.
Because I think in incremental units of $100,000, this
means that my risk per trade per unit of $100,000 is a
maximum of $1,000. My trading assets committed to
margin requirements rarely exceed 15 percent. I don’t recall
ever receiving a margin call for the account used to trade
my full program.
If I risk 1 percent of assets per trade and am wrong eight
straight trades at least once each year, it means that I will
experience a drawdown of at least 8 percent with certainty,
at least on a closed trade basis.
A 15 percent drawdown is about as much as I can
emotionally handle. I have encountered a drawdown of at
least 15 percent in 9 out of every 10 years I have operated
a fully implemented trading program.
I find myself more risk intolerant as I grow older. At the
present time, my risk management protocol attempts to
limit the maximum annual drawdown to 10 percent
(measured from week-ending peak to week-ending valley).
I attempt to ignore intraday equity spikes because I have no
desire to catch the bottom of each day’s high or low, and I
do not want to waste energy in even thinking about it. In
fact, as I will discuss in this book, I think it is unwise to pay
attention to account equity levels on a day-to-day basis.
I consider correlation between markets when
determining risk. For example, a bearish trend by the U.S.
dollar against the euro is also likely to be accompanied by
U.S. dollar losses against the Swiss franc and British
pound. A bull market in soybeans is likely to be
accompanied by advances in soybean oil or soybean meal.
In composite positions of highly correlated markets (grains,
interest rates, stock indexes, currencies, precious metals,
industrial commodities), I attempt to limit my risk to 2
percent of assets. All successful trading operations must
be built on a foundation of overall risk management.
Points to Remember
The commodity and forex markets are highly
leveraged.
Unlike stocks and bonds, trading commodities
and forex markets is a zero-sum game. For you
to be profitable, someone else must lose money.
Do you have adequate capital to trade
commodities, and can you afford to lose it?
Can you understand and manage the emotional
swings of market speculation?
Do you have the emotional or psychological
need to be right on your trades? Can you accept
an approach to trading that is wrong on the
majority of trading decisions?
Would your primary focus in trading be to find
winning trades or to manage losing trades? Risk
management must be given priority over trade
identification to achieve consistently successful
performance.
Chapter 3
Identifying the Trades and the
Trading Vocabulary
Iwill now move to the mechanics of the Factor Trading Plan.
The trading plan attempts to answer such questions as:
What markets should I trade?
Should I be long or short?
Should I get in now or wait—and if I wait, what
exactly should I wait for?
These practical and tactical questions, and more, are
answered by the components within the trade identification
pillar of the Factor Trading Plan, as shown in Figure 3.1.
FIGURE 3.1 The Trade Identification Pillar.
This is an appropriate point to reemphasize that I have
no pretention that my approach to trading is the best for
everybody or that my trading operations cannot be
improved. In fact, as you read through this book you will no
doubt see many warts on my trading plan.
The primary point I want to make by describing in detail
the Factor Trading Plan is not that my trading is particularly
clever, but that a comprehensive plan covering all of the
important aspects is necessary for consistently successful
trading operations. The process of trading is an important
part of consistent success. A trader needs to anticipate as
many contingencies as possible in his speculative
maneuvers.
The Factor Trading Plan is based upon the following set
of assumptions:
The likely direction of any given market cannot
be determined by studying charts.
Charts are a trading tool, not a predictive tool.
Charts can provide traders with a slight edge,
but should not be used to make price forecasts.
Charts should not be used to maintain a constant
opinion or position in any given market.
Do not assume that the next trade will be
profitable.
More often than not a market will defy what its
chart structure implies.
Markets make enormous moves that can’t be
explained by classical charting principles.
With these assumptions in mind, Chapters 3 through 5
cover how the Factor Trading Plan works, focusing on the
trading components. This chapter lays down the general
concept used to identify trades and defines the terminology
or “shop talk” used by the trading plan. Chapter 4 shows
examples of the ideal types of trades sought by the plan.
Chapter 5 details the types and frequency of trades
engaged by the trading plan, discusses how trades are
entered and exited, and explains the logistics of how the
entire plan is managed.
Trade Identification
There are numerous methods used by traders to define a
trade. The important point is that a trader must be able to
know what is or is not a trading signal, event, or moment.
This is true whether a trader uses a mechanical or
discretionary technical approach, a supply-and-demand
fundamental approach, or an economic model. Lack of
certainty if a market is or is not setting up a trade is a
cardinal sin. This is why I recommend that novice traders
paper-trade or trade a small trial account for a year or two
prior to placing real skin in the game.
The Factor Trading Plan is based on a technical
approach to market analysis. Technical trading approaches
study price behavior itself to identify candidate trades and
generate trading signals. In contrast, fundamental trading
approaches are based on the supply-and-demand factors
of a market and general overall economic conditions. It is
not within the scope of this book to delve any deeper into
different approaches to market analysis or trading.
The technical approach used by the Factor Trading Plan
falls into a category known as discretionary (as opposed to
the mechanical approach used by many technical traders).
A discretionary trading plan requires that the trader makes
certain subjective judgment calls from one trade to the next,
whereas a mechanical (some market operators use the
term black box) system is programmed to generate
precise entry and exit instructions in order to eliminate day-
to-day human decision making.
Using a discretionary approach is a personal preference,
not in any way an indictment against mechanical systems.
In fact, some of the more frustrating aspects of my own
trading could possibly be resolved if I used a mechanical
system. But, in general, I believe that a discretionary
approach better fits my personality and understanding of
price behavior and dynamics.
More specifically, the Factor Trading Plan uses classical
chart patterns as the basis for all trading decisions. A
discussion of classical charting principles can be found in
Chapter 1.
Vocabulary of the Factor
Trading Plan
All industries and companies have their own shop talk to
describe concepts and practices inherent in their business
operations. While definitions of terms often appear in the
appendix of a book, I believe it is very important to lay out
the operating and tactical terms of the Factor Trading Plan
at this point of the book. Understanding certain terms will
enable you to follow my discussion of charts and trades
during the remainder of this manuscript.
The terms and definitions are not listed alphabetically but
in the order I think through things during actual trading
operations.
Trading Unit
As a trader, I think in units of $100,000. When I calculate
risk and leverage, it is always in relationship to $100,000
blocks of capital. Thus, if I am trading a $500,000 block of
money, I think about it as five trading units.
Position Unit
A position unit is the number of contracts or size of a
position taken per $100,000 and determines the risk
assumed on a trade. The risk is normally about six-tenths to
eight-tenths of 1 percent. I refer to a position with less risk
as an underleveraged position and positions with more risk
as extended-leverage positions.
Position Layering
Often, I attempt to build a position by entering into a trade
on multiple dates and at different prices. For example, if I
establish a position in anticipation of a future breakout, I
consider myself to have established the first layer. If I
establish another position at the breakout of a major
pattern, I become two layers deep. Perhaps a near-zero-
risk opportunity to extend leverage develops at a retest;
then I could become three layers deep. Now if I can find a
pyramid opportunity, I will end up with a four-layer position. I
do not add to a losing position, but put on layers only as
earlier layers are profitable. Even in a multiple-layer
position, my combined risk in a market rarely exceeds 1
percent.
Multiple-layer trades are not the norm.
Breakouts
I am a breakout trader. But I define a breakout in two ways.
First, all patterns have boundary lines that define the exact
geometry of the patterns. Some traders and market
analysts draw boundary lines precisely with a fine-point
pen. I draw boundary lines roughly, often cutting through
some highs and lows in order to provide the best fit of an
area of price activity to a geometric pattern. I also use thick
lines, not a fine-point pen, to establish the boundary. Of
course, there are instances when I call a breakout too
closely—and I often pay the price for doing this.
Robert Edwards and John Magee considered a
breakout to be a price penetration equal to or greater than
3 percent of the value of a stock. This is far too generous
when trading commodities. For example, a 3 percent
breakout in $1,000 gold would be $30 per ounce.
A breakout is more complicated than simply penetrating
a pattern boundary. All patterns are comprised of minor or
intermediate high and low points. These high and low
points define the parameters of the boundary lines. To be a
valid breakout, I also want to see a market penetrate the
most recent high or low price that defined the boundary.
And to be most comfortable with a trade, I want to see a
market penetrate the highest or lowest price within the
completed boundary. Figure 3.2 show these chart points on
a weekly graph of the British pound/U.S. dollar (GBP/USD).
FIGURE 3.2 Pattern Breakout in the British Pound.
Ice Line
I use the terms ice line and boundary line interchangeably.
The concept of the ice line is that once a market moves
through the boundary of a pattern, that boundary line ideally
should separate all the price action that preceded the
breakout from the price behavior following the breakout.
The ice line is analogous to a sheet of ice on a lake in the
winter. The ice supports a person or vehicle from dropping
into the water. But once the person breaks through the ice,
the ice sheet then becomes a barrier to survival. Figure 3.3
shows the ice line in GBP/USD. Figure 3.4 displays the
same concept in platinum.
FIGURE 3.3 Ice Line in the British Pound.
FIGURE 3.4 Ice Line in Platinum.
Out-of-Line Movement
Drawing boundary lines on chart patterns is not an exact
science. The reality is that a market does not care where I
draw a boundary line. There is nothing magic about
geometric boundaries. It is great when the minor or
intermediate lows or highs of a market provide a perfect
demarcation for boundary lines, but this is the exception
and not the norm. A boundary line should be drawn to best
fit to an area of price congestion even if it means that the
boundary line is drawn through some of the price bars.
There are occasions when a daily price bar significantly
penetrates a boundary line on an intraday basis, but then
almost immediately returns back into the geometric pattern.
Such price action was defined by Edwards and Magee as
an out-of-line movement. While out-of-line movements can
create some tactical challenges to trading, history will
usually show the out-of-line price activity as just a one- or
two-day freak incident. Boundary lines do not need to be
redrawn to accommodate out-of-line movement. Figures
3.5 and 3.6 exhibit out-of-line movements in London sugar
and New York sugar, respectively.
Premature Breakout
A premature breakout is different from an out-of-line
movement in the sense that a premature breakout can
close outside of a predrawn boundary line and even spend
several days in breakout mode. Prices then return back to
the geometric pattern. However, the initial breakout was
only a harbinger of things to come, and within a few weeks
a genuine breakout occurs. I call these subsequent
breakouts secondary breakouts or pattern recompletions.
Figure 3.7 shows this concept in cocoa.
FIGURE 3.5 Out-of-Line Movement in London Sugar.
FIGURE 3.6 Out-of-Line Movement in March Sugar.
FIGURE 3.7 Premature Breakout in Cocoa.
False Breakout
Unlike the premature breakout, which is followed by a
genuine breakout in the same direction, the false breakout
results in prices either developing a much larger pattern or
strongly moving in the opposite direction. Some traders
refer to false breakouts to the downside as a bear trap and
false upside breakouts as a bull trap. This means that
traders who normally position themselves in the direction of
the initial price thrust get stuck on the wrong side of the
market. Figure 3.8 shows a false breakout in the German
Deutscher Aktien Index (DAX).
FIGURE 3.8 False Breakout and End-Around in the DAX.
In 2009, a great example of the false breakout occurred
in the U.S. stock index markets. As shown in Figure 3.9, the
Standard & Poor’s (S&P) 500 futures completed a nine-
week H&S pattern in July. Prices closed below the neckline
and remained in a breakout mode for five days before
turning up sharply. The full price action of July 14 was
above the neckline and indicated that a bear trap had been
triggered. On July 16, the market rallied strongly above the
previous right shoulder high, generating a very reliable buy
signal.
FIGURE 3.9 A False Breakout and Subsequent Buy Signal
in the S&Ps.
Breakouts that are not genuine create a difficult trading
dilemma. A trader who becomes positioned at the
breakout does not know whether the subsequent return into
the pattern represents a one-day out-of-line movement, a
premature breakout or a false breakout. For this reason, I
generally abandon any position that has a significant return
to the pattern.
Horizontal versus Diagonal Patterns
I greatly prefer to trade a pattern that offers a horizontal or
flat boundary, such as the boundaries of a rectangle,
ascending triangle, H&S, etc. I consider such patterns to be
horizontal. The reason these are superior patterns for
trading is that the penetration of a boundary line most often
occurs simultaneously with the violation of a major or minor
high or low point within the pattern. An example can be
seen in Figure 3.10, a rectangle that developed in gold in
2007. The decisive penetration of the upper boundary also
penetrated the important April high, signaling a bull move.
FIGURE 3.10 Gold Displays a Horizontal Chart Pattern.
Diagonal patterns, by contrast, have slanted boundary
lines. This creates three practical problems. First, my
experience is that there are far more false or premature
breakouts of slanted chart lines than in the case of
horizontal boundaries.
Second, the penetration of a diagonal boundary may or
may not violate a minor or major preceding high or low.
Figure 3.11 shows a trendline in the EUR/USD, which was
problematic in 2009.
FIGURE 3.11 Problematic Diagonal Chart Pattern in the
Euro/U.S. Dollar Crossrate.
The trend line was violated in late October. The practical
problem then becomes whether to redraw the trend line or
deal with continued false trend-line violations, such as
occurred later in November.
Third, the retest of the boundary of a diagonal pattern line
would be progressively adverse to the position as days or
weeks go on. Figure 3.12 shows a breakout of a falling
wedge in gold followed by several days of retesting that put
a breakout trade into a loss.
FIGURE 3.12 Diagonal Pattern in Gold.
The problems with the diagonal boundary become
particularly acute when dealing with a trend line or a
channel line. In fact, I normally do not consider a trend line
to be a tradable event unless the market has tested the
trend line numerous times.
Last Day Rule
The Last Day Rule is the principal method used in the
Factor Trading Plan to determine the initial protective stop
order once a position is entered.
If a pattern breakout is valid, then it logically follows that
the day of the breakout is a significant event. Ideally, I
establish a position at the point of a price breakout and use
the low of an upside breakout day or the high of a downside
breakout day to set my protective stop levels. This is called
the Last Day Rule.
In cases when a market gaps through a boundary line or
opens at or near a boundary line just prior to breaking out, I
may elect the high or the low of the preceding day to
determine the Last Day Rule.
Figure 3.13 shows a Last Day Rule in crude oil that
remained unchallenged. In fact, the Last Day Rule nearly
always remains unchallenged in valid chart pattern
completions.
FIGURE 3.13 Last Day Rule in Crude Oil.
Figure 3.14 shows two Last Day Rules in silver, the first
of which was breached, the second went unchallenged.
FIGURE 3.14 Two Last Day Rules in Silver—One Failed
and One Worked.
Throughout the book, on as many charts as appropriate, I
have noted the Last Day Rule with the designation LDR
and a thin line and price.
Last Hour Rule
There are instances when a very large trading range occurs
within a pattern on the day of a breakout. As a result, the
Last Day Rule may represent a risk far exceeding the
idealized four-fifths of 1 percent determined by money
management guidelines. In such cases I may elect to use
tighter protective stop placement. But rather than simply
using some dollar amount I prefer to set a tighter stop using
a chart point.
This tighter stop point may be determined by the high or
low of the last hour spent within a pattern prior to the
breakout, or the last 120 minutes, 240 minutes, or whatever
time frame fits the risk and reward parameters I seek for a
trade.
Ideally, if using the Last Day Rule offers an inappropriate
risk level, I prefer to find a point on an intraday chart that
represented a minor rally or reaction prior to the breakout.
Of course, there are occasional trades when a money
management stop is the best I can do. I conveniently use
the phrase Last Hour Rule whether the stop is based on an
hourly chart, two-hour chart, three-hour chart, or any other
intraday time increment. Figure 3.15 shows a violation of
the Last Hour Rule in the S&Ps.
FIGURE 3.15 Last Hour Rule in March S&Ps.
The concept of the Last Day Rule also applies to weekly
and even monthly charts. This risk management guideline
will hold true for valid breakouts on charts of any time
length.
Retest
My experience through the years is that the best trades
break out cleanly, go almost immediately, and never look
back. In fact, I believe that my net bottom line as a trader
would have improved if I had exited every trade that closed
at a daily loss. I wish I had the data to run such a simulation.
But, often, a trade will hesitate following the initial breakout
and retest the boundary within a few days to a week or so.
Such a retest is normal and should not greatly concern a
trader as long as the retest does not severely challenge the
ice line. Retests in valid pattern breakouts normally do not
penetrate the ice lines. Figure 3.16 displays a retest of a
breakout in the Chicago Board of Trade (CBOT) rough rice
market. Note that the retest itself took the form of an 18-day
flag.
FIGURE 3.16 Retest of H&S Top in Rough Rice.
Hard Retest
A hard retest occurs when prices actually slice back into
the completed pattern. While a hard retest can test the
patience of a trader, it does not in and of itself mean that
the pattern will fail.
I have been asked over the years if it would be wise not
to take a trade at the breakouts, but instead attempt to
establish a position upon the retest of the completed
pattern. My answer to this question is an unqualified “NO!”
Think about this matter logically. By not taking a trade at the
point of a breakout, but instead waiting for some type of
retest, a trader is eliminating trades that work immediately
and do not look back, which are exactly the most desirable
trades. A market that retests a pattern is inherently more
likely to fail than a market that never has a retest. A hard
retest is shown in the U.S. dollar/Canadian dollar
(USD/CAD) in Figure 3.17.
FIGURE 3.17 Hard Retest in USD/CAD.
Retest Failure Rule
A hard retest of a pattern allows me to adjust my stop using
the high or low of the hard retest as a new protective stop
point. Assuming that the initial stop was based on the Last
Day Rule and a hard retest occurs, I can then advance a
stop to just above the hard retest high in the case of a short
position, or just below the hard retest low in the case of a
long position. Figure 3.18 displays this concept on a
weekly chart of November 2010 soybeans. Note the
breakout of the 12-week week triangle the week of
November 11 (letter A), the hard retest the week of
December 25 (letter B), and the subsequent retest failure
the week of January 15 (letter C).
FIGURE 3.18 Retest Failure Rule on the Weekly Soybean
Chart.
Target or Objective
Each chart pattern carries the implication for the magnitude
of an ensuing trend. As a general rule, the minimum move
following the completion of a chart pattern should be equal
to the height of the pattern itself, although the exceptions to
this rule are numerous and complex. In nearly every case, I
take profits (partial or complete) when a market reaches its
target. Figure 3.19 displays that the target in sugar is
based on the principle that the distance from C to D should
be equal to the distance from A to B, as shown. Figure 3.20
exhibits the same concept for the ascending triangle in the
GBP/USD, where C to D should equal A to B.
FIGURE 3.19 Price Target from Triangle in Sugar.
FIGURE 3.20 Price Target from Ascending Triangle in
GBP/USD.
I use two other methods to determine price targeting. The
first involves a technique known as swing objectives. The
principle of a swing objective is that markets tend to
advance or decline in legs that are of approximately equal
distance.
Finally, I may periodically use point and figure (P&F)
charts to calculate a longer-term target. P&F charts
measure the amount of price action over a period of
consolidation and are not time related. I use P&F counts
several times each year when I believe that a period of
consolidation (usually a large bottom or base) will produce
a trend much more extended than indicated by the pattern
target.
Important note: There is no guarantee that any market
will reach its target. Traders need to be alert for markets
that run out of steam prior to attaining a target.
Intervening Patterns and Pyramiding
During a sustained trend, a market frequently will
experience a pause. These pauses often form smaller
independent consolidation patterns. These patterns can be
a continuation in form, meaning that another thrust in the
direction of the dominant trend will be produced, or reversal
in form, implying that the previous trend has come to a
temporary or more permanent end. Continuation patterns
offer the opportunity to both pyramid an initial position and
to tighten up the protective stops on the initial position.
Reversal patterns offer the opportunity to avoid riding the
initial position back to the starting gates (or what I call a
popcorn or round-trip move).
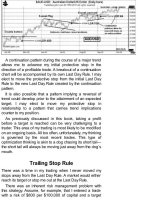
As a trader, I have mixed feelings toward continuation
patterns—and my feelings differ based on the duration of
the pauses within the main trend. Long pauses (more than
three or four weeks) can wear down my patience. I much
prefer shorter-duration pauses in a main trend, especially if
the move coming into the pause was strong and the pause
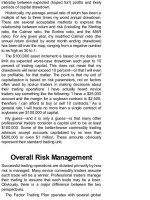
takes the form of a pennant or flag. Figures 3.21 and 3.22
display continuation patterns in Australian dollar/U.S. dollar
(AUD/USD) during the same advance on the weekly and
daily charts, respectively.
FIGURE 3.21 Continuation Patterns on the Weekly
AUD/USD Graph.
FIGURE 3.22 Continuation Patterns on the Daily
AUD/USD Graph.