Diary of a Professional Commodity Trader: Lessons from 21 Weeks of Real Trading_4 potx
Bạn đang xem bản rút gọn của tài liệu. Xem và tải ngay bản đầy đủ của tài liệu tại đây (1.23 MB, 24 trang )
A continuation pattern during the course of a major trend
allows me to advance my initial protective stop in the
direction of a profitable trade. A breakout of a continuation
chart will be accompanied by its own Last Day Rule. I may
elect to move the protective stop from the initial Last Day
Rule to the new Last Day Rule created by the continuation
pattern.
It is also possible that a pattern implying a reversal of
trend could develop prior to the attainment of an expected
target. I may elect to move my protective stop in
relationship to a pattern that carries trend implications
counter to my position.
As previously discussed in this book, taking a profit
before a target is reached can be very challenging to a
trader. This area of my trading is most likely to be modified
on an ongoing basis. All too often, unfortunately, my thinking
is governed by the most recent trades. This type of
optimization thinking is akin to a dog chasing its short tail—
the short tail will always be moving just away from the dog’s
mouth.
Trailing Stop Rule
There was a time in my trading when I never moved my
stops away from the Last Day Rule. A market would either
reach its target or stop me out at the Last Day Rule.
There was an inherent risk management problem with
this strategy. Assume, for example, that I entered a trade
with a risk of $800 per $100,000 of capital and a target
equal to $3,200 per trading unit. The initial relationship of
reward to risk was four to one. Next, assume that the
position went my way and reached a point where I had an
unrealized profit of $2,400 per unit. This meant that I had
$800 left to gain before taking profits. Leaving my stop at
the original level meant that I was now risking $3,200 to the
original Last Day Rule stop in order to gain the final $800.
This was insane money management, so I had to come
up with some means to readjust my risk and reward
parameters. For the sake of brevity, I will not take the time
or space to discuss the popular concepts of a trailing stop
based on a dollar amount or percentage retracement.
I developed a concept I call the Trailing Stop Rule. This
trading guideline requires three days of price action to be
implemented: the new high or low day, the setup day, and
the trigger day.
Figure 3.23 shows the Trailing Stop Rule in action on a
long position in the Dow Jones. The first step to the exit
strategy is to identify the highest day of the move. Of
course, it will change as new highs are made. The high day
in the Dow was August 28. The setup day occurs on any
day a market closes below the low of the high day. This
occurred on August 31. The trigger and exit then takes
place when the low of the setup day is penetrated. This
occurred on September 1.
FIGURE 3.23 Trailing Stop Rule in DJIA.
I want to emphasize that there is nothing technically
significant about the Trailing Stop Rule. It is simply a means
to prevent a popcorn or roundtrip trade from occurring.
Figure 3.24 shows the activation of the Trailing Stop Rule
almost immediately after a pattern completion in
GBP/USD.
FIGURE 3.24 Trailing Stop Rule in GBP/USD.
Weekend Rule
The Richard Donchian Weekend Rule is a technique I may
employ to extend the leverage in a trade. Donchian is
considered to be the creator of the managed futures
industry and is credited with developing a systematic
approach to futures money management. His professional
trading career was dedicated to advancing a more
conservative approach to futures trading. Donchian passed
away in the early 1990s.
The Weekend Rule basically states that a market that
decisively moves into new high or low ground on a Friday is
very likely to continue the move on Monday and early
Tuesday of the next week. The reasoning behind the
Weekend Rule is that a decisive new high or low on Friday
indicates the willingness of “strong hands” to take a
position home for a weekend.
The Weekend Rule is even more valid when there is a
long, three-day weekend.
For me, the Weekend Rule becomes most significant
and useful when a pattern breakout (especially a weekly
chart pattern) takes place on a Friday. In such cases, I may
extend my risk from six-tenths to eight-tenths of 1 percent to
a full 1 or 2 percent.
Figures 3.25 and 3.26 show major breakout days (all on
Fridays) in the bull market in sugar in 2009.
Market Runs
The type of trend I most appreciate are straight-line market
runs. Such runs are actually quite typical of strong trends.
There are two types of straight-line moves, as shown by the
accompanying examples.
Figure 3.27 of March soybean oil displays the first type of
market run—a trend characterized by a series of
continuous lower highs (or higher lows in the case of an
advance). In this case, the market had 18 straight days of
lower highs during a substantial drop. Nearly four weeks of
lower lows is probably more than a trader can expect from
a trend, but the point is that strong trends can be viciously
persistent.
FIGURE 3.25 Weekend Rule Breakout in Sugar, May
2009.
FIGURE 3.26 Weekend Rule Breakout in Sugar,
December 2009.
FIGURE 3.27 A Sustained Market Run in Soybean Oil.
The chart of the nearby contract of gold (Figure 3.28)
displays the second type of market run. In this case the
trend contained days with intraday lows beneath the
previous days’ lows, but in no case from October 29
through December 4 did the market close below the
previous day’s low.
FIGURE 3.28 A Market Run in Gold.
Pattern Recompletion
I have discussed the concept of the premature breakout. A
premature breakout assumes that there subsequently will
be a genuine breakout. I refer to the secondary breakouts
as pattern recompletions. Figure 3.29 is an extreme
example of this idea. In July, the U.S. dollar/Japanese yen
(USD/JPY) completed an H&S top pattern. After reentering
the pattern in early August, the pattern was recompleted on
August 27. The market then trended to the target at 86.20.
For risk management, I used the Last Day Rule of the
secondary completion at 94.58 (the August 26 high) to
establish my protective stop level. As a general rule, I will
attempt one pattern recompletion per major pattern. After
that, I will count my losses and go shopping elsewhere.
FIGURE 3.29 Pattern Recompletion in USD/JPY.
It is easy for a discretionary trader to become obsessed
with a particular market that has delivered a few straight
losing trades, thinking that the market owes him something.
This is a bad mental state to enter. Being compelled to
recoup losses from a particular market in the same market
is a dangerous practice. At least once each year I get
caught up in this vicious cycle. I must constantly remind
myself that there will always be another market at another
time.
Points to Remember
It is necessary to have an organized method to
make the important decisions involved in trading,
such as what market to trade, when to trade it,
how to enter, how to set stops, how to exit, and
what leverage to use.
A trading plan must be based on the key
assumption that it is impossible to know with
certainty the direction of any given market at any
given time.
Classical charting can serve as the basis for
creating a trading plan.
Successful trading plans must have precise
definitions of market behavior and trading
actions.
Chapter 4
Ideal Chart Patterns
The technical approach I use is based on a subset within
technical analysis known as classical charting principles
(see Chapter 1). Specifically, I look for recognizable
geometric patterns formed on high/low/close price bar
charts to identify candidate trades. More specifically, I
select candidate trades that meet the following criteria on
price charts:
For a major price trend, a continuation or
reversal chart pattern of at least 10 to 12 weeks
in duration visible on both a weekly and daily
chart (although the daily and weekly charts may
display slightly different geometric profiles).
For a minor price trend continuation on a daily
price graph only, a chart pattern of at least four to
eight weeks in duration.
For a minor price trend reversal on a daily price
graph only, a chart pattern of at least six to 10
weeks in duration.
For a pyramid opportunity within the context of a
trend launched from a weekly chart, a very brief
price pause (known as a flag or pennant) of one
to four weeks in duration visible on a daily chart.
Chapter 5 will discuss in more detail the importance of
understanding the whole idea of how many weeks it takes
for a pattern to develop and why it is important to the Factor
Trading Plan.
Just as bank tellers are trained to detect counterfeit
currency by studying real money, it is important to exhibit
examples of the genuine patterns sought by the Factor
Trading Plan. Following are examples of “cherry-picked”
chart patterns from 2008 and 2009. These charts exhibit
the ideal types of trading situations.
I must emphasize at this point that it is easy to spot these
patterns after the fact. The challenge of the chart trader is to
identify and react to these types of chart configurations in
real time. Nevertheless, laying down the best examples of
chart formations is a great place to start.
As I point out elsewhere in this book, the types of
patterns presented here are not typical of the trades I make
on a regular basis—I only wish this were true! Y will see
ou
plenty of my mistakes and examples of lack of patience in
Part III of this book. But, for now, it is good to fix your mind
on the ideal chart situation that I seek.
Reversal H&S Pattern in
Copper
Figure 4.1 shows that copper completed a six-month H&S
top pattern in early August 2008, followed in late August by
a retest of the neckline. In the case of a valid chart pattern,
it is unlikely that a retest, if any, can make much progress
past the boundary line of the completed pattern. Normally,
the boundary line acts as an “ice line” against any price
movement back into a completed pattern. Notice that the
retest did not violate the Last Day Rule of the August 4
pattern completion.
FIGURE 4.1 H&S Top Ends a Five-Year Bull Market in
Copper.
Belabored patterns such as this have a way of wearing
out the chart trader, who jumps the gun many times before
the real trend begins. Traders that attempt to anticipate a
pattern completion can become chopped up and become
gun shy by the time the real breakout occurs. I know this
from experience.
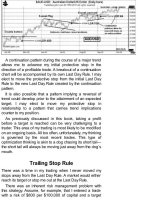
Reversal Rising Wedge in
AUD/USD
In early August 2008, the AUD/USD (Australian dollar and
U.S. dollar crossrate) completed a 12-month rising wedge
reversal pattern (Figure 4.2). As a general rule, prices
decline sharply from rising wedges while breakouts of
falling wedges back and fill, taking time for a new trend to
get under way.
FIGURE 4.2 One-Year Rising Wedge in the Aussie Dollar
Leads to a Waterfall Decline.
Continuation Wedge and
Reversal Failure Top in
Soybean Oil
Two charts are shown for this market. Soybean oil topped
in March 2008. Following the March decline, the market
staged a rally, finalized by a 15-week continuation wedge,
completed on July 21 (Figure 4.3). If you look carefully, you
will see that the final eight weeks of the wedge took the
form of a symmetrical triangle. It is not unusual for large
patterns to be launched by smaller patterns. For this
reason, one of the trading signals I look for is a smaller
pattern to become pre-positioned for a possible breakout
of a larger pattern.
FIGURE 4.3 Eight-Week Triangle Caps Off a 15-Week
Rising Wedge in Soybean Oil.
The decline on September 5 in soybean oil completed a
massive failure (or double) top reversal pattern by
penetrating the early April low (Figure 4.4). Note the retest
in late September. This retest rally could not get back
above the ice line. Recall that when the breakout day has
very little price activity within the completed pattern I will use
the day previous to the breakout to establish the Last Day
Rule. The breakout day was September 5, but the Last Day
Rule was September 4. The target of 32 cents was met in
late October.
FIGURE 4.4 Seven-Month Failure Top Leads to Historic
Drop in Soybean Oil Prices.
Reversal Triangle Bottom in
Sugar
Figure 4.5 shows that the rally in late December 2007
completed a six-month symmetrical triangle bottom in
sugar.
FIGURE 4.5 Classic Six-Month Symmetrical Triangle in
Sugar.
Continuation and Pyramid
Patterns in USD/CAD
The chart of this market from 2008 displays two types of
patterns (Figure 4.6). The advance in early August
completed a continuation seven-month ascending triangle.
The market retested the breakout in late August. A
subsequent retest in late September made my life difficult
and, in fact, forced me to lighten up my position. However,
even this second retest had little ability to penetrate the
completed triangle. The advance in the second week of
October completed a nine-week continuation broadening
pattern, providing the opportunity to pyramid the trade.
FIGURE 4.6 Major Advance in USD/CAD Began with a
Seven-Month Ascending Triangle.
Reversal Top in Silver
The silver market is not for the faint of heart. This market
can provide many fake-outs before rewarding a persistent
trader. Note the very small three-week double top in March.
I normally do not trade reversal patterns of such short
duration. The market found a line of support in April, May,
and June before starting a rally. This rally carried above the
highs from April and May and really threw me a curve ball.
On September 11, I interpreted the price behavior as a
three-month-plus rounding pattern and went long. It was a
bull trap. The market quickly reversed and in early August
completed a six-month failure top (Figure 4.7). Markets that
generate a bull or bear trap prior to a real completion
normally experience strong trends. The reason is that a trap
prior to the real move locks traders into a losing position
that it will not let them out of easily.
FIGURE 4.7 Six-Month Failure Top in Silver.
There is an important lesson in this chart. From late
March through early July the market punished traders who
bought strength or sold weakness with the expectation of
holding a position for longer than a few days. This period of
choppiness likely made traders very gun shy. It would have
been very difficult for a chart trader to sell the August 7
breakout with the idea that silver was not being sold in the
hole. Y selling the August 7 breakout, even though the
et,
market was severely oversold, was the most profitable
trade on the chart shown. Trades that are the emotionally
toughest to execute are often the most financially
rewarding.
FIGURE 4.8 Continuation H&S Pattern Leads to Stock
Market Collapse of Late 2008.
Continuation H&S Pattern in
the Russell 1000 Index
During the stock market collapse of 2008, the chart of the
Russell 1000 formed an eight-month continuation H&S
pattern (Figure 4.8). I have seen some chartists take too
many liberties in identifying many patterns. One of the rules
for an H&S pattern is that the right and left shoulders MUST
overlap. The breakout of the neckline in mid September
was very tricky because prices quickly traded back above
the neckline. The initial breakout was premature. The
breakout in late September was the real deal, and the
market reached the target in November, finally bottoming
out in March 2009. Notice that the head of the eight-month
H&S took the form of a five-week H&S pattern.
When Is an H&S Pattern Not Real?
I am often amused by the interpretation of charts made by
talking heads on CNBC and other financial media outlets. One
of the patterns most bastardized by the “experts” is the
traditional H&S pattern. As a general rule, genuine H&S tops
and bottoms must be characterized by three features:
1. Remembering that an H&S pattern is most often a
reversal pattern, there must be a trend to be reversed in
order for an H&S interpretation to be valid.
2. The right and left shoulders must overlap—and the
more overlap the better. If the right and left shoulders do
not overlap, then there is no H&S pattern.
3. There must be some symmetry to the shoulders in
terms of duration or height in order to validate an H&S
pattern.
A final point: I greatly prefer a flat neckline or one that slants in
the direction of the anticipated trend. I do not like upslanting
necklines in H&S tops or downslanting necklines in H&S
bottoms.
Continuation Rectangle in
Kansas City Wheat
Following a strong bear trend from March through May
2008, the market consolidated in the form of a 14-week
continuation rectangle. The completion of this rectangle in
mid-September 2008 was followed by a weak retest of the
lower boundary ice line. The market reached the target in
early December. This rectangle is shown on the weekly and
daily charts (Figure 4.9 and Figure 4.10 respectfully).
Continuation Rectangle and
Pyramid Triangle in Crude Oil
During the historic price rise in crude oil ending in 2008,
the market created a number of trading opportunities. The
advance in February completed a four-month continuation
rectangle. The hard retest in early March never closed back
below the upper boundary ice line of the rectangle. The
retesting process formed a three-week triangle that offered
the opportunity to pyramid the market. The final target was
achieved in early May (Figure 4.11).
FIGURE 4.9 Weekly Chart Displays a Continuation
Rectangle in Kansas City Wheat.
FIGURE 4.10 Daily Chart Counterpart of the Rectangle In
Kansas City Wheat.
FIGURE 4.11 A Four-Month Rectangle and Three-Week
Pennant in Crude Oil.
The breakout of the rectangle, while clean when viewed
well after the fact, was extremely tricky at the time because
of the hard retest in late March.
Continuation H&S Top in the
Dow Utilities
Figure 4.12 exhibits the continuation three-month H&S top
pattern (with a double head) that formed on the Dow
Utilities chart in July during the great bear market of 2008.
FIGURE 4.12 A Three-Month H&S Top in the Dow Utilities
Leads to the 2008 Meltdown.
Continuation Triangle,
Reversal M Top, and Flag in
the EUR/USD
Three charts are displayed for the euro/U.S. dollar
(EUR/USD).
It is not unusual for a triangle to form in the late stages of
an extended bull trend. Often, these late-stage triangles
contain six contact points contrasted with midtrend
triangles that normally contain only four contact points such
as the triangle in the Kansas City wheat (refer back to
Figure 4.10). The continuation triangle on the weekly graph
in the EUR/USD met its target quickly (Figure 4.13). Note
the six contact points of this triangle on the daily chart
(Figure 4.14). The market then formed a five-month
reversal “M” top (Figure 4.15). The new bear trend in
EUR/USD formed a 10-day flag in September. Brief
patterns such as flags and pennants offer an excellent
opportunity to pyramid a trade.
FIGURE 4.13 Weekly Chart in the EUR/USD Crossrate
Displays a Continuation Triangle and a Double (or “M”)
Top.
FIGURE 4.14 Daily Chart Shows the Three-Month Triangle
in Early 2008 in the EUR/USD Crossrate.
FIGURE 4.15 A Five-Month Double Top and Two-Week
Flag in the EUR/USD.
H&S Reversal Top and Three
Continuation Patterns in the
GBP/JPY
The weekly chart of the British pound/Japanese yen
(GBP/JPY) during 2008 had it all—a major reversal top and
a series of three bear market continuation patterns. Figure
4.16 is the weekly chart version of these chart formations. In
early January, the market completed a 13-month H&S top.
During January and February the market formed a fiveweek triangle pattern that was useful for increasing
leverage (i.e., pyramiding). From the March low through
early July a continuation rising wedge formed. As part of
the massive drop from the July high to the early 2009 low
the market formed a four-week flag, also useful for
pyramiding a short trade. The daily chart showing these
three continuation patterns is displayed in Figure 4.17.
FIGURE 4.16 Textbook Bear Market on the GBP/JPY
Weekly Chart.
FIGURE 4.17 Daily Chart of GBP/JPY Shows a Series of
Bear Market Patterns.
A Reversal Symmetrical
Triangle in the AUD/JPY
Figure 4.18 exhibits the 14-month symmetrical triangle top
completed in September 2008 on the weekly graph of the
Australian dollar/Japanese yen (AUD/JPY). Again note the
retest that occurred two weeks after the initial pattern
completion. As is almost always the case with valid pattern
breakouts, the retest was unable to make it back above the
boundary ice line. This is a very common characteristic of
major pattern completions. See Figure 4.19 for a daily
chart version of these chart events.
FIGURE 4.18 A 14-Month Symmetrical Triangle on the
AUD/JPY Weekly Chart.
FIGURE 4.19 Daily Chart of the AUD/JPY Displays the
Retest.
An additional point is worthy of note about the decline in
the AUD/JPY After building a top for 18 months, breaking
.
out, and then experiencing a minor retest, the entire move
down took only a couple of weeks. In fact, the majority of the
decline after the late September retest was represented by
a handful of days. It is a very awkward trading experience to
wait 18 months for a pattern to be completed, only to have
the move over in a matter of weeks.
Two Continuation Patterns in
GBP/CHF
The bear market of 2008 in the GBP/CHF (British pound
against the Swiss franc) provided two excellent examples
of continuation patterns Figure 4.20). The first pattern was
a seven-month continuation rounding pattern that
experienced a premature breakout in early October, a
return above the ice line, and then the valid breakout in late
October. Rounding patterns are notorious for not providing
nice, clean breakouts. An eight-week pennant or
descending triangle was completed in mid-December.
FIGURE 4.20 A Seven-Month Rounding Top Followed by
an Eight-Week Descending Triangle in the GBP/CHF.