The Fast Forward MBA in Finance_8 potx
Bạn đang xem bản rút gọn của tài liệu. Xem và tải ngay bản đầy đủ của tài liệu tại đây (264.42 KB, 23 trang )
145
SALES PRICE AND COST CHANGES
Standard Product Line
Original Scenarios (see Figure 9.1) Changes
100,000 units sold No change
Per Unit Totals Per Unit Totals
Sales revenue $100.00 $10,000,000 ($4.00) ($400,000) −4%
Cost of goods sold $
65.00 $ 6,500,000
Gross margin $ 35.00 $ 3,500,000
Revenue-driven expenses @ 8.5% $ 8.50 $ 850,000 ($0.34) ($ 34,000)
Unit-driven expenses $
6.50 $ 650,000
Contribution margin $ 20.00 $ 2,000,000 ($3.66) ($366,000) −18%
Fixed operating expenses $
10.00 $ 1,000,000
Profit $ 10.00 $ 1,000,000 ($3.66) ($366,000) −37%
Generic Product Line
150,000 units sold No change
Per Unit Totals Per Unit Totals
Sales revenue $ 75.00 $11,250,000 ($3.00) ($450,000) −4%
Cost of goods sold $
57.00 $ 8,550,000
Gross margin $ 18.00 $ 2,700,000
Revenue-driven expenses @ 4.0% $ 3.00 $ 450,000 ($0.12) ($ 18,000)
Unit-driven expenses $
5.00 $ 750,000
Contribution margin $ 10.00 $ 1,500,000 ($2.88) ($432,000) −29%
Fixed operating expenses $
3.33 $ 500,000
Profit $ 6.67 $ 1,000,000 ($2.88) ($432,000) −43%
Premier Product Line
50,000 units sold No change
Per Unit Totals Per Unit Totals
Sales revenue $150.00 $ 7,500,000 ($6.00) ($300,000) −4%
Cost of goods sold $
80.00 $ 4,000,000
Gross margin $ 70.00 $ 3,500,000
Revenue-driven expenses @ 7.5% $ 11.25 $ 562,500 ($0.45) ($ 22,500)
Unit-driven expenses $
8.75 $ 437,500
Contribution margin $ 50.00 $ 2,500,000 ($5.55) ($277,500) −11%
Fixed operating expenses $
30.00 $ 1,500,000
Profit $ 20.00 $ 1,000,000 ($5.55) ($277,500) −28%
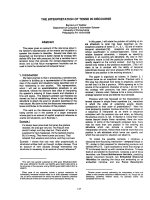
FIGURE 10.3 4 percent lower sales prices.
comparison, the 4 percent (or $3.00) sales price cut for the
generic products, net of the decrease in the revenue-driven
expenses, represents a 29 percent reduction in the unit mar-
gin on these products. For the premier products, the 4 percent
(or $6.00) price cut (net of the decrease in its revenue-driven
expenses) is only an 11 percent reduction in the unit margin.
CHANGES IN PRODUCT COST
AND OPERATING EXPENSES
In most cases, changes in sales volume and sales prices have
the biggest impact on profit performance. Product cost proba-
bly would rank as the next most critical factor for most busi-
nesses (except for service businesses that do not sell products).
A retailer needs smart, tough-nosed, sharp-pencil, aggressive
purchasing tactics to control its product costs. On the other
hand, it can be carried to an extreme.
I knew a purchasing agent (a neighbor when I lived in Cali-
fornia some years ago) who was a real tiger. For instance,
George would even return new calendars sent by vendors at
the end of the year with a note saying, “Don’t send me this
calendar; give me a lower price.” This may be overkill, though
George eventually became general manager of the business.
Even with close monitoring and relentless control, both the
variable and fixed operating expenses of a business may
increase. Salaries, rent, insurance, utility bills, and audit
and legal fees—virtually all operating expenses—are subject to
inflation. To illustrate this situation, consider the scenario in
which sales prices and sales volume remain the same but the
company’s product costs and its variable and fixed operating
expenses increase. In particular, assume that the business’s
product costs and its unit-driven variable expenses increase
10 percent. Fixed costs increase only, say, 8 percent, because
the depreciation expense component of total fixed expenses
remains unchanged. Depreciation is based on the original cost
of fixed assets and is not subject to the general inflationary
pressures on operating expenses. Revenue-driven variable
expenses, being a certain percent of sales revenue, do not
change, because in this scenario sales revenue does not
change (sales volumes and sales prices for each product line
don’t change).
Figure 10.4 presents the effects for this cost inflation
DANGER!
PROFIT AND CASH FLOW ANALYSIS
146
147
SALES PRICE AND COST CHANGES
Standard Product Line
Original Scenarios (see Figure 9.1) Changes
100,000 units sold No change
Per Unit Totals Per Unit Totals
Sales revenue $100.00 $10,000,000
Cost of goods sold $
65.00 $ 6,500,000 $6.50 $650,000 10%
Gross margin $ 35.00 $ 3,500,000
Revenue-driven expenses @ 8.5% $ 8.50 $ 850,000
Unit-driven expenses $
6.50 $ 650,000 $0.65 $ 65,000 10%
Contribution margin $ 20.00 $ 2,000,000 ($7.15) ($715,000) −36%
Fixed operating expenses $
10.00 $ 1,000,000 $0.80 $ 80,000 8%
Profit $ 10.00 $ 1,000,000 ($7.95) ($795,000) −80%
Generic Product Line
150,000 units sold No change
Per Unit Totals Per Unit Totals
Sales revenue $ 75.00 $11,250,000
Cost of goods sold $
57.00 $ 8,550,000 $5.70 $855,000 10%
Gross margin $ 18.00 $ 2,700,000
Revenue-driven expenses @ 4.0% $ 3.00 $ 450,000
Unit-driven expenses $
5.00 $ 750,000 $0.50 $ 75,000 10%
Contribution margin $ 10.00 $ 1,500,000 ($6.20) ($930,000) −62%
Fixed operating expenses $
3.33 $ 500,000 $0.27 $ 40,000 8%
Profit $ 6.67 $ 1,000,000 ($6.47) ($970,000) −97%
Premier Product Line
50,000 units sold No change
Per Unit Totals Per Unit Totals
Sales revenue $150.00 $ 7,500,000
Cost of goods sold $
80.00 $ 4,000,000 $8.00 $400,000 10%
Gross margin $ 70.00 $ 3,500,000
Revenue-driven expenses @ 7.5% $ 11.25 $ 562,500
Unit-driven expenses $
8.75 $ 437,500 $0.88 $ 43,750 10%
Contribution margin $ 50.00 $ 2,500,000 ($8.88) ($443,750) −18%
Fixed operating expenses $
30.00 $ 1,500,000 $2.40 $120,000 8%
Profit $ 20.00 $ 1,000,000 ($11.28) ($563,750) −56%
FIGURE 10.4 Higher costs.
PROFIT AND CASH FLOW ANALYSIS
148
scenario. As you can see, it’s not a pretty picture. The com-
pany could ill afford to let its product costs and operating
expenses get out of control. Virtually all (97 percent) of the
profit on the generic product line would be eliminated in this
case. The profit on the standard product line would plunge 80
percent, and the profit on the premier product line would suf-
fer 56 percent. If the cost increases could not be avoided, then
managers would have the unpleasant task of passing the cost
increases along to their customers in the form of higher sales
prices.
s
END POINT
If you had your choice, the best change is a sales price in-
crease, assuming all other profit factors remain the same. A
sales price increase yields a much better profit result than a
sales volume increase of equal magnitude. Increasing sales
volume ranks a distant second behind raising sales prices. Of
course, customers are sensitive to sales price increases, and
as a practical matter the only course of action to increase
profit may be to sell more units at the established sales prices.
Sales volume and sales prices are the two big factors driving
profit. However, cost factors cannot be ignored, of course.
The unit costs of the products sold by the business and vir-
tually all its operating costs—both variable and fixed—can
change for the worse. Such unfavorable cost shifts would
cause devastating profit impacts unless they are counterbal-
anced with prompt increases in sales prices. This and other
topics are explored in the following chapters.
11
CHAPTER
Price/Volume
Trade-Offs
R
11
Raising sales prices may very well cause sales volume to fall.
Cutting sales prices may increase sales volume—unless com-
petitors lower their prices also. Higher sales prices may be in
response to higher product costs that are passed through to
customers. Increasing product costs to improve product qual-
ity may jack up sales volume. Increasing sales commissions (a
prime revenue-driven expense) may give the sales staff just
the incentive needed to sell more units. Spending more on
fixed operating expenses—such as bigger advertising budgets,
higher rent for larger stores, or more expensive furnishings—
may help sales volume.
None of this is news to experienced business managers.
The business world is one of trade-offs among profit factors.
In most cases, a change in one profit factor causes, or is in
response to, a change in another factor.
Chapters 9 and 10 analyze profit factor changes one at a
time; the other profit factors are held constant. (To be techni-
cally correct here, I should note that sales price changes cause
revenue-driven expenses to change in proportion.) In the real
world of business, seldom can you change just one thing at a
time. This chapter analyzes the interaction of changes in two
or more profit factors.
149
SHAVING SALES PRICES TO BOOST SALES VOLUME
The example of the three profit modules introduced in Chapter
9 and carried through in Chapter 10 continues in this chapter.
Instead of the management profit report format used in the
previous two chapters, however, this chapter uses a profit
model for each product line. Figure 11.1 presents the profit
models for each product line. A profit model is essentially a
condensed version, or thumbnail sketch, of the profit reports.
Suppose the managers in charge of these three profit mod-
ules are seriously considering decreasing their sales prices
10 percent, which they predict would increase sales volume
10 percent. Of course, competitors may reduce their prices 10
percent, so the sales volume increase may not materialize. But
the managers don’t think their competitors will follow suit.
The company’s products are differentiated from the competi-
tion. (Brand names, customer service, and product specifica-
tions are types of differentiation.) There always has been
some amount of sales price spread between the business’s
products and the competition. A 10 percent price cut should
not trigger price reductions by competition, in the opinion of
the managers.
One reason for reducing sales prices is that the business is
not selling up to its full capacity. This is not unusual; many
businesses have some slack or untapped sales capacity pro-
vided by their fixed expenses. In this example, assume that
the fixed expenses of each product line provide enough space
and personnel to handle a 20 to 25 percent larger sales vol-
ume. Spreading total fixed expenses over a larger number of
units sold seems like a good idea. Rather than downsizing,
which would require cutting fixed expenses, the first thought
is to increase sales volume and thus take better advantage of
the sales capacity provided by fixed expenses.
Of course, the managers are very much aware that sales
volume may not respond to the reduction in sales price as
much as they predict. On the other hand, sales volume may
increase more than 10 percent. In any case, they would closely
monitor the reaction of customers. Obviously there is a seri-
ous risk here. Suppose sales volume doesn’t increase; they
may not be able to reverse directions quickly. The managers
may not be able to roll back the sales price decrease without
losing customers, who may forget the sales price decreases
and see the reversal only as price increases.
DANGER!
PROFIT AND CASH FLOW ANALYSIS
150
Before the managers make a final decision, wouldn’t it be a
good idea to see what would happen to profit? Managers
should run through a quick analysis of the consequences of
the sales price decision before moving ahead. Otherwise they
are operating in the dark and hoping for the best, which may
151
PRICE/VOLUME TRADE-OFFS
Standard Product Line
Sales price $100.00
Product cost $65.00
Revenue-driven expenses $8.50
Unit-driven expenses $6.50
Unit margin $20.00
Sales volume
100,000
Contribution margin $2,000,000
Fixed operating expenses $1,000,000
Profit $1,000,000
Generic Product Line
Sales price $75.00
Product cost $57.00
Revenue-driven expenses $3.00
Unit-driven expenses $5.00
Unit margin $10.00
Sales volume
150,000
Contribution margin $1,500,000
Fixed operating expenses $500,000
Profit $1,000,000
Premier Product Line
Sales price $150.00
Product cost $80.00
Revenue-driven expenses $11.25
Unit-driven expenses $8.75
Unit margin $50.00
Sales volume
50,000
Contribution margin $2,500,000
Fixed operating expenses $1,500,000
Profit $1,000,000
FIGURE 11.1 Profit models for three product lines (data from
Figure 9.1).
actually turn out to be the worst. Figure 11.2 presents the
analysis of the sales price reduction plan.
Whoops! Cutting sales prices would be nothing short of a
disaster. Assuming the sales volume predictions turn out to be
correct, the sales price reduction would push the generic prod-
uct line into the red and cause substantial profit deterioration
in the other two product lines. Why is there such a devastating
impact on profit? Why would things turn out so badly? For
each product line sales price, revenue-driven expenses and
sales volume change 10 percent. But the key change is the per-
cent decrease in unit margin for each product. For instance,
the standard product unit margin would go down a huge 46
percent, from $20.00 to $10.85 (see Figure 11.2). Thus contri-
bution margin drops 40 percent and profit drops 81 percent.
The puny 10 percent gain in sales volume is not nearly
enough to overcome the 46 percent plunge in unit margin.
You can’t give up almost half your unit contribution margin
and make it back with a 10 percent sales volume increase. In
fact, any trade-off that lowers sales price on the one side with
an equal percent increase in sales volume on the other side
pulls the rug out from under profit.
Yet frequently we see sales price reductions of 10 percent
or more. What’s going on? First of all, many sales price reduc-
tions are from list prices that no one takes seriously as the
final price—such as sticker prices on new cars. List prices are
only a point of departure for getting to the real price. Every-
one wants a discount. I’m sure you’ve heard people say, “I can
get it for you wholesale.”
The example is based on real prices, or the sales revenue
per unit actually received by the business. Can a business cut
its real sales price 10 percent and increase profit? Sales vol-
ume would have to increase much more than 10 percent,
which I explain shortly. Would trading a 10 percent sales price
cut for a 10 percent sales volume increase ever be a smart
move? It would seem not; we have settled this point in the
preceding analysis, haven’t we? Well, there is one exception
that brings out an important point.
A Special Case: Sunk Costs
Notice in Figure 11.1 that the unit costs for the products
remain the same at the lower sales price; there are no
PROFIT AND CASH FLOW ANALYSIS
152
153
PRICE/VOLUME TRADE-OFFS
Before After Change
Standard Product Line
Sales price $100.00 $90.00 −10%
Product cost $65.00 $65.00
Revenue-driven expenses $8.50 $7.65 −10%
Unit-driven expenses $6.50
$6.50
Unit margin $20.00 $10.85 −46%
Sales volume
100,000 110,000 10%
Contribution margin $2,000,000 $1,193,500 −40%
Fixed operating expenses $1,000,000
$1,000,000
Profit $1,000,000 $193,500 −81%
Generic Product Line
Sales price $75.00 $67.50 −10%
Product cost $57.00 $57.00
Revenue-driven expenses $3.00 $2.70 −10%
Unit-driven expenses $5.00
$5.00
Unit margin $10.00 $2.80 −72%
Sales volume
150,000 165,000 10%
Contribution margin $1,500,000 $462,000 −69%
Fixed operating expenses $500,000
$500,000
Profit (Loss) $1,000,000 ($38,000) −104%
Premier Product Line
Sales price $150.00 $135.00 −10%
Product cost $80.00 $80.00
Revenue-driven expenses $11.25 $10.13 −10%
Unit-driven expenses $8.75
$8.75
Unit margin $50.00 $36.12 −28%
Sales volume
50,000 55,000 10%
Contribution margin $2,500,000 $1,986,875 −21%
Fixed operating expenses $1,500,000
$1,500,000
Profit $1,000,000 $486,875 −51%
FIGURE 11.2 10 percent lower sales prices and 10 percent higher sales
volumes.
changes in the product cost per unit for the product lines. This
seems to be a reasonable assumption. To have products for
sale, the business either has to buy (or make) them at this unit
cost or, if already in inventory, has to incur this cost to replace
units sold. This is the normal situation, of course. But it may
not be true in certain unusual and nontypical cases.
A business may not replace the units sold; it may be at the
end of the product’s life cycle. For instance, the product may
be in the process of being phased out and replaced with a
newer model. In this situation the historical, original account-
ing cost of inventory becomes a sunk cost, which means that
it’s water over the dam; it can’t be reversed.
Suppose the units held in inventory will not be replaced, that
the business is at the end of the line on these units and is sell-
ing off its remaining stock. In this situation the book value of
the inventory (the recorded accounting cost) is not relevant.
What the business paid in the past for the units should be dis-
regarded.* For all practical purposes the unit product cost can
be set to zero for the units held in stock. The manager should
ignore the recorded product cost and find the highest sales
price that would move all the units out of inventory.
VOLUME NEEDED TO OFFSET SALES PRICE CUT
In analyzing sales price reductions, managers should deter-
mine just how much sales volume increase would be needed
to offset the 10 percent sales price cut. In other words, what
level of sales volume would keep contribution margin the
same? For the moment, assume that the fixed expenses would
remain the same—that the additional sales volume could be
taken on with no increase in fixed costs. The sales volumes
needed to keep profit the same for each product line are com-
puted by dividing the contribution margins of each product
PROFIT AND CASH FLOW ANALYSIS
154
*The original cost (book value) of products that will not be replaced when
sold should be written down to a lower value (possibly zero) under the
lower-of-cost-or-market (LCM) accounting rule. This write-down is based on
the probable disposable value of the products. If such products have not yet
been written down, the manager should make the accounting department
aware of this situation so that the proper accounting adjusting entry can be
recorded.
TEAMFLY
Team-Fly
®
line at the original sales prices by the unit margins at the
lower sales prices:
Product Contribution Margin ÷ Lower Unit Margin = Required Sales Volume
Standard $2,000,000 ÷ $10.85 = 184,332 units
Generic $1,500,000 ÷ $2.80 = 535,714 units
Premier $2,500,000 ÷ $36.12 = 69,204 units
Figure 11.3 summarizes the effects of these higher sales
volumes and shows that the number of units sold would have
to increase by rather large percents—from a 257 percent
increase for the generic product line to a 38 percent increase
for the premier product line. Would such large sales volume
gains be possible? Doubtful, to say the least. And to achieve
such large increases in sales volume, fixed expenses would
have to be increased, probably by quite large amounts. Also,
interest expense would increase because more debt would be
used to finance the increase in operating assets needed to
support the higher sales volume.
The moral of the story, basically, is that a 10 percent sales
price cut usually takes such a big bite out of unit contribution
margin that it would take a huge increase in sales volume to
stay even (i.e., to earn the same profit as before the price cut).
Managers should think long and hard before making sales
price reductions.
Short-Term and Limited Sales
The preceding analysis applies the sales price reduction to all
sales for the entire year. However, many sales price reductions
are limited to a relatively few items and are short-lived, per-
haps for only a day or weekend. Furthermore, the sale may
bring in customers who buy other items not on sale. Profit
margin is sacrificed on selected items to make additional sales
of other products at normal profit margins.
Indeed, many retailers seem to have some products on sale
virtually every day of the year. In this case the normal profit
margin is hard to pin down, since almost every product takes
its turn at being on sale. In short, every product may have two
profit margins—one when not on sale and one when on sale.
155
PRICE/VOLUME TRADE-OFFS
PROFIT AND CASH FLOW ANALYSIS
156
Before After Change
Standard Product Line
Sales price $100.00 $90.00 −10%
Product cost $65.00 $65.00
Revenue-driven expenses $8.50 $7.65 −10%
Unit-driven expenses $6.50
$6.50
Unit margin $20.00 $10.85 −46%
Sales volume
100,000 184,332 84%
Contribution margin $2,000,000 $2,000,000
Fixed operating expenses $1,000,000
$1,000,000
Profit $1,000,000 $1,000,000
Generic Product Line
Sales price $75.00 $67.50 −10%
Product cost $57.00 $57.00
Revenue-driven expenses $3.00 $2.70 −10%
Unit-driven expenses $5.00
$5.00
Unit margin $10.00 $2.80 −72%
Sales volume
150,000 535,714 257%
Contribution margin $1,500,000 $1,500,000
Fixed operating expenses $500,000
$500,000
Profit $1,000,000 $1,000,000
Premier Product Line
Sales price $150.00 $135.00 −10%
Product cost $80.00 $80.00
Revenue-driven expenses $11.25 $10.13 −10%
Unit-driven expenses $8.75
$8.75
Unit margin $50.00 $36.12 −28%
Sales volume
50,000 69,204 38%
Contribution margin $2,500,000 $2,500,000
Fixed operating expenses $1,500,000
$1,500,000
Profit $1,000,000 $1,000,000
FIGURE 11.3 Sales volumes needed to offset 10 percent sales price cuts.
The average profit margin for the year depends on how often
the item goes on sale.
In any case, the same basic analysis also applies to limited,
short-term sales price reductions. The manager should calcu-
late, or at least estimate, how much additional sales volume
would be needed on the sale items just to remain even with
the profit that would have been earned at normal sales
prices. Complicating the picture are sales of other products
(not on sale) that would not have been made without the
increase in sales traffic caused by the sale items. Clearly, the
additional sales made at normal profit margins are a big fac-
tor to consider, though this may be very hard to estimate with
any precision.
THINKING IN REVERSE: GIVING UP SALES
VOLUME FOR HIGHER SALES PRICES
Suppose the general managers of the three product lines are
thinking of a general 10 percent sales price increase, knowing
that sales volume probably would decrease. In fact, they pre-
dict the number of units sold will drop at least 10 percent.
Sales managers generally are very opposed to giving up any
sales volume, especially a loss of market share that could be
difficult to recapture later. Any move that decreases sales vol-
ume has to be considered very carefully. But for the moment
let’s put aside these warnings. Would a 10 percent sales price
hike be a good move if sales volume dropped only 10 percent?
The profit analysis for this trade-off is shown in Figure
11.4. However, before you look at it, what would you expect?
An increase in profit? Yes, but would you expect the profit
increases to be as large as shown in Figure 11.4? The unit
margins on each product line would increase substantially,
from 28 percent on the premier products to 72 percent on the
generic products. These explosions in unit margins would
more than offset the drop in sales volumes and would make
for dramatic increases in profit. Fixed expenses wouldn’t go
up with the decrease in sales volume. If anything, some of the
fixed operating costs possibly could be reduced at the lower
sales volume level.
The big jumps in profit reported in Figure 11.4 are based
on the prediction that sales volume would drop only 10 per-
cent. But actual sales might fall 15, 20, or even 25 percent.
157
PRICE/VOLUME TRADE-OFFS
PROFIT AND CASH FLOW ANALYSIS
158
Before After Change
Standard Product Line
Sales price $100.00 $110.00 10%
Product cost $65.00 $65.00
Revenue-driven expenses $8.50 $9.35 10%
Unit-driven expenses $6.50
$6.50
Unit margin $20.00 $29.15 46%
Sales volume
100,000 90,000 −10%
Contribution margin $2,000,000 $2,623,500 31%
Fixed operating expenses $1,000,000
$1,000,000
Profit $1,000,000 $1,623,500 62%
Generic Product Line
Sales price $75.00 $82.50 10%
Product cost $57.00 $57.00
Revenue-driven expenses $3.00 $3.30 10%
Unit-driven expenses $5.00
$5.00
Unit margin $10.00 $17.20 72%
Sales volume
150,000 135,000 −10%
Contribution margin $1,500,000 $2,322,000 55%
Fixed operating expenses $500,000
$500,000
Profit $1,000,000 $1,822,000 82%
Premier Product Line
Sales price $150.00 $165.00 10%
Product cost $80.00 $80.00
Revenue-driven expenses $11.25 $12.38 10%
Unit-driven expenses $8.75
$8.75
Unit margin $50.00 $63.87 28%
Sales volume
50,000 45,000 −10%
Contribution margin $2,500,000 $2,874,375 15%
Fixed operating expenses $1,500,000
$1,500,000
Profit $1,000,000 $1,374,375 37%
FIGURE 11.4 10 percent higher sales prices and 10 percent lower sales
volumes.
Profit can be calculated for any particular sales volume
decrease prediction, of course. No one knows how sales vol-
ume might respond to a 10 percent sales price increase. Sales
may not decrease at all. For instance, the higher prices might
enhance the prestige or upscale image of the standard prod-
ucts and attract a more upscale clientele who are quite willing
to pay the higher price. Or sales may drop more than 25 per-
cent because customers search for better prices elsewhere.
How much could sales volume fall and keep total contribu-
tion margin the same? This sales volume is computed for the
standard product line as follows:
= 68,611 units
Sales volume would have to drop more than 30 percent (from
100,000 units in the original scenario to less than 70,000
units at the higher sales prices). Sales may not drop off this
much, at least in the short run. And fixed operating expenses
probably could be reduced at the lower sales volume level.
Given a choice, my guess is that the large majority of busi-
ness managers would prefer keeping their market share and
not giving up any sales volume, even though profit could be
maximized with higher sales prices and lower sales volumes.
Protecting sales volume and market share is deeply ingrained
in the thinking of most business managers.
Any loss of market share is taken very seriously. By and
large, you’ll find that successful companies have built their
success on getting and keeping a significant market share so
that they are a major player and dominant force in the mar-
ketplace.
True, some companies don’t have a very large market
share—they carve out a relatively small niche and build their
business on low sales volume at premium prices. The preced-
ing analysis for the premier product line demonstrates the
profit potential of this niche strategy, which is built on higher
unit margins that more than make up for smaller sales vol-
ume.
s
END POINT
Seldom does one profit factor change without changing or
being changed by one or more other profit factors. The inter-
$2,000,000 contribution margin target
ᎏᎏᎏᎏᎏ
$29.15 higher unit margin
159
PRICE/VOLUME TRADE-OFFS
action effects of the changes should be carefully analyzed
before making final decisions or locking into a course of
action that might be difficult to reverse. Managers should keep
their attention riveted on unit margin. Profit performance is
most responsive to changes in the unit margin.
Basically, there are only two ways to improve unit margin:
(1) increase sales price or (2) decrease product cost and/or
other variable operating expenses per unit (see Chapter 12).
The sales price is the most external or visible part of the
business—the factor most exposed to customer reaction. In
contrast, product cost and variable expenses are more inter-
nal and invisible. Customers may not be aware of decreased
expenses unless such cost savings show up in lower product
quality or worse service.
Last, the importance of protecting sales volume and market
share is mentioned in the chapter. Marketing managers know
what they’re talking about on this point, that’s for sure.
Recapturing lost market share is not easy. Once gone, cus-
tomers may never return.
PROFIT AND CASH FLOW ANALYSIS
160
12
CHAPTER
Cost/Volume
Trade-Offs and
Survival Analysis
I
12
It might seem simple enough. Suppose your unit product cost
goes up. Then all you have to do is to raise sales price by the
same amount to keep the contribution margin the same, true?
Not exactly. Sales volume might be affected by the higher
price, of course. Even if sales volume remained the same, the
higher sales price causes revenue-driven expenses to increase.
So it’s more complicated than it might first appear.
PRODUCT COST INCREASES: WHICH KIND?
There are two quite different reasons for product cost
increases. First is inflation, which can be of two sorts. General
inflation is widespread and drives up costs throughout the
economy, including those of the products sold by the business.
Or inflation may be localized on particular products—for
example, problems in the Middle East may drive up oil and
other energy costs; floods in the Midwest may affect corn and
soybean prices. In either situation, the product is the same
but now costs more per unit.
The second reason for higher product costs is quite differ-
ent than inflation. Increases in unit product costs may reflect
either quality or size improvements. In this situation the prod-
uct itself is changed for the better. Customers may be willing
to pay more for the improved product, with the result that the
161
company would not suffer a decrease in sales volume. Or, if
the sales price remains the same on the improved product,
then sales volume may increase.
Customers tend to accept higher sales prices if they per-
ceive that the company is operating in a general inflationary
market environment, when everything is going up. On a com-
parative basis, the product does not cost more relative to price
increases of other products they purchase. Sales volume may
not be affected by higher sales prices in a market dominated
by the inflation mentality. On the other hand, if customers’
incomes are not rising in proportion to sales price increases,
demand would likely decrease at the higher sales prices.
If competitors face the same general inflation of product
costs, the company’s sales volume may not suffer from pass-
ing along product cost increases in the form of higher sales
prices because the competition would be doing the same
thing. The exact demand sensitivity to sales price increases
cannot be known except in hindsight. Even then, it’s difficult
to know for sure, because many factors change simultane-
ously in the real world.
Whenever sales prices are increased due to increases in prod-
uct costs—whether because of general or specific inflation or
product improvements—managers cannot simply tack on the
product cost increase to sales price. They should carefully
take into account variable expenses that are dependent on
(driven by) sales revenue.
To illustrate this point, consider the standard product line
example from previous chapters. The sales price and per-unit
costs for the product are as follows (from Figure 9.1).
PROFIT AND CASH FLOW ANALYSIS
162
Standard Product
Sales price $100.00
Product cost $ 65.00
Revenue-driven expenses @ 8.5% $ 8.50
Unit-driven expenses $
6.50
Unit margin $ 20.00
Suppose, for instance, that the company’s unit product cost
goes up $9.15, from $65.00 to $74.15 per unit. (This is a
rather large jump in cost, of course.) The manager shouldn’t
simply raise the sales price by $9.15. In the example, the
revenue-driven variable operating expenses are 8.5 percent
of sales revenue. So the necessary increase in the sales price
is determined as follows:
= $10.00 sales price increase
Dividing by 0.915 recognizes that only 91.5 cents of a sales
dollar is left over after deducting revenue-driven variable
expenses, which equal 8.5 cents of the sales dollar. Only 91.5
cents on the dollar is available to provide for the increase in
the unit product cost. If the business raises its sales price
exactly $10.00 (from $100.00 to $110.00), the unit margin for
the standard product would remain exactly the same, which is
shown as follows:
$9.15 product cost increase
ᎏᎏᎏᎏ
0.915
163
COST/VOLUME TRADE-OFFS
Standard Product Sales Price for Higher Product Cost
Sales price $110.00
Product cost $ 74.15
Revenue-driven expenses @ 8.5% $ 9.35
Unit-driven expenses $
6.50
Unit margin $ 20.00
Therefore the company’s total contribution margin would
be the same at the $110.00 sales price, assuming sales vol-
ume remains the same, of course.
VARIABLE COST INCREASES AND SALES VOLUME
As just mentioned, one basic type of product cost increase
occurs when the product itself is improved. These quality
improvements may be part of the marketing strategy to stim-
ulate demand by giving customers a better product at the
same sales price. In addition to product cost, one or more of
the specific variable operating expenses could be deliber-
ately increased to improve the quality of the service to cus-
tomers.
For example, faster delivery methods such as overnight
Federal Express could be used, even though this would cost
more than the traditional delivery methods. This would
increase the volume-driven expense. The company could
increase sales commissions to improve the personal time and
effort the sales staff spends with each customer, which would
increase the revenue-driven expense.
In our example, suppose the general manager of the stan-
dard product line is considering a new strategy for product
and service quality improvements that would increase product
cost and unit-driven operating expenses 4 percent. Revenue-
driven variable expenses would be kept the same, or 8.5 per-
cent of sales revenue. Tentatively, she has decided not to
increase sales prices because in her opinion the improved
products and service would stimulate demand for these prod-
ucts. It goes without saying that customers would have to be
aware of and convinced that the product has improved.
Before making a final decision, she asks the critical question:
What increase in sales volume would be necessary just to
keep profit the same?
Figure 12.1 presents this even-up, or standstill, scenario
in which product cost and unit-driven variable expenses
increase 4 percent but sales price remains the same. Fixed
expenses are held constant, as is the variable revenue-driven
operating expenses. Sales volume would have to increase
16,686 units, or 16.7 percent. By the way, the required sales
PROFIT AND CASH FLOW ANALYSIS
164
Standard Product Line
Before After Change
Sales price $100.00 $100.00
Product cost $65.00 $67.60 4.0%
Revenue-driven expenses $8.50 $8.50
Unit-driven expenses $6.50
$6.76 4.0%
Unit margin $20.00 $17.14 −14.3%
Sales volume
100,000 116,686 16.7%
Contribution margin $2,000,000 $2,000,000
Fixed operating expenses $1,000,000
$1,000,000
Profit $1,000,000 $1,000,000
FIGURE 12.1 Sales volume required for a 4 percent cost increase.
TEAMFLY
Team-Fly
®
volume for this scenario of higher cost and lower unit margin
can be computed directly as follows:
Required Sales Volume at Higher Costs
= 116,686 sales volume
The relatively large increase in sales volume needed to offset
the relatively minor 4 percent cost increase is because the cost
increase causes a 14.3 percent drop in unit margin. So a 16.7
percent jump in sales volume would be needed to keep profit
at the same level. The key point is the drop in the unit margin
caused by the cost increase. It takes a large increase in sales
volume to make up for the drop in the unit margin.
There is more bad news. More capital would be needed at
the higher sales volume level; the capital invested in assets
would be higher due mainly to increases in accounts receiv-
able and inventory. The impact on cash flow at the higher
sales volume level is explained in Chapter 13.
BETTER PRODUCT AND SERVICE PERMITTING
HIGHER SALES PRICE
The alternative to selling more units to overcome the cost
increases is to sell the same number of units at a higher sales
price. Figure 12.2 presents the higher sales price that would
keep profit the same as before, given the 4 percent higher
product cost and 4 percent higher unit-driven variable
expenses. In this scenario the cost increase is loaded into the
sales price and is not reflected in a sales volume increase.
Following this strategy, the sales price would be increased
to $103.13 (rounded).* In this case the business improved the
product and the service to its customers. There is no increase
in profit. This product upgrade would be customer-driven—if
$2,000,000 contribution margin target
ᎏᎏᎏᎏᎏ
$17.14 lower unit margin
165
COST/VOLUME TRADE-OFFS
*The required sales price is computed as follows: ($67.60 product cost +
$6.76 unit-driven cost + $20.00 unit margin) ÷ (1.000 − 0.085) = $103.13
sales price (rounded). In other words, the sales price, net of the revenue-
driven cost per unit as a percent of sales price, must cover the product cost
and the sales volume–driven expense per unit and provide the same unit
margin as before.
the company failed to improve its product and/or service, then
it might lose sales, because the customers want the improve-
ments and are willing to pay. This may seem to be a strange
state of affairs, but you see examples every day where the cus-
tomer wants a better product and/or service and is willing to
pay more for the improvements.
LOWER COSTS: THE GOOD AND BAD
Suppose a business were able to lower its unit product costs
and its variable expenses per unit. On the one hand, such cost
savings could be true efficiency or productivity gains. Sharper
bargaining may reduce purchase costs, for example, or better
manufacturing methods may reduce labor cost per unit pro-
duced. Wasteful fixed overhead costs could be eliminated or
slashed. The key question is whether the company’s products
remain the same, whether the products’ perceived quality
remains the same, and whether the quality of service to cus-
tomers remains the same.
Maybe not. Product cost decreases may represent quality
degradations, or possibly reduced sizes such as smaller candy
bars or fewer ounces in breakfast cereal boxes. Reducing vari-
able operating expenses may adversely affect the quality of
service to customers—for instance, by spreading fewer per-
sonnel over the same number of customers.
PROFIT AND CASH FLOW ANALYSIS
166
Standard Product Line
Before After Change
Sales price $100.00 $103.13 3.1%
Product cost $65.00 $67.60 4.0%
Revenue-driven expenses $8.50 $8.77
Unit-driven expenses $6.50
$6.76 4.0%
Unit margin $20.00 $20.00
Sales volume
100,000 100,000
Contribution margin $2,000,000 $2,000,000
Fixed operating expenses $1,000,000
$1,000,000
Profit $1,000,000 $1,000,000
FIGURE 12.2 Higher sales price required for a 4 percent cost increase
Lower Costs and Higher Unit Margin
If the company can lower its costs and still deliver the same
product and the same quality of service, then sales volume
should not be affected (everything else remaining the same, of
course). Customers should see no differences in the products
or service. In this case the cost savings would improve unit
margins and profit would increase accordingly.
Improvements in the unit margins are very powerful; these
increases have the same type of multiplier effect as the oper-
ating leverage of selling more units. For example, suppose
that because of true efficiency gains the business is able to
lower product costs and unit-driven expenses such that unit
margin on its standard product line is improved, say, $1.00
per unit. Now this may not seem like much, but remember
that the business sells 100,000 units during the year.
Therefore, the $1.00 improvement in unit margin would
add $100,000 to the contribution margin line, which is a 5
percent gain on its original $2 million contribution margin.
Lowering product cost and the unit-driven operating costs
should not cause fixed costs to change, so all of the $100,000
contribution margin gain would fall to profit. The $100,000
gain in profit is a 10 percent increase on the $1 million origi-
nal profit, or double the 5 percent gain in contribution margin.
Total quality management (TQM) is getting a lot of press
today, indicated by the fact that it has been reduced to an
acronym. Clearly, managers have always known that product
quality and quality of service to customers are absolutely criti-
cal factors, though perhaps they lost sight of this in pursuit of
short-term profits. Today, however, managers obviously have
been made acutely aware of how quality conscious customers
are (though I find it surprising that today’s gurus are preach-
ing this gospel as if it were just discovered).
Lower Costs Causing Lower Sales Volume
Cost savings may cause degradation in the quality of the prod-
uct or service to customers. It would be no surprise, therefore,
if sales volume would decrease. The unit margin would
improve, but sales volume may drop as some customers aban-
don the business because of poorer product quality. Still, a
business might adopt the strategy of deliberately knocking
down the quality of its products (or some of its products) and
167
COST/VOLUME TRADE-OFFS