Forex on Five Hours a Week: How to Make Money Trading on Your Own Time _3 ppt
Bạn đang xem bản rút gọn của tài liệu. Xem và tải ngay bản đầy đủ của tài liệu tại đây (467.46 KB, 22 trang )
P1: OTA
c03 JWBT185-Horner October 24, 2009 15:12 Printer: Yet to come
The Wave 29
but definitely not least, getting a correct and consistent reading of the Wave
clock angle on each time frame. Let’s discuss the importance of how you
determine what you look at on your chart. Now this is the first time we’re
actually discussing charting. Before now it’s been mainly trends and rela-
tionships, but here we are going to start getting very detailed about chart
set-up because, after all, this is how you are going to interpret price action
and understand the market’s movement.
One of the reasons you and I have spent so much time discussing con-
cepts is because without this foundation there will come a time that you
may abandon these methods because you quite simply don’t understand
why you were doing it this way in the first place. I think the only way I can
prepare you for the rigors of the market is to teach you the why and the
how. All instruction without concept is simply going through the motions.
I need you to understand why you are doing your analysis in a particular
way so that when things get tough you can stand firm knowing that there
is a reason for the approach, and moreover you will have more confidence.
Most traders simply adopt a methodology because they learned it some-
where and likely from a source they had some trust in. But it’s not enough
for you to have trust in what I am teaching or that I know what I am doing.
If you cannot do this on your own, what’s the point? You need to have trust
in the instruction as much as the instructor.
Market memory is related in many ways to my not using multiple time
frame confirmation. Most traders rely upon looking at many time frames so
that they can identify key support and resistance levels. If I were to ask you
right now to look at a chart, any time frame you wish, how would you de-
termine how much data you would include in the chart? For most traders,
this is completely random or determined by what is comfortable to look
at, which again is completely random. The problem with this is that with-
out an understanding of how much price action to view on a specific time
frame, you are likely to miss relevant levels and move and totally misread
the market’s current cycle.
So you might ask, What’s the problem with looking at multiple time
frames? Well, first of all you should know by now that each time frame
could and probably is moving at a different market cycle. Second, what is
support on the 30 minute chart may not even register as support on a 180 or
240 minute chart. Third, and this is the main reason, it opens up a Pandora’s
Box of allowing you to begin looking for reasons to stay in a losing trade. If
a 30 minute chart moves against you, it’s just too easy to jump to the 60 or
the 240 or even the daily time frame to justify your position. I’ve seen it far
too often. If you set-up a chart on the 60 minute time frame, you manage
it from the 60 minute time frame. The only way you can do that is to make
sure you are looking at and making your analysis from a complete market
memory.
P1: OTA
c03 JWBT185-Horner October 24, 2009 15:12 Printer: Yet to come
30 FOREX ON FIVE HOURS A WEEK
Each time frame has a specific market memory. The reason is that
short-term time literally have short term memories, while longer time
frames, like the 240 minute or the daily (also known as the end-of-day
chart), require more data to make a decision because monthly and yearly
high and lows matter. This is partly due to the number of candles you get
per day on different time frames. We already discussed the brick-by-brick
approach to time frames so you already understand the number of candles
we get per day. To make a decision on a longer-term time frame, I am sim-
ply going to need more calendar days to generate a sufficient number of
candles on the chart in order to see significant highs, lows, rallies, sell-offs,
support, and resistance. But what is sufficient?
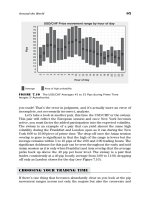
I began asking myself the same question years ago and started see-
ing some obvious clues in the way specific time frames respected certain
price levels, depending upon how long ago the level was established. I was
mainly interested in how far back I could go and whether or not traders
reacted to older highs or lows. I began to see that each time frame had a
general “memory,” which is basically a limit to how far back support and
resistance would be respected. The easiest to figure out was the daily.
Traders are very aware of 52-week highs and lows, and this not only
allowed me to determine that the market memory for a daily chart was
one year, it also made it very clear that these 52-week highs and lows were
psychological levels. So for a daily chart, you need one year of price action
on your chart. It is also in this view, the complete market memory, that you
will take your clock angle reading of the Wave.
Reading the Wave can be subjective if you do not look at the clock an-
gle within a specific amount of data. The X axis (horizontal) and the Y axis
(vertical) are affected by your charting platform. Most charting platforms
will try to automatically squeeze in the closest recent high and low from
the current price. This “auto scaling” means that you will not have com-
plete control of how much data is on your chart, but we’re not looking for
nor do we need that much accuracy. In fact, market memory is really de-
signed to be more of a guideline to keep a trader from putting “too much”
or “too little” price action on a chart.
If you were to expand the horizontal or X axis of your chart you would
also be flattening out the angle of the Wave. Squeeze in too much on the
X axis and you could and will most likely artificially steepen the Wave.
So, yes, market memory as applied to the clock angle of the Wave is very
important.
For the 30 and 60 minute charts, the market memory is two weeks. This
two-week view will represent the significant highs and lows as they pertain
to the 30 and 60 minute chart. By the way, even though we haven’t yet dis-
cussed it, there are other very easily identified levels called “psychological
levels” that are observed beyond that of what is included in the market
P1: OTA
c03 JWBT185-Horner October 24, 2009 15:12 Printer: Yet to come
The Wave 31
memory, and we’ll talk about those shortly. And I know I mentioned this
already, but if you cannot fit two weeks exactly into your chart view, you
can simply err on the side of slightly more rather than slightly less.
Since I trade the 30 minute, 60, 180, 240, and daily charts, those are the
market memory settings I will get into detail here. But you can apply this
psychology to any time frame so I will also include a few other settings
on some popular requests that I get. The 180 and 240 minute charts should
include a look back of no less than one month. With these two time frames
I have no problem with going out as far as 8 to 10 weeks although one
month/four weeks will be absolutely fine and effective. Personally, due to
the way my charts typically compress on my charting platform, I am usually
looking at four to six weeks.
The most popular requests I get for alternate time frames are the 5 and
10 minute, 120 minute, and weekly. For the 5 and 10 minute time frames,
work with a 3 to 5-day market memory. For the 120, use the same settings
as the 180 and 240 minute charts. Finally, for the weekly, which actually
I do refer to for big picture trades and significant longer-term highs and
lows, it’s a five-year market memory.
So let’s review because I’ve thrown a lot at you here. The main reasons
for using market memory is to make sure you are looking at the most rel-
evant price action and reading the Wave for the most accurate clock angle
reading. When it comes to Forex in Five trading, the chart set-up, making
sure you are looking at price action in its proper perspective, will add up
to quicker and more importantly, more accurate analysis.
TRADE WITH PRICE
If it isn’t already obvious, I want you to rely on price and price action to
make your trading decisions. This isn’t because I don’t respect fundamen-
tals or data—in fact I do—but they are not reliable when it comes to market
timing (your entry) and market direction. This is due primarily to the way
news filters through the market and is discounted. Discounting is the pro-
cess by which news and data is factored into the market, often well ahead
of the actual information or data that is released or confirmed. The mar-
kets are always forward looking. This means that what traders think may
happen is what moves the market.
One simple way of seeing this at work is looking at data releases and
the way market participants factor in the forecast or consensus of a report
and the way they react to the actual data. So it’s not enough to simply see
that a news event has beat or missed expectations (the consensus). You
must also factor in to what degree the number beat or missed its mark and
P1: OTA
c03 JWBT185-Horner October 24, 2009 15:12 Printer: Yet to come
32 FOREX ON FIVE HOURS A WEEK
also know beforehand how much the consensus was discounted into the
market. The very act of trading news requires that you understand price
action. You will notice with frequency that “good data” can make a market
sell-off and “bad data” can make a market rally. Again, the data is not com-
pared month to month, or whether the number was positive or negative,
but rather it’s compared to what traders expected the number would be.
So is trading news and fundamentals a level playing field? Heck, I forget if
it is level or not it’s hard enough to even find the field itself!
Another factor that makes fundamental analysis unrealistic for not just
Forex in Five trading but for most traders is that it is time consuming to
gather and analyze the data, all the while knowing that you may not even
have the complete picture, or all the data, or even the correct data. Then
you must take the last step and determine how much of what data is already
factored into price. And I’m not overcomplicating this. This is the process.
Instead do what I do, focus on two numbers, the consensus, which is what
is most widely baked into the cake (discounted), and the actual, which
you’ll find out when everyone else does. This brings up another issue with
trading news, the order entry. I will go into detail about order entry in the
next chapter, but I want to mention here a few salient facts.
Let’s be realistic. I am not some hotshot trader at a bank or a pit trader
with instant access to the market. I am a home office–based, private trader.
I can’t trade as anything but that. Nor should I try. I am not privy to all
the latest market intelligence, and I can’t delude myself into thinking that
I know something that the market doesn’t. Order entry during economic
news releases is insane at best and stupid at worst. Order entry platforms
have a terribly inconvenient tendency to freeze during these volatile times.
Spreads widen, the market jumps. I don’t want to be in the mix during
these times but I can still take advantage of trading the moves that are
generated during releases. You see the follow-through may come from the
release itself, but more often than not, you will have an opportunity to set-
up and enter a market in advance of the release—if you watch price action,
that is. It’s not that common really for prices to make sharp reversals from
economic releases. More often the data simply hits the accelerator in the
current direction. Weak gets weaker, strong gets stronger.
Are there advantages to being a small trader? Sure. I am nimble, and
the market won’t see my trade size coming. Frankly, it doesn’t care. I can
watch the big boys make the moves, and I can react to them knowing that
the moves they make are large. I can move under the radar, in and out, and
do it all over again. Why have I relied on trading price? It’s the only level
playing field, and there’s just too much news and fundamentals out there
to paint a complete picture and act on it with confidence. I’m never going
to know everything, although I try to convince my husband that I do.
P1: OTA
c04 JWBT185-Horner October 24, 2009 15:18 Printer: Yet to come
CHAPTER 4
Objectivity
Tame the market or it will eat you alive!
2006 “Fxstreet.com. The Forex Market.” All Rights Reserved.
O
bjectivity is at the heart of Forex in Five trading. It is through the
use of trading tools and studies that require little to no interpreta-
tion that we can make fast decisions and have confidence in them.
In my experience, far too many trading tools and approaches are subjective
in nature. By the way, you’ve already learned to eliminate the largest prob-
lem in subjectivity. You know what that is? Market cycles! Is the market
moving up, down, or sideways? That distinction alone can make the dif-
ference in your current trading. If you did nothing else but figure out what
cycle your current strategy was designed to trade, and then go about using
33
P1: OTA
c04 JWBT185-Horner October 24, 2009 15:18 Printer: Yet to come
34 FOREX ON FIVE HOURS A WEEK
that strategy in the appropriate market cycle, you would make a profound
improvement in your trading with that one adjustment.
For most traders, their selection of a trading entry is what I call canned.
They simply memorize some steps and apply it to the market irrespective of
the underlying market cycle. The market seldom sets-up a trade the same
way all the time. There are nuances, slight differences, which can often
make one version of a set-up look different from another. Most books and
educators unfortunately focus on the well-chosen example: that one text-
book example of the strategy at work. So now you go looking for that one
because that’s all your eyes know to look for.
It all reminds me of when I first began teaching. I would teach for in-
stance, a triangle pattern to the group. The next session when we sat down
to analyze the markets, all they would see would be triangles. That’s the
only frame of reference they had, or it was the one that was the freshest
in their minds, so that’s what they would look for. Funny thing about the
human mind, it may be powerful, but it’s not necessarily smart. If you ask
it a question, whether it knows the answer or not, it will give you a reply.
“Hey, let me ask you, why are you such a terrible trader?” Tell me now, and
your brain is probably firing off one ridiculous reason after another. That’s
what it does. And you know what’s worse? You may not even be a terrible
trader, but since that’s what your question assumes, that’s what your brain
will respond to. It’s difficult enough to trade and deal with market psychol-
ogy, but now I’m telling you that you’re going to have to deal with what I
endearingly call the “pig in the head.” Don’t ask the pig much, which will
keep it quiet, and trust what your eyes see on the chart.
The more subjective or open to interpretation a trading tool is, the
more the pig in the head will get involved. Subjective tools invite doubt and
they are time consuming, yet most market analysis methods are subjective.
Do you think fundamentals are objective? For every piece of bullish data
or news you find, I can find you a piece of bearish data or news. Where’s
the objectivity there?
INDICATORS
How about indicators? I remember a trader long ago trying to explain his
stochastic entry methodology to me. First it was based primarily on the
indicator itself and not price (first warning!), and it was reliant upon my
learning to recognize this squiggle of a move on the indicators lines (second
warning!). Okay, I thought, he’s well intentioned, and this shouldn’t take
too long. He showed me a few examples, told me it was really easy (third
warning!), and off I went to try and put this to work.
P1: OTA
c04 JWBT185-Horner October 24, 2009 15:18 Printer: Yet to come
Objectivity 35
I thought I had found a few good instances where the stochastic squig-
gled in the right way. So I clicked off a few demo trades. It didn’t work,
which is to say the trade was a loser. But I know that a losing trade is not
indicative of a methodology not working. Nothing wins all of the time. So
I did it again, and again, and again. It still couldn’t seem to generate the
entries as he had described, so consequently I would wander back over to
his station only to see that he was up! All the “wrong” triggers I took were
none of the ones that he took.
“What gives?” I asked. “I did it just like you told me to with this little
squiggle here.”
“Oh well, you see your trigger didn’t squiggle like this ,” and he pro-
ceeded to show me his squiggle triggers.
“They look the same to me,” I replied.
“No, no, no, yours crossed like this but mine crossed like this.”
This is subjectivity. I’m not saying his stochastic squiggle trigger did
not work (but I will add that after the stock market boom of the late 1990s
and early 2000s ended, so did his run as a daytrader), but I could not repli-
cate it. I couldn’t see it the way he did. Darn subjectivity.
What good would it be if I showed you a bunch of strategies, and you
couldn’t recognize them for yourself, by yourself? I’d be wasting both our
time. Since I am both a trader and a teacher, objective tools are a must
because that’s the only way I can be sure that there is a high likelihood that
you will see what I am seeing! The reason so many traders lose more than
they win is that most tools set them up for failure due to the fact that
there are too many nuances in interpretation and the market just does
not set-up the exact same way time after time.
ORDER ENTRY
I think there is too much and not enough discussion of order entry. I can
and have talked about the mechanics of entering a buy or sell order with
limits, stops, or at the market. Mechanics and definitions don’t do the art
of order entry enough justice because they make it seem flat and lifeless.
In reality order entry is dynamic.
I have seen over the years that most traders use market orders. This
is the “get me in” or “get me out” now order. A market order in the wrong
hands and if overused is not unlike the lever on the slot machine in Las
Vegas. It’s the impulse buy while checking out at the grocery store. The
psychology behind the most common use of market orders is little planning
and even less trade and risk management. Now I am not saying that all
market orders are somehow misguided, but it’s usually only very skilled
and disciplined traders that should use this order type with any frequency.
P1: OTA
c04 JWBT185-Horner October 24, 2009 15:18 Printer: Yet to come
36 FOREX ON FIVE HOURS A WEEK
If a trade is planned ahead of time, before price triggers an entry, then
it should be logical that if the trade is preconfirmed a few orders can be
“parked” in the market. When I say “parked,” I am referring to pending
orders such as limits and stops. These orders can be placed well ahead
of time and handle the trade entry, risk-based stop loss, and initial profit
target.
I don’t think at this point we need another discussion of what stop,
limit, and market orders are. I think the main issue is why and how we
place these orders. In fact, it’s really more about the job each one of these
orders has. We only have three order types, but which we use has more to
do with how we want to communicate our wishes to the market.
STOP LOSS
Let’s examine stop losses. First, there is really no such order as a “stop
loss.” We’ve called it that because stop orders are most commonly used
in this protective manner, but they are still simply “stop” orders. There
are three types of stop losses we will want to use at different stages of a
trade. They are all going to be stop orders, but the thinking behind each
stop (stop loss) order placement will be different. The initial stop we place
when entering a trade is known most often as the protective stop loss. This
stop loss represents the potential for loss. It’s a risk-based stop, and it’s
placed where the trade would no longer be valid. The risk-based stop is the
opposite of the entry. If an entry is the reason to get in, then the point of
validity/risk-based stop is the reason to get out.
The risk-based stop is the one we all hope we will have the discipline
to place and not have to use. Transitioning from a risk-based stop to a
breakeven stop is done only when the trade moves in our favor and to the
first stop loss. It should become clear right about now that using support
and resistance to place stop loss and profit targets is important because a
market moves from level to level seeking support and resistance. The way
you place your profit target, the thinking behind their location, is what will
set your risk management in motion. This is lost on far too many traders.
This is how far too many traders let a winner turn into a loser. How do we
define a winner? It’s a trade that has reached the first of hopefully two to
four more profit targets. How do you manage two to four profit targets?
That is done with multiple lots.
Once prices reach the first profit target, the trade is officially a “winner”
and should be protected from a reversal that could happen when prices
reach the support or resistance that was the profit target. This is a possible
scenario when prices reach any kind of support or resistance, and since
P1: OTA
c04 JWBT185-Horner October 24, 2009 15:18 Printer: Yet to come
Objectivity 37
just about any order you place will be because of the support or resistance
it has, then there is the possibility of either a continuation through this level
or a reversal.
The psychological trade many traders fall into here is trailing their stop
too aggressively. This is usually because they have experienced so many
losers during the early part of their trading and learning curve that the
slightest profit triggers a fear reaction: I have to take this profit now! Many
times the traps that most of us have to navigate through can be avoided
with order entry that lets us observe the market rather than being involved
with it too hands on once the trade goes live. There is too much temptation,
fear, and greed, and the only way we can avoid and manage these emotions
is with order entry.
First of all, the only way a trade should and can be extended past the
first profit target is to have multiple lots. One lot equals one profit target.
A breakeven stop allows for enough wiggles (the typical amount of volatil-
ity) that a position must be given in order to compensate for corrections
along the way to the next profit target. Trailing stops are most often and
incorrectly done by using some sort of fixed pip or percentage. I’ve already
explained why stop losses should not be placed with this type of thinking,
and the same thing applies to every kind of stop. Trailing a stop is done as
a trade moves in the direction we expected it to and reaches profit targets,
which then in turn trigger the transition from risk-based to breakeven to
finally trailing stop.
A breakeven stop, as the name implies, is where the trade would be
stopped out and yield no loss or gain. It’s placed either just below the en-
try price if the entry is a buy or just above the entry price in a short. The
breakeven should be just beyond the entry as to be able to get maximum
use out of the support or resistance that triggered the entry. As a trade
progresses, if it progresses, the trailing stop is next.
Trailing stops are what we all love because they mean that no matter
what, the exit is still a profitable one. But they should not be placed with
fixed levels that trail current prices. The same levels that were once profit
targets are now going to be valuable levels of support and resistance that
the trailing stops will be placed at. Here’s how it works. On the chart there
are multiple levels that the trade could travel to as it moves in the profitable
direction and these levels are resistance in a buy and support in a short.
Remember that what was once support becomes resistance and vice versa,
so that now we are looking at a set of levels that can support prices in an
uptrend and be a ceiling in a downtrend. This is exactly what we need for
trailing stops.
The stop order itself should not be placed at the profit target level ex-
actly but just beyond. So that means that in a buy, the resistance levels that
were once profit targets are now support and trailing stop levels. Place the
P1: OTA
c04 JWBT185-Horner October 24, 2009 15:18 Printer: Yet to come
38 FOREX ON FIVE HOURS A WEEK
stop order just below the support level. In a short it’s the support of profit
targets that have become resistance so the stop order will be placed just
above that level. How much above? Three to five pips to account for the
spread will do.
RISK MANAGEMENT
So you can see that under the overarching idea of trade management is
risk management. Risk management is your risk-based stop and breakeven
stop. Once you are in the inevitable position to make the happy transi-
tion to a trailing stop, the trade technically should no longer be in a risk
scenario.
I started with risk management because it’s the side of the trade that
no one really likes to consider; it’s the order we hope not to see filled. The
profit side of the trade, the reward, is just as important, however, to risk
management because it’s where we define a winner that initiates the stop
loss order progression. Improper placement of a profit target will delay or
incorrectly trigger the risk management orders, and the trade could be han-
dled poorly as a result. Profit target placement is not difficult because like
every aspect of the trade, set-up is determined by support and resistance.
Before we get into limit orders and profit targets, we first need to discuss
the risk-to-reward ratio.
The risk-to-reward ratio is the consideration of how much we are risk-
ing in order to potentially gain from our trade. We all would like to risk a
little and gain a lot. That’s human nature: risk averse and greedy. Once we
acknowledge that we cannot effectively trade with that behavior, we can
examine how to really determine the risk/reward of a trade. First of all,
you probably are already familiar or even perhaps using a fixed pip or per-
centage. This is an erroneous risk management strategy because it ignores
the support, resistance and pip movement particular to the time frame we
are trading and the current market environment. The idea that we can ran-
domly pick a 1:4 risk-to-reward ratio simply because that is our tolerance
implies that a trade is simply a throw of the dice. If that’s the case, then
why analyze anything? Play the odds, and enter wherever you wish!
Risk/reward ratios, like everything else in trading, are a matter of sup-
port and resistance. If you are buying (going long), your risk is your entry
to your risk-based stop loss (support), and your reward is your entry to
your initial profit target (resistance). Calculate those levels, and you have
a true representation of the risk/reward ratio before you enter the trade. If
you use (for example) a 1:4 ratio, then that means the placement of the stop
and profit target are not based upon support, resistance, or price action at
all. Instead it is driven by the desire to risk little and gain a lot.
P1: OTA
c04 JWBT185-Horner October 24, 2009 15:18 Printer: Yet to come
Objectivity 39
If you ask most traders they will tell you that 1:2 risk-to-reward ratios
are a gift because most of the time, if you are using price as the measur-
ing tool, a 1:1 is normal. Upwards of 1:2 is fantasy and likely derived from
completely ignoring the support and resistance price action it is actually
pointing to. Most of my traders are 1:1 or 1:1.5. I can hardly recall a 1:2 in
recent memory. And while it sounds good to say I am risking “1” in order
to make “4,” it does not pan out when analyzing the price action.
Limit also known as “or better” orders will be used to execute profit
targets. A limit order will simply wait for prices to reach the level and then
execute at the price designated and or better. Stop orders can also be used
as a profit target order since both are “pending” orders that lie dormant
until the price designated in the order is hit.
There are some considerations when placing a limit or stop order, and
the first is psychological levels. At all times you must have a good feel for
where current prices are in relation to the “00” and “50” levels, which are
major psychological numbers. Orders congregate at these levels creating
strong and significant support or resistance. Important but secondary to
the major psychological numbers are the “20” and “80” levels, which are
minor psychological levels. When entering a trade, look to see if any of
these levels—most especially the “00”—are nearby. If you are buying below
a “00,” you are essentially buying below a ceiling, and that’s not ideal. Wait
until prices can pierce this level and the mass of orders that are waiting
there. By doing this you will accomplish two things: (1) you will be able to
buy above a ceiling, and (2) the break of the “00” could very well propel
prices higher.
In the case of using a psychological level to your advantage when plac-
ing a protective stop loss order, use the resistance or support they provide.
I love when I can use a “00” as a ceiling in a short or as a floor in a buy. It’s
a powerful level that can be an asset to the trade. The same goes for profit
targets. In situations where your trade is moving toward a psychological
level, you’re going to want to “step out in front” of the size and orders that
will be waiting there. So imagine that you are short and prices are heading
lower to the “00.” Your profit target should be preferably five pips ahead of
the “00,” putting your order at the “05.” When long and prices are heading
up towards the “00,” the limit order (or if you are using a stop order as a
profit target) will be at “95.”
In fact, for many traders, psychological levels are the easiest and the
most powerful support and resistance levels on a chart. They are reliable
because they are not necessarily required to be confirmed by price action
as support and resistance. They work because of the way we gravitate to-
wards whole, round numbers. The psychology of market participants is
what makes them reliable and relevant.
The ultimate aspect of order entry is you. A trade is an emotional thing.
There is excitement and fear, greed and expectation, denial and anger
P1: OTA
c04 JWBT185-Horner October 24, 2009 15:18 Printer: Yet to come
40 FOREX ON FIVE HOURS A WEEK
and that’s just on a good day! The idea that we can trade unemotionally
is ridiculous. I see mention of it, but removing emotion from trading is
next to impossible. Our egos and money are on the line. There are some
steps we can take to remove ourselves from the equation. The problem
with most emotional trading is that unlike betting on a horse race, where
once the race starts you just wait to see where your pony finished, in trad-
ing you can keep going back and keep changing your bet. That’s the main
challenge most traders face, the betting window never closes once you’ve
placed your initial bet. To keep from going back we use order entry to instill
some discipline and reduce the urge to tweak. It’s not a perfect solution,
but at some point there has to be a line that you know not to cross. Here’s
how we can begin defining that line.
The best thing to do is avoid market orders. These are the ultimate
temptation and a trade tweaker’s nightmare. You likely know a trade
tweaker, or maybe you are one yourself. These are the unfortunate traders
who cannot follow the plans they laid out before the trade was initiated.
I call this the “sane” part of the trade. We’re all in control or at least in
better control of our emotions during the trade set-up, which is to say that
once we enter the market most of that control gets thrown out the window!
Since we know there is a better chance of seeing things more clearly and
making plans with less emotion before the entry is triggered, it makes much
more sense to use pending orders like limits and stops to tell the market
(via our broker’s order entry platform) what we’d like to do. That means
entering an order for the entry, entering an order for the initial profit target,
and certainly entering the order for the stop loss. The last is the most im-
portant because we’re most likely to negotiate this one back if price moves
against us.
Don’t neglect the parked profit target order though in terms of avoiding
the pig in the head. The pig will tell us to try and take more profit, try
to “ride the trend” regardless of whether that’s valid or not. Many traders
will jump out of a winning trade too early just as easy as they will ignore
a stop loss. Most traders find themselves following behavior that makes
them take profits entirely too early and push stop losses way too far back.
Consequently, we can make small profits and suffer large losses. I say that
this can be modified by good order entry: more specifically, pending orders
parked in the market, and this includes the entry order.
The phrase “set it and forget it” has found its way into our lexicon and
is probably the best way to describe what I want you to do with your order
entry. There is really no way of becoming a Forex in Five trader without
mastering the “set it and forget it” order entry habit. First because it helps
you manage you, and second it is the only way to free yourself from the
office chair. Setting it and forgetting it should be really more of “setting it
and following it” because the goal here is to place your orders and then see
P1: OTA
c04 JWBT185-Horner October 24, 2009 15:18 Printer: Yet to come
Objectivity 41
what the market does. You’ve done the analysis, and only bad decisions will
be made if you go back and tweak. Now, of course, if there is a reversal,
there will also be a set-up, and again it’s a matter of putting the order as
the market cycle and price action dictates that will allow you to have a
confirmed reason to change your opinion.
TRENDLINES, SUPPORT,
AND RESISTANCE
Let me first say that I love manually drawn support, resistance, and trend-
lines. These static and dynamic levels have been my bread and butter for
years. But they also took me years to get good at and even more years to
get good and quick at. When you add support, resistance, and trendline’s
cousin, chart patterns, to the mix, then you’re talking about even more
time-consuming and subjective analysis. Since our goal here is to get you
to do about an hour a day in the forex market, and with positive results,
then we have to focus on less interpretative but equally powerful analysis
methods.
There is the option of automating these levels with some of the many
software programs that will do this for you. Still, though, you must first
have the skill to find these on your own before automating the process. I
use EZ2Trade Software, Autochartist, and a host of plug-ins on my MT4
platform to give me a helping hand, but really this is a luxury not a ne-
cessity. Another one of my favorite tools are Lazy Days Lines, which are
Fibonacci-based moving averages that act as dynamic support and resis-
tance levels. They are like cousins to my Wave.
However, before you finally decide to identify support and resistance,
remember that before automating anything, you must have the skill to find
these levels on your own. Otherwise, you’ll never develop the discretionary
eye to know when the lines and levels a piece of software is drawing are
off or flat-out wrong. I learned to drive a manual transmission before going
to an automatic. Same idea I am espousing here. Learn to do it manually;
otherwise, you’ll never have the skills if you adopt automation first.
STATIC AND DYNAMIC LINES
There are four considerations when drawing manual uptrend lines, down-
trend lines, horizontal support, and resistance. You’re not going to be re-
lying on subjective lines like this; however, it is important that I teach you
some valuable tips to doing it correctly. Ignorance is not bliss.
P1: OTA
c04 JWBT185-Horner October 24, 2009 15:18 Printer: Yet to come
42 FOREX ON FIVE HOURS A WEEK
There are major and minor trendlines on any chart, and these lines
are drawn from the highs and lows (otherwise known as touchpoints) that
occur as price action rises and falls. It’s when a trader draws lines across
the tops of the high touchpoints, playing a version of charting dot-to-dot,
that you get the lines and levels that most traders use for entry. But these
levels will vary from trader to trader and from time frame to time frame,
and that makes them what? Yes, you know it: subjective.
There are a few things we can do to draw better, more reliable, trend-
lines, support, and resistance.
First, work within the market memory. Look for touchpoints within
the market memory of the time frame you are looking at. Too much data,
and you will be drawing lines that are not relevant. Too little, and you will
be missing out on larger, significant lines and levels.
Second, note how many touchpoints were used to draw the static (hor-
izontal) or dynamic (trendlines) line. More touchpoints make the line more
significant, as this reflects more respect for the resistance or support it pro-
vides. Obviously you need at least two touchpoints to draw the line in the
first place but if you have three, four, or more, then make a note of that, as
it’s likely that it is a major dynamic or static line.
Third, look at how the touchpoints you used to draw the line are
spaced apart within the entire market memory. Are they all huddled close
together, or was there a healthy amount of spacing between each touch-
point? You are looking for some spacing, as that would indicate that there
is an ongoing and longer-term impact from the line. You also want to note
how far back the line or level started. Was the first touchpoint deep within
the market memory, or did it originate with more recent price action?
Fourth, and this is the last consideration, is proximity to current price.
Is the line or level far from current prices, or is it close and therefore more
likely to affect prices near term?
As you consider each one of these criteria for each line you have drawn
you will begin to notice which are stronger and more likely to impact price
action. These questions presuppose that there is more than one line or level
on the chart, which is often the case. I’m not sure when traders were told
that they can only draw one line: one downtrend, one uptrend, one support,
one resistance. There is not a quota here! There are often multiple down-
trend lines, major and minor, as there are multiple uptrend lines. Draw
them and then after that you can step back and run them through the four
criteria I just walked you through. This will allow you to prioritize them.
Now as we look at other forms of dynamic and static lines and levels
such as my Lazy Days Lines you’re about to learn, keep these criteria in
mind.
P1: OTA
c05 JWBT185-Horner October 24, 2009 17:29 Printer: Yet to come
CHAPTER 5
The Magic of
Lazy Days Lines
The siren song of the markets can be alluring. Sometimes
too alluring. Learn to walk away.
2006 “Fxstreet.com. The Forex Market.” All Rights Reserved.
F
ibonacci is not a trading tool; it’s a mathematical law of nature.
Leonardo de Pisa was an Italian mathematician who was given the
name of Fibonacci posthumously, Fibonacci being derived from
filius Bonacci or “son of Bonaccio.”
I am particularly interested in Fibonacci numbers in nature. Whether
you are looking at the rise of pyramid walls, spirals of a nautilus shell,
leaves on a stem, fruitlets on a pineapple, the flowering of an artichoke,
the bumps on a pinecone, the way cells split, the curves of a wave, or the
43
P1: OTA
c05 JWBT185-Horner October 24, 2009 17:29 Printer: Yet to come
44 FOREX ON FIVE HOURS A WEEK
branching of trees they can all be explained by the Fibonacci sequence.
But the best proof is seeing these lines at work as they show you dynamic
support and resistance on a chart. So let’s get to it. Just remember that
these lines are not just trading tools. The bigger picture is that they are
able to consistently project psychology and human nature.
In this chapter I will share with you how I incorporate Lazy Days Lines
on a daily basis. The Lazy Days Lines (Fibonacci-based moving averages)
are the short cut—the objective alternative. This is the best way in my opin-
ion to identify support, resistance, and trendlines more objectively on your
charts.
NOTE
All of the figures in this chapter can be found in color at: />Home
ForexinFive.htm.
FIBONACCI ANALYSIS
Fibonacci levels, whether they are retracements or extensions, are simply
support and resistance that is calculated from the last major move. Another
way of saying that is that the markets continually retrace their moves, and
we can identify these when we locate the most recent, most significant
rally or sell-off. Within these moves are the levels that price action will
attempt to climb up or climb down, and that’s the way support and resis-
tance works. Fibonacci analysis is subjective because there could very well
be more than one last major move. Consider that when analyzing a pair,
the last major move could be different from time frame to time frame. This
is exactly why charting analysis should be confined to the time frame that
you are setting up the trade on.
The subjective nature of Fibonacci can be a bit of a turn off for some
traders. But given time you will be able to recognize Fibo levels with ease
and then you will see clearly why it was worth the effort. The best reason
that Fibonacci works is not the fact that so many traders use it. In fact,
the way a 200 simple moving average can affect trading is based upon the
widespread use of this moving average at the 200 period setting. Fibonacci
is not that objective. On a given chart there could be multiple moves from
which a group of traders could identify a Fibonacci Retracement series so
it’s not the commonality that makes them work it’s far more interesting
than that. Fibonacci, because it is a law of nature, will take a move and
calculate what it’s most likely to do after making that move. It’s the idea
of the natural ebb and flow of life, the way all things in nature contract
P1: OTA
c05 JWBT185-Horner October 24, 2009 17:29 Printer: Yet to come
The Magic of Lazy Days Lines 45
and expand. Fibonacci simply measures human nature, fear and greed, as
it plays out in the markets. This is why it works even when you don’t nec-
essarily have the “most correct” last major move. This subjectivity is very
uncomfortable to traders who need to put market behavior in convenient
categories—as if human nature were always that simple to decipher. All Fi-
bonacci seeks to do is identify support and resistance or “decision levels”
at which bulls and bears will try to see who is in control.
Whether the levels used are Fibonacci-derived, pivot points, psycho-
logical levels, moving averages, chart patterns, and so on, the idea is the
same: What is the psychology that got us here? Where (at what price) will
the next decision to go either higher or lower be made? Regardless of what
tools you use to analyze the markets, that is the only aim of chart analysis.
LAZY DAYS LINES AT WORK
This should be law: All fish should be offered in a deep fried coconut
crusted version. My favorite restaurant takes fresh snapper, grouper, you
name it, and fries it in coconut batter and serves it on fresh bread with
mango chutney. It is sublime. Lazy Days Restaurant sits on stilts oceanside
in Islamorada at mile marker 79.9. Chef Lupe fixes the most unbelievably
amazing seafood dishes I have ever had, and I look for any reason, occa-
sion, or excuse to go there. It’s a two-hour drive so my husband and I will
make a day of it and spend a few hours at the restaurant when we go. I bring
my laptop (notebook, netbook, whatever it is that they call these things
now!) which unplugs me from my office thanks to my laptop connect card.
I have executed quite a few trades while enjoying my fish sandwich, and
even losses don’t sting as much when I am at Lazy Days. Oh, did I mention
the passion fruit iced tea?
With all the traveling I do these days, and all the abuse my laptop goes
through getting past airport security, it’s no wonder I seem to dispose of
them with alarming frequency. I had just bought a new laptop after yet an-
other tragic loss. It was a few days later that we decided Lazy Days needed
a visit. So I threw (no that should be “gently placed”) my laptop, my laptop
connect card, a few sticky notes, and the power cord into my rucksack, and
we were gone. It’s days like those that I sit back while staring up through
the sunroof of my husband’s truck that I say to myself, Yeah, so this is why
I love being a trader.
My joy was short-lived because halfway through the mozzarella sticks
I realized I had not yet installed any kind of software on my laptop. Stupid!
I had also entered some trades before leaving home. Stupid, stupid!
I started my laptop up, downloaded eSignal, and stared at the unfamil-
iar layout. Back at my home office I have my chart layout sized exactly the
way I like to look at them. I have my Wave and confirmation indicators. I
P1: OTA
c05 JWBT185-Horner October 24, 2009 17:29 Printer: Yet to come
46 FOREX ON FIVE HOURS A WEEK
even run a plug-in that automates trendlines, support, and resistance levels
for me. And none of it was here in Islamorada. Sure I could draw my own
trendlines. But amidst my Lazy Days meal euphoria I decided to relax. I
was in the Keys after all and decided to try a few things out.
The eSignal that runs in my home office is spread across four screens
so I watch quite a few charts, and I have a few off in the corner of one
screen that I play around with some ideas. One of them had been in the
corner of my screen ever since I had originally tested and began using the
Wave. You see, before I decided to use the 34 EMA, I had tested the Fi-
bonacci series thoroughly for market cycle indication all the way to the
144 and even had gone up to 6,765. While I was plotting and testing these
Fibonacci-based exponential moving averages, I had noticed that they all
offered dynamic support and resistance across all my charts. At the time
I was just looking for a market cycle indicator, but I felt like the chemist
who was trying to invent the strongest glue ever known and instead made
a really weak one. But then he decided to put this really weak glue that left
no residue on little yellow pieces of paper and voil
`
a, sticky notes.
I guess I really didn’t know what I had, but I knew that someday I would
find a use for it so like a packrat I put up a single chart off in the corner
of my screen with the rejected Fibonacci-based moving averages. It was
sitting there in between bites of my hogfish sandwich that I decided it was
time to take those moving averages and see if they were my “sticky notes.”
These Fibonacci-based exponential moving averages met the one cri-
terion that I look for, objectivity. They reduced the lines and levels I had to
manually draw on a chart, they were more accurate because they didn’t in-
volve any subjectivity, and they were based on Fibonacci numbers, which
have an amazing way of getting the pulse of the way things in nature ex-
pand and contract. When you consider the subjectivity of manually drawn
trendlines and the time it takes to identify and draw them across multiple
pairs and time frames, you can begin to see what a significant improvement
this can make in your analysis.
I also think that this is a perfect time to mention that while this book
and probably about 80 percent of my trading is in the forex market, I use
these same trading tools, philosophy, and entry strategies to trade stocks,
ETFs, and futures.
USING LAZY DAYS LINES
The Lazy Days Lines are simply the exponential moving averages set on the
close of the following numbers:
55, 89, 144, 233, 377, 610, 987, 1597
P1: OTA
c05 JWBT185-Horner October 24, 2009 17:29 Printer: Yet to come
The Magic of Lazy Days Lines 47
Each number is basically a single exponential moving average set on
the close, and you can plot these on each time frame you watch. They will
take much of the heavy lifting from your charting analysis. Use these lines
as you would any manually drawn support, resistance, or trendline because
they are in fact dynamic decision levels.
Now it’s not just that easy. The next step is going to be yours. The
job ahead of you now is to train your eyes to recognize these lines when
they are identifying support and/or resistance well; it’s what I call prices
respecting the levels. This comes over time and practice. That’s why I call
it training your eyes. You are likely not going to see the charts in the same
way I do. Over the years my trading and analysis have quite literally evolved
through repetition, allowing me to focus on recognizing the “right” cues
quickly. With practice I’m certain you will get there, too. If I didn’t truly
believe that, I could never teach with the joy that I do. Remember, no one
told me how to do what I am outlining in this book. For me it was trial and
error. For you it will be recognition and practice.
Once you put these eight exponential moving averages on your chart,
you will in essence have an automated support/resistance study on your
chart, any chart, instantly. Add to those Lazy Days Lines the market cycle
indicator of the Wave and psychological numbers, there is little more you
have to do manually to your chart(s) other than make sure your market
memory is correct for the time frame you are looking at. This all goes back
to the foundation of Forex in Five trading. Quick, reliable, objective tools
and analysis are the core of this trading approach and overall philosophy.
Think of Lazy Days Lines as an alternate for support, resistance, and
trendlines. I think that it’s a quick and easy way to find levels to watch on
any chart. While they may not be perfect, they are objective, and there is
value in that, since uptrend lines, downtrend lines, and horizontal support
and resistance that are drawn at the trader’s discretion can carry bias and
are open to user error. If you are long the market, there is a tendency to
see the charts in bullish terms and vice versa when you are short. Lazy
Days Lines can also give you insight into the trend of the time frame they
are plotted on. When the market is strong, prices tend to trade above the
Lazy Days moving averages, and when the market is weak, they are usually
below.
You’ll also notice when you start laying these moving averages on your
charts, how often Fibonacci levels will coincide with the Lazy Days Lines.
Again, when you see a certain price with multiple studies pointing to its
validity as support or resistance, it just strengthens that level that much
more.
The validity for these lines can be strengthened by psychological levels
as well. In fact, really any support and resistance level that lines up with
the 00, 50, 20, and 80 pip levels fortifies the strength of that support and
P1: OTA
c05 JWBT185-Horner October 24, 2009 17:29 Printer: Yet to come
48 FOREX ON FIVE HOURS A WEEK
resistance that is likely to be there. I like Lazy Days Lines for their simplic-
ity and reliance upon a series of numbers that I already have great trust in.
Truth is that you are not likely to develop the kind of confidence in these
levels that I have until you take the time to set them up, observe the sup-
port and resistance they offer, and basically see them at work. This takes
time and observation. In fact, the confidence to begin relying on Lazy Days
Levels can begin and should begin with the Wave.
THE WAVE IN ACTION
I now want to show you a couple of practical examples of how I incorpo-
rate Lazy Days Lines with the Wave by using the following charts as our
reference points.
This is basically the Wave/CCI set-up and is an entry style that I have
been using for almost 15 years. The difference now is that I am trying to
make it more step by step with fewer discretionary items to consider (e.g.,
Wave clock angles, price).
So you have the Wave: the 34 EMA on the high, the close, and the low.
What I have done, mainly for my own purpose here is to replace the Wave
with colored candles. A green candle is a candle that has already closed
above the top line of the Wave, the blue candle is one that has closed within
the Wave itself, and the red is a candle that has closed below the bottom
line of the Wave (see />ForexinFive.htm for colored
charts).
The entry trigger is a candle that breaks up through the top line of the
Wave (buy) or a candle that breaks down through the Wave (sell). Blue can-
dles are alert candles as they are neutral and that would mean they signal
that a trigger could be coming. Blue candles will most typically occur dur-
ing the sideways market cycle or during an uptrend pullback or downtrend
bounce.
So you see that the basics are the same ideas that I have used and
taught. I think what makes it interesting is that this is completely visual.
I think that in the interest of keeping this basic system, well basic, is
to consider only major and minor psychological numbers, which are com-
pletely objective, or even pivot points, which are almost completely objec-
tive. (By the way, it’s time that makes pivot points subjective as different
traders can use different closing and opening times.)
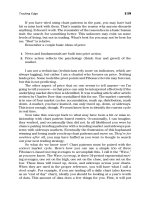
Enough talk, let’s look at Figure 5.1. I call these charts “GRaB” charts
(Green, Red, and Blue).
Notice there is no noise. None. The downtrend would look like Figure
5.2 on one of my typical charts with the Wave and Lazy Days Lines.
P1: OTA
c05 JWBT185-Horner October 24, 2009 17:29 Printer: Yet to come
The Magic of Lazy Days Lines 49
110.00
105.00
100.00
95.00
93.69
90.00
11 18 25
Sep Oct
(JPY A0-FX - JAPANESE YEN,D) Dynamic,0:00-24:00
Nov Dec 2009
01 08 15 22 29 06 13 20 27 03 10 17 24 01 08 15 22 29 05
FIGURE 5.1 A “Naked” USD/JPY Daily Charts
© eSignal, 2008.
FIGURE 5.2 The Same USD/JPY Chart as Before with Lazy Days Fibonacci Lines
© eSignal, 2008.
P1: OTA
c05 JWBT185-Horner October 24, 2009 17:29 Printer: Yet to come
50 FOREX ON FIVE HOURS A WEEK
There’s more information here but that’s also what can take a lot of
traders off the fairway and into the tall grass.
The set-up is a classic Wave/CCI but the trigger can look cleaner when
all you are looking for is the green candle; green again simply indicating
that prices have broken the top line of the Wave.
What makes this set-up even better is the blue (neutral) candle in be-
tween and that’s the pause we would look for in the Wave/CCI set-up as the
market cycle goes to two to four o’clock. See, this should already feel a bit
familiar. We’re taking advantage of a breakout to the upside as signaled by
price breaking up through the Wave.
Frankly, my eSignal plug in has done this candle coloring since it was
first introduced at the eSignal website six or seven years ago. Obviously it’s
just a visual cue just an aesthetic tool.
Here’s a few that are setting up right now on the 30 minute USD/JPY
(see Figures 5.3 and 5.4). I will say that I like this set-up better on longer
term (especially daily!) chart versus intraday. But then again, almost ev-
erything works better on end-of-day charts as they are the most psycholog-
ically relevant.
Figure 5.5 shows one I am watching.
94.50
93.50
93.00
93.67
92.50
92.00
01/04 01/05
(JPY A0-FX - JAPANESE YEN,30) Dynamic,0:00-24:00
01/06
FIGURE 5.3 30-Minute Intraday Chart of the USD/JPY
© eSignal, 2008.