Forex on Five Hours a Week: How to Make Money Trading on Your Own Time _5 ppt
Bạn đang xem bản rút gọn của tài liệu. Xem và tải ngay bản đầy đủ của tài liệu tại đây (732.79 KB, 22 trang )
P1: OTA
c07 JWBT185-Horner October 24, 2009 19:6 Printer: Yet to come
CHAPTER 7
Around
the World
Effective order entry will allow you to walk away!
2006 “Fxstreet.com. The Forex Market.” All Rights Reserved.
L
et’s preface this next discussion with the fact that many of us have
attended one of the many traveling shows that come to our town talk-
ing to us about forex trading and the wonderful world of this 24-hour
market. If you are expecting me to bash these, I’m not. If you were intro-
duced to this market by some such presentation, well then, that was worth
your time and you had the knowledge to go out and seek more knowl-
edge, which no matter who it comes from, can be a valuable gift—if you
know what to do with it. If you bought the course, software, book, DVD,
73
P1: OTA
c07 JWBT185-Horner October 24, 2009 19:6 Printer: Yet to come
74 FOREX ON FIVE HOURS A WEEK
whatever, I’m quite certain no one put a gun to your head. So let’s move on.
It’s a fresh start.
Two of the most compelling features of the forex and the ones most
touted are the 24-hour trading time of the foreign exchange and the fact
that it is the largest market in the world. Both in fact are true but exagger-
ated. How about the fact that there is always a bullish market in the forex?
Also true, but you need to find the pair that is trending higher.
If you were to ask me what the biggest misconception most traders
have about this market, the one thing that is completely overused and mis-
understood, it’s that this market trades 24 hours a day. Now what a minute,
Raghee, you just said that was true! And you’re right, I did. But let’s clarify
right now—all 24 hours are not created equal.
WHO’S AWAKE?
This is the first question to ask before you put on a trade, before you be-
gin your analysis, and is a key to understanding follow-through and order
entry.
This was not necessarily a common train of thought for those of you
who are making the transition to the forex market from the futures or stock
market as I did back around 1999–2000. We knew when the market opened
and closed; heck, they rang a bell to let us know! We knew what was an
illiquid pre- and post-market, and we know when most of the volume oc-
curred. For those of you not making this transition, you were wide-eyed
listening to the speaker explain how you could come home, hit a few keys,
look at the market, and execute your trades before heading off to work or
after dinner. Well, it’s not untrue, but it’s not the whole story either.
I’m sure you’ve heard about your buddy or a friend of a friend who gets
up at 2
A.M. EST to trade the markets as Europe and the U.K. begin trading.
And now you’re thinking 2
A.M.? I can’t get up at 2 A.M.! Well, here’s the
skinny. I don’t, and you don’t have to either. It’s a choice you can make,
and heck, if you live outside the United States these may very well be your
regular trading hours, but for most traders in the United States it’s a fright-
eningly early part of the morning reserved for new parents whose newborn
still doesn’t sleep through the night.
By the way, I have received many e-mails from new parents who have
said that getting up with their baby is a great way to trade the forex. All I
say to that is you can never start teaching your kids about the markets too
early!
“Who’s awake?” is the rule by which you will govern your trading ac-
tivities. Just because a trading time is convenient doesn’t make it effective.
One financial center is not necessarily equal to another in importance or
P1: OTA
c07 JWBT185-Horner October 24, 2009 19:6 Printer: Yet to come
Around the World 75
size. These are the financial centers that I keep on my desktop. I use a
program called the World Tick Time Zone Clock. It’s about $20 last time I
checked, and it allows me to put multiple, floating clocks on my desktop.
You can go to www.thirtydaysoftrading.com to download a free trial that
is set to my specifications. You don’t need this if you have another program
that will do it for you, and it’s certainly easier and cheaper than running
out and buying six clocks.
When you sit down to trade, you must ask yourself which of the fol-
lowing six financial centers is open for the trading day. Let’s first define
what “trading day” is because it’s how you will know when the active part
of the work day is in each city you track. People are people. If you’ve done
any amount of traveling, this becomes clear. No matter where you go we
are all actually very similar in our habits and beliefs. The workday is no
different. People in Tokyo more or less start work at 7
A.M.to8A.M. and
wind down their day between 5
P.M. and 6 P.M. This is no different in New
York, London, Frankfurt, Hong Kong, Singapore, or Sydney. And not too
coincidentally, those are the main financial centers I keep track of.
So when you are sitting down at your computer, before you even begin
analyzing any chart, you must know who is up and trading the markets.
Which financial center or centers are active, which are going to be active,
which are getting ready to call it a day? If the markets are open 24 hours,
we know that there are shifts from one country to another as they begin
their work day. This shift must be accounted for. In fact, one of my opening
range strategies looks to capitalize on this opening. While the forex market
does not close, humans in a sense do. We go home, eat, and sleep. Opening,
lunch time, and closing time are worldwide, city-by-city realities we must
acknowledge.
Let’s break down each financial center and get an idea of who is moving
the market and when.
FINANCIAL CENTERS YOU NEED
TO KNOW
Beginning with Sydney, as it is the first new look at the coming day, the
forex market “opens” with the country of Australia, and so we focus on its
importance as the initial opinion of the day. It’s not the largest financial
center by any means, but the first look of the day should not be ignored.
Sunday afternoon New York time is the first look most traders have at the
coming week, and brokerages in the United States open and allow traders
to enter trades. Now I cannot account for the many brokerages around the
world, but Sydney still represents the beginning of a brand new week no
matter where you live. So starting with Sydney we move on to Tokyo.
P1: OTA
c07 JWBT185-Horner October 24, 2009 19:6 Printer: Yet to come
76 FOREX ON FIVE HOURS A WEEK
Once Tokyo opens, you have a more significant Asian open, and this
also creates the first market overlap. This means you have two major fi-
nancial centers open and trading at the same time. Remember the only
reason the forex market is a 24-hour market is that as one financial center
closes you have another opening or preparing to open, and this accounts
for the 24-hour liquidity. This concept of market overlap is a very impor-
tant one because participation of multiple financial centers is what makes
the trading during those hours more liquid and also more significant. The
more people that are awake and trading during certain hours, the better it
reflects a broader market psychology.
Once Tokyo opens or more accurately put, becomes active, one hour
after Sydney, there is only Hong Kong and Singapore left to complete a full
representation of the Asian session. Hong Kong and Singapore are in the
same time zone, but both represent major financial centers, so I mention
both. Realize that it takes just two hours for the Asian session to go into
full swing once Sydney opens. But, alas, the Asian session currently only
accounts for approximately 10 percent of daily turnover and thus does not
even come close to being a major reflection of the trading day that is still
to come.
I have to say that as I am on the east coast of the United States, I think
in east coast time. I am however going to mention that most of the time
you will see time represented in Greenwich Mean Time (GMT) when you
look at most forex tools and sites. And that’s fine just as long as you realize
that GMT is basically London time and London trading hours are the most
important in the forex universe. In fact, London is the 800 pound gorilla
among the financial centers. GMT is also commonly referred to as UTC or
Universal Coordinated Time. Regardless of what it is called, GMT gets its
name from the solar time at the Royal Observatory in Greenwich, London.
So don’t worry when you see GMT, just think London. London is one hour
behind Frankfurt and five hours ahead of New York.
London is the financial capital of the world to many. Sure Chicago is
the center of the commodities world and certainly New York is the center
of the equities world, but to forex traders, the European and U.K. session,
represented by Frankfurt and London, are the most important. And yet I
tell you that you don’t have to get up and trade with these giants. Let me
explain.
PRIME TIME!
Prime time is the overlap between Frankfurt, London, and New York. It
occurs between the hours of 7
A.M. EST (early) and 1 P.M. EST (late). That
represents noon to 6
P.M. EST in London.
P1: OTA
c07 JWBT185-Horner October 24, 2009 19:6 Printer: Yet to come
Around the World 77
Now to give an idea of why these five hours are the meat and pota-
toes of the forex trading day I have to get into which pairs are by far the
most actively traded. I’ll preface this discussion by saying that this does
not reflect the fact that I live in the United States. It reflects trading ac-
tivity and trading activity alone. Not my trading activity, but the vast ma-
jority of traders around the world. According to the Bank of International
Settlements, the most actively traded pairs are the EUR/USD (“fiber”), the
USD/JPY (“dollar-yen”) and the GBP/USD (“cable”). The next three pairs
round out the top six most actively traded pairs: the USD/CHF (“swissy”),
AUD/USD (“aussie”), and the USD/CAD (“loonie” or “canada”).
By the way, as I mentioned earlier, traders shorten everything and give
it a nickname. Apparently we can’t help it. So to keep you from sounding
like a complete “noob” (that’s short for newbie or rank beginner) let me
bring you in on trader-speak. Right off the bat, if you are referring to any
pair that trades 1.xxxx, just drop the “1” when you are talking about it. So
when you are telling someone about the EUR/USD trading at 1.2765, you’ll
just say “the fiber is trading at 2765.” Got it? Now, of course, when you
are placing a trade, say it properly. Full quotes only! Every pair seems to
have a nickname and some have more than one. You’ll hear the familiar
“greenback” nickname for the U.S. dollar. The greenback nickname comes
from when U.S. Demand Notes created by Abraham Lincoln to finance the
Civil War were printed in black and green on the back side: greenback. The
pound sterling—not the pair but the pound sterling itself—is referred to as
“quid” named so from the Royal Mint in Quidhampton or the Latin “quid
pro quo” meaning “what for what” as an exchange of goods for currency.
Either way, “quid” it is. The “loonie” can mean the U.S. dollar/Canadian
dollar pair or the Canadian dollar itself. It comes from the picture of a loon
on the back side of a one dollar coin. The name “loonie” is so well known
as reference of Canadian currency that the Royal Canadian Mint secured
the rights to the name loonie. The “cable,” which is the nickname for the
GBP/USD comes from the Transatlantic Cable laid in mid-1800s that linked
the United States and the United Kingdom by telegraph. Through this un-
derwater cable, currency prices would be sent between New York and
London. The nickname for the EUR/USD, “fiber” is a little more difficult to
pinpoint. First of all, it’s not that commonly used, but I personally think it is
a good habit not to call the EUR/USD the “euro” as a nickname for the cur-
rency since there is actually a “euro” currency and this can be confused for
the single currency versus reference to the pair. The “fiber” comes I think
in part from “fiber optic cable” in much the same vein as the GBP/USD is
called the cable, and also in part from the security thread that is woven
into the center of a euro note, or perhaps and more likely is the fact that
the paper for the euro banknote is 100 percent pure cotton fiber. There you
have it, two good and one very obvious reason to refer to the EUR/USD as
the fiber. You got your nickname background, now go use ’em!
P1: OTA
c07 JWBT185-Horner October 24, 2009 19:6 Printer: Yet to come
78 FOREX ON FIVE HOURS A WEEK
So if you look back over the six most traded pairs, there should be one
obvious common factor they all share. Know it? Yep, that’s the U.S. dollar.
They all traded against the U.S. dollar. So the focus on the prime time from
7
A.M.to1P.M. EST has nothing to do with when I want to trade or when it
is convenient to trade but rather the all-important market overlap between
Frankfurt, London, and New York. Once New York enters the picture you
have U.S. participation in the markets, and that is where you will see the
most impactful dollar trading events and opinion.
If you live in Europe or the United Kingdom, then there’s certainly no
reason you can’t trade the major pairs and cross rates. I mean of course
you can! You don’t need me to tell you that. But keep in mind that U.S.
economic releases and the U.S. Dollar Index futures will impact the pairs
once New York gets active between 7
A.M. and 8 A.M. EST and of course be
aware of 8:30
A.M. EST economic data releases as well as 10 A.M. EST as
these are the two most common scheduled release times.
Cross-rates or pairs that don’t trade against the dollar are certainly vi-
able alternatives when the U.S. market is not open, but let me say that these
are not always liquid pairs. “Liquid” is just another way of saying good vol-
ume. Good volume means there is plenty of trading in a market, which
facilitates getting in and out with ease and a tight bid/ask pip spread. If I
ask you, “What’s the spread?” I am essentially asking you what the differ-
ence is between what price I can buy a pair for and what price I can sell a
pair for. For the majors it is commonly three to five pips. As brokerages get
more and more competitive, this spread is narrowing. The spread is your
cost to enter. You pay the spread when you enter and exit. By the way, the
spread is nothing new, nor is it solely a function of the forex market. There
are spreads you pay in the stock and futures market as well. And just like
the forex market, more liquid symbols have tighter spreads while illiquid
symbols have wider spreads.
I often feel a little silly talking about illiquidity when it comes to forex
pairs and cross rates. I mean after all, in a nearly $3 trillion per day mar-
ket (and still growing), it’s difficult to find a pair that doesn’t have decent
volume. But I assure you, there are some that fall behind in the participa-
tion department. Look at the spread. If, as I mentioned before, the majors
have a tight three to five pip spread, anything larger than that indicates one
of two things: First the pair is, by comparison to other pairs, less traded,
or second, there is an economic event or some such news event that is
increasing volatility.
Cross rates should be traded when the home nations of the currency
are active. To understand what moves a currency you must be in tune with
events, political and financial, so that you can be ready for explosions in
volatility and get an overall feel for what moves the pair and when it moves
the most. That’s the edge. It’s not fundamentals I am talking about; rather
P1: OTA
c07 JWBT185-Horner October 24, 2009 19:6 Printer: Yet to come
Around the World 79
I am referring to the psychological ebb and flow of that financial center. I
know I have this edge for the U.S. session as I live in the United States and
trade the Dollar Index alongside my forex pairs. I know when the president,
treasury secretary, Fed chairman, or other relevant official is scheduled
to speak. I won’t be blindsided by comments or events that I am neither
awake for nor know about—as I could and would likely be if I traded the
cross rates. Think about where you live and how you can attain this edge
for yourself. Look at international calendars. I know, for example, that re-
gardless of the fact that I live in the United States I must know the sched-
uled events for Europe and the United Kingdom, ECB (European Central
Bank), Jean-Claude Trichet (ECB President), BOE (Bank of England), BOJ
(Bank of Japan) these are all factors that will affect the way the pairs
trade. If you want a great international calendar, you can check out one
of my favorites at www.forexfactory.com. That calendar will give you the
time, country, name, and expected impact of the data. Not to mention the
all-important consensus number, which I will discuss later. The currency
markets are interrelated in a way that most traders are unaccustomed to.
Even some stock traders don’t understand the degree to which their stocks
are weighted in the large indices like the S&P, Dow, and NASDAQ. They
fail to understand that when a leader of a particular sector is weak, that
tide lowers all boats. Forex traders are in a similar situation but in a much
broader, much more interwoven context.
I’ve often said and do believe that forex traders have a unique vantage
point on the market. It’s not only an asset but a necessity to be able to un-
derstand how the markets affect one another. Trading currencies encom-
passes all the other markets, equities and commodities included, because a
currency is the stock of a country. Keeping this in mind, I don’t want other
markets to become a distraction or take you from the primary focus of the
pair you are setting-up to trade, but there are relationships we will discuss
later on; these are the market pulse charts.
It’s important to consider the other markets that affect the pairs
because the primary reason the overlap between Europe, the United
Kingdom, and the United States is so valuable is that it combines a number
of things that in combination make for the most active and volatile hours
of each trading day. That’s exactly why I consider this prime time.First
remember that each financial center opens like a freight train. I purposely
use 7
A.M. for each center because it’s early and I know that as people filter
into work there will be a gradual increase in market attention and there-
fore participation. Think of 7
A.M.to8A.M. in each center as the premarket
and then 8
A.M.to9A.M. as the open. There is no bell, so it’s not a horse
race. As Frankfurt opens Europe, the opinions of the European financial
community are reflected along with the last two hours of the Asian ses-
sion. There is a two-hour overlap between Europe and Asia and a one-hour
P1: OTA
c07 JWBT185-Horner October 24, 2009 19:6 Printer: Yet to come
80 FOREX ON FIVE HOURS A WEEK
overlap between the United Kingdom and Asia. But again remember, it’s
not as if Asia rings a bell and the currencies stop trading there. It slowly
grinds to a halt as Europe slowly begins their open. Think of a baton being
passed from one relay runner to the next.
The London session is my favorite to trade if and only if I am going to
play a clearing session/opening range play. This is a set-up that can also
be done specifically for the Tokyo open and the New York open as well
but works best on London. It’s fairly straightforward so I’ll explain it here,
since it is mostly a time-based strategy.
If you are coming from a stock daytrading background, this will sound
awfully familiar; same goes if you have traded intraday futures. For those
of you who haven’t and for the sake of making sure that we’re on the same
page, let’s explain the phenomenon of the opening range or “clearing pe-
riod.” Since most markets, other than the forex, actually open and close
with a rather thin premarket and after-hours session, there are bulks of or-
ders that are waiting to be executed before the real trading hours open.
Let’s use the U.S. stock market as an example. At 9:30
A.M. EST the market
opens with the ringing of the bell on Wall Street. The flood of orders all
waiting to be filled hits the order desks all at the same time. This rush of
orders being filled, along with market makers and specialists taking their
own position among the order flow creates a morning range that usually
establishes a high and low 20 to 30 minutes after the open. That type of ac-
tivity can and does translate to the forex market, but rather than the market
open, we’re looking at the financial center open.
These levels are known as the “clearing high” and the “clearing low”
and reflect the upper and lower limits (think support and resistance) based
upon the early mass of orders being filled. Again this all happens in about
20 to 30 minutes, so if you imagine London gearing up for the day, executing
the orders first thing about 3
A.M. EST, which translates to 8 A.M. in London
to 3:30
A.M. EST or 8:30 A.M. in London. These 30 minutes will hold the key
to breakouts and breakdowns as the market action settles down and price
action looks for the trend it will take for the day or at least for the morning.
In order to recognize the clearing high and low, use a five-minute chart.
This is the only time I personally trade off a time frame this short in dura-
tion. The five-minute chart makes identifying the clearing highs and lows
much easier. It’s not that you are simply marking the high and low of the
first 30 minutes of the day. Rather you are looking for a first morning rever-
sal where you can see the buying shift to selling (the high) and the selling
shift to buying (the low). Some days it’s clearer than others. Some days it
will basically be in the 30 minute high and low. I call these morning pivots,
but let me be clear; these are not pivots points—just directional shifts that
I call pivots.
Once you have the high and low drawn on your chart, sit back and wait.
The play is to short breaks down through the clearing low support and
P1: OTA
c07 JWBT185-Horner October 24, 2009 19:6 Printer: Yet to come
Around the World 81
buy breaks up through the clearing high resistance. I will often use filters
like the MACD Histogram that I use for momentum trading to confirm the
breakouts/breakdowns.
While I call this an “opening range play” or set-up, I acknowledge that
discussing an “open” is odd when it comes to a true 24-hour market but
there is an open and close as the major financial centers begin and end
their trading day. That’s what we’re playing off. It’s a time-based strategy
that reflects the psychology of the open and the support and resistance that
are created by the mass filling of “overnight” orders and fresh orders for the
morning. Consider the order flow reflective of banks and institutions and
trading desks all across the financial centers and the countries it reflects,
and you get a better idea of the kind of size that is executed upon starting
a brand new work day.
Don’t make this set-up more complicated—it’s the simplicity that
makes it work and frankly the shortened time frame doesn’t entertain get-
ting too analytical about the price action! The point here is to realize that
this is (1) a short term time frame set-up—tried and true “daytrading” and
(2) the breakout or breakdown is not meant to be taken as a new trend but
rather a momentum play. If you’re up early one morning, give this set-up a
try. At least draw the clearing levels and see how the price action plays out
a few times before trying it with your live account.
Prime time is the four to six hours where the focus is primarily on
London and New York. Here’s the thing about prime time, though. Once
London winds down its own trading day, it essentially ends the market
overlap between two financial centers. Realize that once London is closed
the only major financial center open is New York. No overlap, no trading.
The fact that the majors all have one thing in common (the U.S. dollar)
and the fact that the bulk of U.S. data which would affect the greenback
is released typically between 8:30 and 10
A.M. EST, accounts for the
importance of the hours between 7
A.M. and 1 P.M. EST and also for why it
is the most volatile time for the EUR/USD, USD/JPY, GBP/USD, USD/CHF,
and USD/CAD. Next, we’ll take a look at the actual pip movement ranges
over time. While I am sure most of you will take my word for it when I say
focus on the European, U.K., U.S. overlap, a few statistics to back it up
won’t hurt.
PIP MOVEMENT
The graphs that I am about to show you are courtesy of Autochartist
PowerStats. (www.autochartist.com/autochartist/PowerStatsBasic) They
are pretty self-explanatory, but there are few ideas I want you to consider
as you look at each graph.
P1: OTA
c07 JWBT185-Horner October 24, 2009 19:6 Printer: Yet to come
82 FOREX ON FIVE HOURS A WEEK
First, take note of more than just the highs and lows of each trading
hour—which are all in EST—notice the average.
Second, don’t think that just because the pair has a higher high range
that it is the pair you should be trading. (Note to you GBP/JPY traders!
Traders don’t call that pair the “twisted sister” for nothing!)
Third, notice how often the 8
A.M.to10A.M. period is the most active
and most volatile. That’s a double-edged sword, my friends!
Fourth, notice how inactive the Asian session is for most of the major
pairs but not all the pairs!
Fifth, well, there’s really no fifth; however, what I want you to come
away with from these graphs is to hammer in the prime time of each pair
into your habitual trading and notice when the activity drops off and picks
up again in line with regular economic data releases.
The graphs are set to a six-month sample, which means that while
this is typically representative of the average pip movement, unusual
occurrences can and will affect the overall range and thus the average.
These do not usually skew the data to the point of taking you away from
the main active hours, but can make certain hours look more active than
they would historically be. In the following graphs, the 23:00 time was
affected by such a one-time volatile occurrence in the last one month. I will
keep updated graphs posted at my personal blog ragheehorner.com every
few months so you can certainly check on any changes or observations I
am making note of.
A DAY WITH THE EUR/USD
The graph of the “price movement range by hour of day” of the fiber (you
know that’s the EUR/USD now, right?) is laid out in a 24-hour breakdown,
and it is in Eastern Standard Time. Now recall when each financial center
is coming in and out of the market as you look at each hour on the graph.
Remember that the fiber is representative of Europe and the United States.
(See Figure 7.1).
The specific hours to focus in on are the 17:00, which would be
Sydney’s first look at the day; then 18:00, when Tokyo is gearing up for
their trading day, and then jump ahead to 2:00, when Frankfurt enters the
picture and creates the European/Asian market overlap. Notice the bars,
the high, the low, and the average. Again, keep in mind that the 23:00 is an
anomaly representative of a move that is not a historical norm. What can
we get from this chart—the most traded forex pair—as we look at the na-
ture of its hour by hour trading? When is this pair the least active? You can
clearly see that the hours between 16:00 and 22:00 are the least volatile. If
you were to ignore the 23:00 anomaly you would see that activity does not
pick up again until 2
A.M.ESTwhichis8A.M. in Frankfurt. So how active is
P1: OTA
c07 JWBT185-Horner October 24, 2009 19:6 Printer: Yet to come
Around the World 83
100
90
80
70
60
50
40
30
20
10
0
0 1 2 3 4 5 6 7 8 9 10 11 12 13 14 15 16 17 18 19 20 21 22 23
–10
Average Area of high probability
EUR/USD Price movement range by hour of day
Hour of Day
Pips
FIGURE 7.1 A 24-Hour Look at Pip Movement in the EUR/USD
this pair in the Asian session? Not very. How about looking at the 8:00, 9:00,
and 10:00 hours? These are prime time hours when New York is overlapped
with Frankfurt and London. They are also the hours that most often include
the key economic releases in the United States and thereby affect the U.S.
dollar. That’s the importance and the reason why the hours between 7
A.M.
EST and 1
P.M. EST are so important. You could really narrow it down to
between 8
A.M. and noon EST, but there are set-ups and price action that
merit being at your desk a little earlier and staying a little later.
Now if you weren’t sure if Europe and the United Kingdom require or
wait on the opinion of the United States to move the EUR/USD, take a look
at the lull at 5:00, 6:00, and 7:00. After the Asian/European overlap ends at
4
A.M. EST and the last push of order comes out of Sydney, Tokyo, Hong
Kong, and Singapore, you’ll see that while Frankfurt and London make up
the largest percentage of activity for the forex market each day, somewhere
typically in the vicinity of 40 percent, they seem to be waiting for New York
to join the party. So what does that tell you? Unless you are willing to sit
through what can be described as a slight trough in activity between Asia
winding down and the United States gearing up, you are likely just as well
to wait to trade until 7
A.M. EST. And that’s why I don’t get up at 2 A.M.EST!
Now let me add this: There are days when set-ups will trigger dur-
ing these hours between 2:00 and 4:00. Certainly I am not saying that the
P1: OTA
c07 JWBT185-Horner October 24, 2009 19:6 Printer: Yet to come
84 FOREX ON FIVE HOURS A WEEK
opinion of Europe and the United Kingdom don’t matter! What I am saying
is that it is incomplete and the follow through for trades will often come
during prime time.
Let’s also define the listless hours by these PowerStat pip movement
range numbers. Do you notice the decrease in volatility starting after 10:00?
This is because the economic reports have been released, and most of the
data (if there indeed is any that day) has been reacted to. As London ap-
proaches 5
P.M. and it nears 12:00 EST, you’ll see New York’s afternoon
doldrums begin.
The spikes at 2:00 and 3:00 show the effect of 14:15 (2:15
P.M.EST)
FOMC rate decision and statements. Remember this is a six-month
look back at pip movement, and there will be a couple FOMC events
factored in.
Look at when I take the events out of the look-back and go down to a
one-month look at 2:00 and 3:00. Even more important, take a look at how
much more volatile the past one month has been when compared to the
last six. Be sure to look at the price (vertical) axis to see the difference.
This one-month chart has an upper reach of 140 pips versus the six-month
at just over 100 (see Figure 7.2).
140
130
120
110
100
90
80
70
50
60
40
30
20
10
0
01234567891011121314151617181920212223
–10
–20
Average Area of high probability
Download Data File
EUR/USD Price movement range by hour of day
Hour of Day
Pips
FIGURE 7.2 EUR/USD Price Movement Range by Hour of Day: One-Month Chart
Images © Autochartist.
P1: OTA
c07 JWBT185-Horner October 24, 2009 19:6 Printer: Yet to come
Around the World 85
Note the high of the 23:00 EST, which occurred during the Asian
session.
Another important fact about understanding pip movement range is
that the personality of a pair can change month to month. You will probably
notice this by simple observation and through your daily chart analysis,
but having the statistics to help identify upper and lower reaches of price
action can be extremely helpful when managing the risk and reward of
taking a trade.
This is just one pair and two look-backs, the six-month and the one-
month, and you can see how quickly a few distinctions about this pair and
its past and current trading habits can be made. Imagine the impact on
your day-to-day analysis and risk management. How can you use this data
to set better expectations of where you think a trade can follow through to
and what type of volatility you can expect depending upon when the trade
triggers? A trade triggering at 5:00 will behave very differently from a trade
triggered at 10:00!
TIME OUT!
Before I go much further and we delve deep into this, I want to
mention now that this is not just some number crunching and time
observations and mental exercise, although that could be interesting
enough I suppose. The reason Forex in Five traders need to know more
about time and how that releases to participation and how different partic-
ipation affects volatility is because picking your trading time depends upon
all these factors!
By the way, as we dissect the pairs, recall the opening range play I
walked you through earlier where you capitalize on the high and low of
London’s open between 3:00 and 3:30
A.M. EST or 8:00 and 8:30 A.M. London
time? Well, let’s examine that for a moment with the EUR/USD pip move-
ment range information of the 3:00 bar. There are times when the 2:00 will
be the more volatile of the two, and when you see this shift occurring, you
can actually apply the same strategy to the Frankfurt open—but again only
when the pip movement range confirms that Frankfurt is opening with a
wider range than London. The one-month look-back on the pip movement
range will indicate when you can make that shift. The other observation
pertaining specifically to the five-minute chart-based opening range play is
that after 4:00 if the market has not already made a move through the up-
per to lower end of the opening range, it’s likely to move with less volatility
until almost 8:00.
The impact of each financial center should be observed not only when
they enter the trading day but also when they exit. Take a look at the hours
P1: OTA
c07 JWBT185-Horner October 24, 2009 19:6 Printer: Yet to come
86 FOREX ON FIVE HOURS A WEEK
of 4:00, when Asia exits the market, and 12:00, when London exits the mar-
ket. These are also important and potentially volatile times, and, more im-
portant, they occur during market overlaps!
Let’s continue examining each pair because while the ideas we carry
about on how to use this data can effectively extend to the other pairs,
the characteristics of each pair are unique to it and the financial center it
represents.
Let’s jump to the USD/JPY (“dollar-yen”) and look at how this pair be-
haves. Asia is the third-largest participant in the forex. Asia at a typical
9 percent to 10 percent of daily turnover comes a distant second to the
United States, which is normally somewhere between 18 percent and 20
percent. As mentioned before, Europe and the U.K. come in at about 40
percent on any given day. Of course, remember that national and bank hol-
idays will affect this participation, so one of your daily habits must be to
look at whether one of the financial centers is on holiday. In fact, it’s best
to do this at the beginning of each week. I will glance at the entire week’s
economic calendar on Sunday night so I can prepare for the likely volatility
based on holidays and major reports before I start my trading for the week.
The dollar-yen is currently a proxy for Japan, China, and Singapore—
essentially all of Asia. Now this is regardless, truly, of whether this proxy
idea is correct or not. Bottom line, that’s how it is viewed. While Asia as
a whole (and this includes Australia and New Zealand) might rank in third
place in the forex participation standings, it does reflect the first look
at the new day and China. China’s yuan is not heavily traded as a forex
pair. Not now and with its peg to the dollar there’s no reason to think it
will be any time soon. To say that any country manipulates its currency
is a little childish. Of course, all countries manipulate their currency for
their own benefit. Manipulate may sound sinister, but I can assure you
that what central banks do in each country in the name of regulation
can be construed as “manipulation” by another country. Don’t fall into
that political trap. Trading pays homage only to price action. There will
be times when news out of China will affect Asia, and you will see the
USD/JPY move as a result. It’s the outlet. Be aware of this.
Trends coming out of Asia are also going to be affected by the Frank-
furt and London opening so don’t ignore this because at 2
A.M. EST is when
two worlds will collide. Because of its size, the Europe and U.K. market will
simply either agree with the sentiment coming out of Asia or move the mar-
ket around according to its own sentiment. Either way it means that 2
A.M.
EST, 8
A.M. in Frankfurt is a potential reversal time for the Asian market as
it winds down to its final few hours (see Figure 7.3).
Since the USD/JPY is reflective of Asia and the United States, there
is a tremendous time span of trading opinion that this pair has over most
others. You could consider the AUD/USD (the “aussie”) and the NZD/USD
P1: OTA
c07 JWBT185-Horner October 24, 2009 19:6 Printer: Yet to come
Around the World 87
80
70
60
50
40
30
20
10
0
01234567891011121314151617181920212223
–10
Average Area of high probability
USD/JPY Price movement range by hour of day
Hour of Day
Pips
FIGURE 7.3 A 24-Hour Look at Pip Movement in the USD/JPY
Images © Autochartist.
(the “kiwi”) to have a similar trait, but these two pairs are nowhere near
as heavily traded as the dollar-yen. The dollar-yen will pick up activity
as Tokyo gears up but notice that the real activity does not begin to
accelerate until 1:00. The 23:00 bar again represents a volatile event from
the past month. In this case, pertaining to the USD/JPY, is likely an 11
P.M.
EST BOJ (Bank of Japan) Governor or member speaking or an Overnight
Call Rate and Monetary Policy Statement as these mainly occur between
23:00 and 24:00. So this 23:00 spike is reflective of an economic event or
what I call a “hot zone.” 11
P.M. EST to midnight is a common hot zone for
the dollar-yen. Just as Federal Reserve Chairman Bernard S. Bernanke can
move the markets with speeches and remarks, remember each financial
center has their own version of Bernanke. Keep an eye on your economic
calendar for these events. If it is a scheduled speech or event, it will be
listed at www.forexfactory.com/calendar.php. Remember that the Power-
Stats program updates daily and samples from one, three, and six months
can be viewed. I will also share these regularly at my blog.
Even with an event like the 23:00 in the USD/JPY, notice that volatil-
ity quiets down in the following hours until London gets active. Even
P1: OTA
c07 JWBT185-Horner October 24, 2009 19:6 Printer: Yet to come
88 FOREX ON FIVE HOURS A WEEK
80
90
100
70
60
50
40
30
20
10
0
0
1
2
3
4
5
6
7
8
9
10
11
12
13
14
15
16
17
18
19
20
21
22
23
Average Area of high probability
USD/JPY Price movement range by hour of day
Hour of Day
Pips
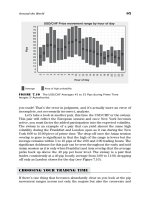
FIGURE 7.4 Traders Must Know the Most Volatile Hours of the Day
Images © Autochartist.
Frankfurt’s open doesn’t inject much volatility into the USD/JPY. Although
it is greater than the hours that preceded the European open, other than
economic events, notice that the Asian session doesn’t move the USD/JPY
that much. Here’s a one-month look back. Notice the activity increase at
2:00, 3:00 and 8:00, 9:00, and 10:00 not to mention the drop off from 10:00
to 11:00 as London winds down for the day (see Figure 7.4).
The fallacy of trading even what could be considered the most
traded pair that connects Asia to the United States is not that ac-
tive during the Asian session. When, if ever, do you want to trade the
Asian session? Here’s a tip, focus on sessions that are expecting economic
releases, refer to your calendar, and let that be your guide. Hear me out,
though! I am not talking about trading the news but rather the fact that
Asia only moves dramatically on news days. That is both a risk and reward
consideration.
Now let’s stay with a pair that is influenced by Asia, the largest cross-
rate, the EUR/JPY or euro-yen. Here we have a pair that trades against
the U.S. dollar and will most certainly be affected by Europe as it pits the
Japanese yen versus the euro. This pair will be affected by economic events
from both Asia and Europe and thus, will have two countries that can move
P1: OTA
c07 JWBT185-Horner October 24, 2009 19:6 Printer: Yet to come
Around the World 89
80
100
120
140
160
60
40
20
0
0
1
2
3
4
5
6
7
8
9
10
11
12
13
14
15
16
17
18
19
20
21
22
23
Average Area of high probability
EUR/JPY Price movement range by hour of day
Hour of Day
Pips
FIGURE 7.5 How Often Does the EUR/JPY Move More than 100 Pips an Hour?
Images © Autochartist.
it dramatically. It will be viable and active throughout two financial centers
and have a two-hour market overlap. But to truly see when the activity
takes place, we have to look at the pip movement before making any as-
sumptions (see Figure 7.5).
This is a one-month look-back at the EUR/JPY, and as you can see
the most volatile trading occurred at 10
A.M. EST, in the heart of, not the
Asian/European overlap, but rather the Europe/U.K. and U.S. overlap. How-
ever, don’t take my pointing out the most volatile times to mean that these
are the only times to trade. It’s simply that this is when the most partic-
ipation occurs with the most pip movement. Alternatively, trades taken
during, for example, from 1:00 to 7:00, would still be active but simply
with less pip movement, which as I mentioned is both a risk and reward
consideration.
Of course our old friend 23:00 is active as the Japanese economic
events affect the volatility of the pair. By and large, though, this pairs range
high exceeds 100 on just a handful of bars on the chart, meaning that during
these one-hour chunks in time, the movement can be 100 pips and some-
times more. So once again, even on a pair that seemingly would require
little U.S. opinion, the most active trading times are occurring right in the
P1: OTA
c07 JWBT185-Horner October 24, 2009 19:6 Printer: Yet to come
90 FOREX ON FIVE HOURS A WEEK
middle of the London/New York overlap. Focus not just on the range high
but the average, which is the dark band that represents the averages within
the overall high to low range.
Again, as we go through each one of these graphs, I don’t want you to
necessarily eliminate a trading time from your potential trading schedule,
but instead get a feel for when each pair does and does not move. Accord-
ingly, you can go about defining the most likely risk and reward scenarios
of the pairs and apply these to the time your trade triggers.
We can, of course, plop down in front of our computer whenever we
want, that is a personal choice, but in order to maximize the time spent in
front of the charts and make Forex in Five a reality we must know when
the pairs will move and we are likely to see follow-through. Timing is often
the folly of traders who attend a seminar and decide that a 24-hour market
means that there is always a trade occurring that is ripe for the picking.
While that may not entirely be untrue, good trades don’t come along every
minute of every day, and good traders know this. In the United States the
most common problem is the after-work trader. This puts most U.S based
traders in front of their PC in the beginning or middle of the Asian session.
Trades are placed in comparatively the thinnest session and then put to
the mercy of the 800-pound gorilla that awakes in Frankfurt and London.
What’s the lesson here? I am not saying you can’t trade Asia, but if you are
going to trade these hours when Sydney, Tokyo, Hong Kong, and Singapore
are active, place and exit your trades before 3
A.M. Unless you are going to
be up for the London open, you should likely be flat or well within the
positive side of your trade so you’re risking only profits and not capital.
Longer-term charts such as the 80, 240, and daily can be traded into the
European and U.K. session. This is because it is most likely that the market
cycle that developed to set-up the trade that was taken has, because of
the longer time frame, been influenced to a great degree by the U.S. and
the European/U.K. session, and is not simply an Asian session trade. Make
sense? That is one of the advantages of longer-term charts and why the
longer the time frame the more it represents the world view of a pair and
not just a handful of financial centers. This is precisely why I say the daily
chart is the most psychologically significant time frame: The range reflects
every financial center around the world in 24-hours.
What about a cross-rate pair that is based solely out of Europe like the
EUR/CHF? First, I want you to see that as pip movement ranges go, this is
one of the lower ranging but consistent movers throughout the day. I want
to offer here a word of caution regarding the cost per trade when it comes
to cross-rates. We pay the spread, that’s your cost per trade. You pay the
spread going in and going out because we buy at the seller’s price (also
known as the “ask”) and sell at the buyer’s price (the “bid”). Not all pairs
P1: OTA
c07 JWBT185-Horner October 24, 2009 19:6 Printer: Yet to come
Around the World 91
5
10
15
20
25
30
35
40
45
50
55
60
65
0
0
1
2
3
4
5
6
7
8
9
10
11
12
13
14
15
16
17
18
19
20
21
22
23
Average Area of high probability Download Data File
EUR/CHF Price movement range by hour of day
Hour of Day
Pips
FIGURE 7.6 The Average Pip Range in the EUR/CHF Is between 30 to 50 Pips
an Hour
Images © Autochartist.
trade with the same bid/ask spread, and the spread can change through-
out the day depending upon a number participation-based and volatility
standards as set by your broker. Economic events equal potentially high
volatility and higher spreads. Low participation can also increase the
spread. Know your cost per trade (see Figure 7.6).
The EUR/CHF (“euro-swissy”) is a European pair, in that each of the
currencies that make up the pair are European countries. Because the
EUR/CHF has the euro in the pair it has a worldwide appeal as many of
the pairs that trade against the euro do not seem to be affected by a lack
of “home country” participation. From 0:00 to 23:00 you can see that the
EUR/CHF trades with a typical average of between 30 or just over 45 pips
per hour. Notice that again, the highest high of the pip range still occurs
with the London/New York overlap. Compare this relatively sedate pair
with what is nicknamed the twister sister, the GBP/JPY.
Famous for eating newbie accounts with a single bite, the “pound-yen”
does indeed pound many trades into tears. The siren call is the high pip
range, the possibility for the killer trade that can yield upwards of 100 pips
in a very short amount of time (see Figure 7.7).
P1: OTA
c07 JWBT185-Horner October 24, 2009 19:6 Printer: Yet to come
92 FOREX ON FIVE HOURS A WEEK
80
100
120
140
160
180
60
40
20
0
0
1
2
3
4
5
6
7
8
9
10
11
12
13
14
15
16
17
18
19
20
21
22
23
Average Area of high probability
GBP/JPY Price movement range by hour of day
Hour of Day
Pips
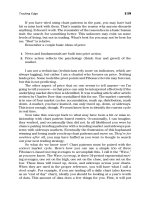
FIGURE 7.7 The Average Pip Range in the GBP/JPY Is between 70 to 115 Pips
an Hour
Images © Autochartist.
With an average per hour pip range of 70 to 115 pips, this is the high-
speed pair that is an account killer. Can you tame it with the help of some
timing and average pip movement analysis? Let’s take a look. We can dis-
sect its habits as we look at its behavior in the Asian session and then
during the overlap and then finally as the European and U.K. markets take
over. This type of time analysis can be done on any pair and should be
done on every pair you choose to trade. If we can take this bad boy of a
pair apart, we can do it with any pair.
First, let’s start with the Asian session, as that is the first group of fi-
nancial centers that will trade the pound-yen. On the graph we will focus
in on 18:00 as that is 6
P.M. EST and 8 A.M. in Tokyo, 9 A.M. in Sydney.
This is a solid market overlap between those two cities. As you can tell, it’s
rather quiet during these hours and if the market cycle is in a momentum
cycle, look to identify the ceilings and floors that could trigger a breakout
or breakdown once action livens up. So when will action liven up? Look to
Frankfurt and 2:00. Now the way you can best identify the expected volatil-
ity is not the high or low of the range but rather the average. Notice that
the average heads lower each hour from 10:00 to 12:00 and stays steady
P1: OTA
c07 JWBT185-Horner October 24, 2009 19:6 Printer: Yet to come
Around the World 93
from 12:00 to 15:00 before dropping off once again from 16:00 to 1:00 be-
fore increasing with Frankfurt’s open. From 2:00 to 3:00 there is a burst
that drops off with the end of the European/Asian overlap until again the
GBP/JPY ramps up going into the New York open where it really begins to
accelerate in volatility. Whether you look at a one-month, three-month, or
six-month look-back, the pip movement is greatest at 10:00.
What does all this tell us about how and when to trade this pair? First
we must expect that this pair will average over 70 pips per hour almost
every hour of the day. The quiet hours are actually at the end of the New
York session and in the early Asian session. Now, how can we use this
to manage any entry or exit? First, in terms of wiggle or how much the
pair can move around from hour to hour, that number is going to be high.
At a 70 pip average it is not for the short funded or faint of heart. Com-
pared to the USD/JPY, which averages between 25 and just over 50 pips
per hour throughout the day, it’s a high wire act. But when you look at
the cable (GBP/USD), which averages between 40 on the low end and 100
pips on the high end—again these are the averages not the total area of
probability—you can see that the GBP/JPY takes after the cable more so
than the dollar-yen (see Figure 7.8).
80
100
120
140
–20
60
40
20
0
0
1
2
3
4
5
6
7
8
9
10
11
12
13
14
15
16
17
18
19
20
21
22
23
Average Area of high probability
GBP/USD Price movement range by hour of day
Hour of Day
Pips
FIGURE 7.8 Average Pip Movement Range in the GBP/USD
Images © Autochartist.
P1: OTA
c07 JWBT185-Horner October 24, 2009 19:6 Printer: Yet to come
94 FOREX ON FIVE HOURS A WEEK
What does this chart tell you about the volatility of the pair called the
“twisted sister”? The GBP/USD consistently trades in a range of 40 pips or
more an hour.
In fact, directionally speaking, if you were overlaying the chart of the
GBP/USD over the GBP/JPY you would see that they move in tandem. This
is another layer of analysis that gives you insight into correlation and the
“one mind, many markets” philosophy I embrace to help me manage multi-
ple positions in the market. When you know that one pair is going to more
or less move with another, there are ways to manage both with ease, and
that is to understand intermarket correlations and also correlations to spe-
cific futures contracts. While this may initially seem like more work, like
anything, once you get the hang of it and work it into your daily routine,
the time it takes to keep an eye on key levels and market cycles of multiple
charts becomes much easier. You get a feel for them the more you watch
them and understand the pip movement ranges (see Figure 7.9).
Most traders do not have a problem trading GBP/JPY because it is an
awkward trading pair. It’s not. The problem lies in a lack of getting to know
what it is capable of and what it moves with. Placing stops too closely that
do not account for the wiggle or pip movement range that is particular
to this pair is a problem. You should make that adjustment for any pair
1.4500
1.4600
(GBP A0-FX - BRITISH POUND STERLING COMPOSITE,60) Dynamic,0:00-24:00
(GBPJPY A0-FX - BRITISH POUND STERLING/JAPAN YEN COMPOSITE)
1.4700
1.4785
1.4400
1.4300
1.4200
1.4100
02/03 02/04 02/05 02/06
FIGURE 7.9 The Correlation of the GBP/USD and the GBP/JPY
© eSignal, 2009.