How to Understand Business Finance, Second Edition_8 pptx
Bạn đang xem bản rút gọn của tài liệu. Xem và tải ngay bản đầy đủ của tài liệu tại đây (247.61 KB, 18 trang )
116 How to Understand Business Finance
VAT
Put very simply, we charge customers VAT on most sales and we
pay suppliers VAT on most purchases. At the end of each quarter we
pay Customs and Excise the balance, or claim it from Customs and
Excise if we have made more purchases than sales that attract VAT.
You might think that claiming back VAT is a good thing, until you
realise what it means – you are buying more than you are selling.
Indeed, a large VAT bill is a healthy sign; it means not only
that you are selling more than you are buying, but that the
diff erence in value is big – you are adding value, hence the name.
The only problem is that it can knock your cash fl ow for six.
VAT can be a nightmare for people still doing their accounts
manually, though in principle the record of VAT is no more than
another column in the sales and purchase ledgers. Modern
software makes it very easy. When entering each transaction the
appropriate VAT code is nominated and the computer does the
rest. At the quarter end, at the press of a button the machine tells
you how much you owe, or how much to claim.
We said above that we charge customers VAT on most sales and
we pay suppliers VAT on most purchases. There are exceptions to
this, and without going into it in great detail, here are a few examples:
There are a few purchases that are not subject to VAT, eg •
books, some printed materials, travel, insurance, food
(but not from restaurants) and children’s clothes.
There are some suppliers who are not big enough, in •
turnover terms, to have to charge VAT. They are not VAT
registered.
If goods or services are delivered in the EU, VAT does not •
have to be charged so long as the supplier is in possession
of the client’s VAT registration number. There are some
complexities around this but the general statement is
correct.
If goods or services are supplied outside the EU, VAT is •
not applicable.
117 The Hidden Costs – Depreciation, Amortisation and Tax
It is important to realise that VAT does not feature in, or aff ect in any
way, the P&L account. The only eff ect it has on the running of the
business involves cash fl ow. If a company is trading mainly in the
one country and has sold more than it has purchased (ie added
value), a bill is building up, and when it is due to be paid the cash
has to be found.
A business that forgets this fact is in for a nasty surprise. Small
businesses in particular, and those in the catering trades more than
any other, fall foul of this lapse of memory. Ever wondered why that
nice little restaurant that opened up a little while back just closed
and went overnight? It could be that their fi rst VAT bill arrived.
Pay As You Earn (PAYE) and National
Insurance (NI)
Most people know enough about PAYE and NI as they aff ect their
incomes. Many do not know about employer’s NI, or realise that
on all salaries, bonuses etc the company pays about 12 per cent
extra NI that the employee never sees. There is also a complex
employer’s NI situation with regard to company cars and other
benefi ts – another hidden cost to the company.
When the salaries and wages are shown in the P&L they are gross
fi gures including all PAYE and NI paid by employees and employers.
Corporation tax
Again viewed very simply, at the end of a fi nancial year when a
company has made a profi t, corporation tax is due to be paid. The
rate is in the region of 20–25 per cent (depending on the size of the
company etc) and the cash has to be handed over to the Inland
Revenue about nine months after the end of the fi nancial year. Great,
you get to hang on to it for nine months, but be very certain that you
don’t forget – the shock of this one to your cash fl ow can be terminal.
If a company makes a loss then no tax is due and in principle
the loss can be used to off set taxable profi t in other years.
118
THIS PAGE IS INTENTIONALLY LEFT BLANK
11
What must we sell to make a
profi t?
We are about to consider a tool known as a break-even analysis,
but before we do this we need to clarify some more bits of
terminology. The break-even analysis deals with costs, split by
accountants into what they call ‘fi xed’ and ‘variable’. Don’t try
applying the dictionary defi nitions of these words; we must
remember that accountants use words in some strange ways.
However, it is well worth getting to grips with what they do mean
by these words, as the resultant tool is very powerful.
Variable costs
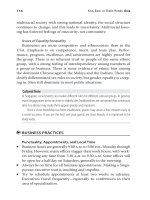
Accountants defi ne a variable cost as one that behaves as shown
in Figure 11.1.
Variable costs increase in proportion to units sold. A vital ‘acid
test’ of a truly variable cost is one where, if there are no sales, you
have no costs reported in the P&L account.
A good example of this involves raw materials. The cost of these
goods is only reported in the P&L account when they are sold, not
when purchased, or indeed converted into saleable fi nished goods.
119
120 How to Understand Business Finance
0
10
20
30
40
50
60
70
0246810
Units of sales
Costs (£000)
Variable costs
Figure 11.1 Variable costs
When is a cost a cost?
If you buy raw materials from which to manufacture your
own product, then the cost of those materials is not
registered on the P&L until your product is sold. This is true
of any variable cost, a cost that is proportional to the volume
of sales. If you make no sales in a year, the P&L will show no
variable costs.
But, of course, you have paid for these materials, with
real cash, so they have to be registered somewhere –
entered on the balance sheet. The balance sheet will show
these materials as an asset, under ‘stocks’.
Clearly, there is a cost to this stock, but it appears in the balance
sheet and is only realised into the P&L account when you sell it.
Further examples of variable costs are packaging (for distribution
to customers), freight (to customers), commissions and import/
export duties.
121 What must we Sell to make a Profi t?
If in doubt about whether a cost is variable, ask yourself, ‘Does
this cost go up the more I sell, and if I sell nothing do I have no
costs (in the P&L account)?’ If it does not meet these criteria, it is
not a variable cost.
Fixed costs
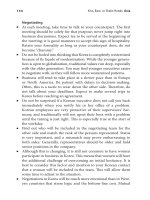
Beware – the accountant defi nes a fi xed cost as anything that is
not a variable cost! In other words, if it does not meet the criteria
above, it is a fi xed cost. This is a prime example of confusing
jargon, where words don’t mean what they appear to; your
advertising bill may go up and down, month by month, but it is a
fi xed cost. The unit cost of your raw materials may be stable for
years on end, but raw materials will be a variable cost. Figure 11.2
is a graph showing fi xed costs.
Fixed costs only behave like this over a limited range of values
– for instance, rent may be the same whether you have an offi ce
full or empty, but if you need to rent a second offi ce to hold more
staff , the rent will go up to a new ‘fi xed’ level.
0
10
20
30
40
50
60
70
0246810
Units of sales
Costs (£000)
Fixed costs
Figure 11.2 Fixed costs
122 How to Understand Business Finance
Controllable/non-controllable costs
There are two categories of fi xed costs: those that really are fi xed (for
the moment, in any case) and those that might vary. Accountants
call the fi rst group non-controllable or non-discretionary costs. The
fi xed costs that might vary, or, as an accountant would prefer to say,
those that can be managed, are termed controllable or discretionary.
Examples of discretionary costs include promotion, overtime,
additional storage, temporary staff costs, maintenance, research
and development, and training. These costs can be managed – we
have choices about whether to spend this money or not.
Non-controllable costs are those we incur irrespective of sales
activity and include wages, heating and lighting, rent, lease costs
and breakdown maintenance.
Because the term ‘fi xed’ implies that you cannot change
this cost, Americans prefer to use the term ‘expenses’. We
all know that you can manage expenses whereas there can
be a mental block about reducing things which are ‘fi xed’!
Break-even point
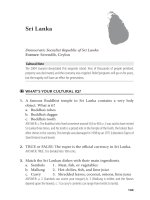
Once we have determined our fi xed and variable costs we can plot
a break-even chart as shown in Figure 11.3.
Notice that in constructing this graph we stack the variable
costs on top of the fi xed costs such that this line now represents
total costs. Finally, we plot a line showing sales income at a given
price (in this example it is £7,000 per unit).
Having constructed the chart, we must now make sense of it.
First, where the sales income line crosses the total cost line is our
break-even point. In this case it is at four units. If our capacity were
just six units you can see that all the profi t is made on the last two
123 What must we Sell to make a Profi t?
0
10
20
30
40
50
60
70
012345678910
Units of sales
Value (£000)
Fixed cost Total cost Sales @ 7 per unit
Figure 11.3 Break-even chart
units we sell. The fi rst four units simply cover our costs, and once
we have done this, anything more we sell generates us a profi t.
Drawing a break-even chart also allows you to understand the
key fi nancial levers driving your business, as the two examples
below demonstrate.
High fi xed costs
Once you’ve created a break-even chart, the fi rst thing to do is to
compare the level of fi xed costs with the variable costs and decide
which is the bigger. So, for instance, in the example shown in
Figure 11.4 is quite clear that the fi xed costs are very much higher
than the variable costs. This could be the situation in a bulk
manufacturing business where the raw material costs are quite
low compared to the costs of wages, depreciation, maintenance,
sales and technical support etc.
In this case, shown below, the break-even point is now just
below seven units. Every additional unit sees a huge jump in
profi t. At seven units we generate a profi t of £2,000. An extra unit
of sales (14 per cent increase in sales) produces a huge 300 per
cent improvement in profi t to £8,000. Thus, if your fi xed costs
exceed your variable costs, volume is a key driver for your
business, and control of your fi xed costs is also critical.
124 How to Understand Business Finance
0
10
20
30
40
50
60
70
01234567891
0
Units of sales
Value (£000)
Fixed cost Total cost Sales @ 7 per unit
Profit
Figure 11.4 Break-even chart – high fi xed costs
High variable costs
If your variable costs are signifi cantly higher than your fi xed costs,
your break-even chart might look like the example shown in
Figure 11.5. This might occur if you are buying in fi nished goods
and reselling them, or you act as a distributor for others. In this
way you only really incur major costs when you make a sale (as,
for instance, with a travel agent, who only has the cost of a holiday
if they sell you the trip).
The dynamic of the business shown in Figure 11.5 is very
diff erent to that in the earlier example. If we discount our selling
price by just 7 per cent from £7,000 per unit to £6,500 we must sell
almost three units more (a 60 per cent increase in sales) just to
cover our costs. So, if your variable costs exceed your fi xed costs
then price is a key driver for your business, and so is control of your
variable costs.
For this type of business, we must look beyond the obvious
variable costs of production. Often it is sales commissions, credit
card collection fees, insurance or freight charges that can have a
big impact on overall profi tability. Small improvements to these
costs can make a big diff erence to the bottom line. This explains
125 What must we Sell to make a Profi t?
0
10
20
30
40
50
60
70
01234567891
0
Units of sales
Value (£000)
Fixed cos t Total cos t Sales @ 7 per unit Sales @ 6.5 per unit
Sales at 7 per unit
Sales at 6.5 per unit
Figure 11.5 Break-even chart – high variable costs
why companies like easyJet charge for credit card payments,
telephone bookings etc.
Uses of a break-even chart
The construction of a break-even chart is just the fi rst step. In
managing a business for better profi ts the graph suggests four
options:
Reduce fi xed costs.•
Reduce variable costs.•
Increase selling price.•
Increase volume of sales.•
While all these options will have an impact on the bottom line,
which of these actions is most eff ective depends on the dynamic of
your business. You can test the sensitivity of your business to each
parameter to understand the key drivers for your profi tability.
The break-even chart also provides a ready reckoner for what
percentage of your business covers your costs, and how much
safety margin you have. In other words, how much volume of
sales can you lose, and still stay profi table?
126 How to Understand Business Finance
Or, if your prices come under pressure from competitors,
how low can you let them go, and still make the profi t you want
to achieve?
12
Tools for evaluating projects
When considering investing in a project, it is important to bear in
mind that money to be had sometime in the future is not worth as
much as the same money held today. This is not just about
infl ation, or interest rates, but also about what else the money
could be invested into, making a return for you.
So, if we had £100 to invest today at a return of 30 per cent,
Table 12.1 shows how we might expect it to grow in value if we
continued to reinvest the full sum of money year after year. By
Year 6, our £100 would have grown in value to £371.
This disparity in the value of money is known as the
opportunity cost, or why the ‘bird in the hand’ really is ‘worth two
in the bush’… We will now examine a number of tools for making
our calculations a little more precise than that!
Table 12.1 Investing £100 at 30 per cent return
Year
Growth at 30% 1 2 3 4 5 6
Value of investment 100 130 169 220 286 371
127
128 How to Understand Business Finance
Payback
Suppose you could invest in a project with the cash fl ows shown
in Table 12.2.
Thus, if you were to make the initial investment of £150,000
in Year 1, not only would you recover this, but in cash terms you
would generate £250,000 on top of this by Year 6. The payback is
the time it takes to recover the investment purely in cash terms. In
this case it would be two and a half years (ie at Year 3.5).
Discounted cash fl ow (DCF)
We now have to consider what to discount the cash by to refl ect the
fact that money earned in the future is worth less than cash today
because of the opportunity cost. Let’s assume that we could get a 30
per cent return on money we invested in our business. The discount
rate that we will therefore use for this example is 30 per cent.
To discount the cash fl ows, we must fi rst calculate a discount
factor to apply in each year of the cash fl ows. For instance, in Year 2,
£100 would be worth 100/130 times its initial value – £77 in Year 1’s
money. This assumes that if we had the money in Year 1 we could
invest it at 30 per cent so that by Year 2 it was worth £100. In Year 3 £100
would be worth £77 times 100/130, or £59 in Year 1’s money, and so on.
The DCF would look like that shown in Table 12.3.
Note that DCF is a series of fi gures over a period of time
discounted at a particular rate to refl ect opportunity costs.
Table 12.2 Cash fl ows showing payback
Year
£000 1 2 3 4 5 6
Cash fl ows (150) 50 50 100 100 100
Cumulative cash fl ows (150) (100) (50) 50 150 250
129 Tools for Evaluating Projects
Table 12.3 Discounted cash fl ow
Discount rate 30% Year
£000 1 2 3 4 5 6
Cash fl ows (150) 50 50 100 100 100
Discount factor (100/130) 1.00 0.77 0.59 0.46 0.35 0.27
Discounted cash fl ow (150) 39 30 46 35 27
Cumulative discounted
cash fl ow
(150) (111) (81) (35) 0 27
Net present value (NPV)
By adding up the DCF we arrive at a fi gure of £27,000 in Year 6.
This means that not only will the project make a 30 per cent return
(the amount by which we have discounted the cash fl ows), but in
Year 6 it will generate cash of £27,000 in today’s money. This
cumulative DCF is known as net present value (NPV).
NPV is the sum of a series of cash fl ows over a given number
of years, discounted at a particular rate to refl ect opportunity cost.
When comparing NPVs from several projects, remember to check
the discount rate applied, and the number of years of cash fl ows
taken into account.
Internal rate of return (IRR)
The internal rate of return of a project is the discount rate which
must be applied to reach an NPV of zero in a given number of
years. Thus the IRR for the above project after fi ve years is 30 per
cent – the discount rate used to get an NPV in Year 5 of zero.
If a discount rate of less than 30 per cent had been used, the
NPV in Year 5 would be greater than zero. Equally, if a rate
130 How to Understand Business Finance
higher than 30 per cent had been used, the NPV would still be
negative in Year 5.
An important consideration when comparing IRRs between
projects is to be aware of the number of years of cash fl ows that is
being used in the calculation.
Lastly, there is a concept called modifi ed internal rate of
return (MIRR). A fl aw in using IRR is that it assumes that you can
reinvest positive cash fl ows at the same internal rate of return.
This is not always true. MIRR allows you to set a rate that the
model uses to reinvest these positive cash fl ows.
Terminal values
As can be seen from the discounted cash fl ow example, money
earned in the future is worth less and less in today’s money as
time goes on. At some point, money earned in the future is worth
nothing in today’s currency. Thus, there are calculations that can
be done (or produced on a spreadsheet) which consider the
terminal value of a project if it continues to generate the same
cash fl ow year after year into the future.
Economic profi t
An alternative approach for evaluating a project is to consider the
economic profi t generated over its life. To do this, a charge is
taken for the capital tied up in the project. This may include the
fi xed assets purchased and the additional working capital
(ie additional stock, debtors and creditors) created in doing the
project.
We take this capital charge and any resultant taxation from
the operating profi t generated by the project to arrive at the
economic profi t in a similar way to that described in Chapter 9.
These economic profi ts, generated each year through the life of
the project, could then be discounted as above to reach an NPV for
the economic profi t in today’s money.
131 Tools for Evaluating Projects
Pitfalls
It can be dangerous to rely on fi gures produced for you, without
knowing a little background to the project being appraised. Here
are some thoughts:
How reliable are the cash fl ow forecasts?•
What timescale has been assumed for the project and why? •
Is there a sales contract life that can be used?
Have infl ation, exchange rates and future changes in costs •
been taken into account in calculating project cash fl ows?
What pricing and volume assumptions lie behind income •
streams?
What discount rate has been used and why?•
Clearly, all these factors can infl uence the numbers produced for a
project.
Other factors
This chapter has focused on the fi nancial analysis of a project. It is
wise to consider non-fi nancial aspects such as commercial,
production, safety, environmental and technical risk. These can
be quantifi ed, and using the technique known as the Balanced
Scorecard a weighted score for a project can be calculated – see
Chapter 8.
132
THIS PAGE IS INTENTIONALLY LEFT BLANK
13
Where is all our cash?
Managing working capital
When business improvements are sought, we are often asked to
manage our working capital more closely. This is because of all the
monies tied up in a company, it is only the working capital that can
be managed on a day-to-day basis. The fi xed assets such as land, plant
and machinery can be revalued on a one-off basis but this cannot be
done every time we are looking to improve business performance!
Also, while revaluing assets may produce a paper profi t or
loss, it does nothing to generate cash unless we sell part or all of
these items. Managing working capital on the other hand can
generate or consume cash.
You will recall from earlier chapters that working capital is made
up of three main elements – stocks, debtors and creditors – and these
will be considered in turn. Clearly, a service-based organisation has
minimal stocks, and so the focus must be on debtors and creditors.
Stock (inventories)
Stock is generally made up of three elements which we will now
consider in turn:
133