Pearson Education Management Accounting for Decision Makers_10 ppt
Bạn đang xem bản rút gọn của tài liệu. Xem và tải ngay bản đầy đủ của tài liệu tại đây (949.31 KB, 38 trang )
Strategic management accounting is concerned with providing information that will
support the strategic plans and decisions made within a business. We saw in Chapter 1
that strategic planning involves five steps:
1 Establishing the mission and objectives of a business.
2 Undertaking a position analysis, such as a SWOT (strengths, weaknesses, opportun-
ities and threats) analysis, to establish how the business is placed in relation to its
environment.
3 Identifying and assessing the possible strategic options that will lead the business
from its present position (identified in Step 2) to the achievement of its objectives
(identified in Step 1).
4 Selecting the most appropriate strategic options (from those identified in Step 3) and
formulating long- and short-term plans to pursue them.
5 Reviewing business performance and exercising control by assessing actual perform-
ance against planned performance (identified in Step 4).
To some extent, conventional management accounting already supports this stra-
tegic process. We have seen in Chapter 7, for example, how budgets can be used to
compare actual performance with earlier planned performance. We have also seen in
Chapter 8 the role of investment appraisal techniques in evaluating long-term plans.
Nevertheless, there is scope for further development. It can be argued that if manage-
ment accounting is fully to support the strategic planning process, it must develop in
three broad areas:
l It must become more outward looking. There is general agreement that the conven-
tional approach to management accounting does not give enough consideration to
external factors affecting the business. These factors, however, are vitally important
to strategic planning and decision making. For example, we need to understand
the environment within which the business operates when we are undertaking
a position analysis or when we are formulating plans for the future. Management
What is strategic management accounting?
CHAPTER 9 STRATEGIC MANAGEMENT ACCOUNTING
318
LEARNING OUTCOMES
When you have completed this chapter, you should be able to:
l Discuss the nature and role of strategic management accounting.
l Explain how management accounting information can help a business gain a
better understanding of its competitors and customers.
l Describe the techniques available for gaining competitive advantage through
cost leadership.
l Explain how the balanced scorecard can help monitor and measure progress
towards the achievement of strategic objectives.
l Discuss the role of shareholder value analysis and economic value added in
strategic decision making.
M09_ATRI3622_06_SE_C09.QXD 5/29/09 3:32 PM Page 318
accounting can play a useful role here by providing information relating to the envir-
onment, such as the performance of the business’s competitors and the profitability
of its customers.
l There must be greater concern for developing and implementing methods through which a
business can outperform the competition. In a competitive environment, a business
must be able to gain an advantage over its rivals, so that it can survive and prosper
over the longer term. Competitive advantage can be gained in various ways and one
important way is through cost leadership: that is, the ability to produce products or
services at a lower cost than that of other businesses. Although conventional manage-
ment accounting provides a number of cost determination and control techniques
to help a business operate more efficiently, these techniques are not always enough.
Rather than seeking simply to count and manage the costs incurred, costs and cost
structures may need to be transformed. Thus, management accounting has a role to
play in helping to shape the costs of the business to fit the strategic objectives.
l There must be a concern for monitoring the strategies of the business and for bringing these
strategies to a successful conclusion. This means that management accounting should
place greater emphasis on long-term planning issues and on developing a compre-
hensive range of performance measures to try to ensure that the objectives of the
business are being met. The objectives of a business are often couched in both finan-
cial and non-financial terms and so the measures developed must reflect this fact.
Let us now turn our attention to the ways in which management accounting can
help in each of the three areas identified.
If a business is to thrive, it needs to have a good understanding of the environment
within which it operates. In particular, it should have a good understanding of the
threat posed by its competitors and the benefits obtained from its customers. There is
a strong case for reporting certain information relating to competitors and customers,
frequently and routinely to managers. By so doing, managers can respond more
quickly to any changes in the environment that may occur. In this section we consider
some of the techniques and measures that may help managers gain a better under-
standing of these two important groups.
Competitor analysis
To compete effectively, a business needs to acquire a sound knowledge of its main
competitors. As well as helping in strategic planning, this knowledge can also help in
pricing and business acquisition decisions. When appraising competitors, a business
needs to understand
l what strategies and plans they have developed;
l how they may react to the plans the business has developed; and
l whether they have the capability to pose a serious threat to the business.
To gain this understanding, a careful analysis of each main competitor should be
carried out.
To illustrate the benefits of competitor analysis, let us say that a business proposes
to reduce its sales prices by 10 per cent. What would be the reaction of competitors?
Facing outwards
FACING OUTWARDS
319
‘
M09_ATRI3622_06_SE_C09.QXD 5/29/09 3:32 PM Page 319
Would this reduction be matched by them and thereby cancel out any advantage to be
gained? Would it lead to a price war where sales prices follow a downward spiral? If
competitors could not match the price reduction, would they be able to continue to
supply, given the likely sales volume reduction that they would suffer? We can see that
the proposal to reduce prices cannot be fully evaluated until competitors’ likely reac-
tion to the proposal is known.
Real World 9.1 provides an example of how one business came to realise that it had
to pay more attention to the competition.
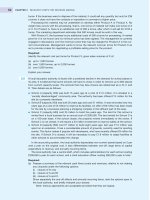
To find out what drives a competitor and how it might act, four key aspects of its
business must be analysed. These are:
1 Objectives. Where is the competitor going? In particular, what are its profit objec-
tives, what rate of sales growth is it trying to achieve, what market share does it seek?
2 Strategies. How does the competitor expect to achieve its objectives? What invest-
ments are being made in new technology? What alliances and joint ventures are
being created? What new products are to be launched? What mergers and acquisi-
tions are planned? What cost reduction strategies are being developed?
3 Assumptions. How do the competitor’s managers view the world? What assumptions
are held about
l future trends within the industry;
l the competitive strengths of other businesses; and
l the feasibility of launching into new markets?
4 Resources and capabilities. How serious is the potential threat? What is the compet-
itor’s scale and size? Does it have superior technology? Is it profitable? Does it have
a strong liquidity position? What is the quality of its management?
These four features provide the framework for analysing competitors, as shown in
Figure 9.1.
Gathering information to answer the questions posed above is not always easy.
Businesses are understandably reluctant to release information that may damage their
competitive position. Nevertheless, there are sources of information that can be used.
We shall now consider some of these and, given the management accounting focus of
CHAPTER 9 STRATEGIC MANAGEMENT ACCOUNTING
320
REAL WORLD 9.1
Angling for recovery
House of Hardy is a world-famous manufacturer of fishing rods and tackle. It enjoys an
unrivalled reputation for its products and has a highly skilled workforce. In recent years,
however, it has experienced problems, which have been partly caused by global competi-
tion. The business is trying to recover and, in analysing its past mistakes, has recognised
that it has been rather too complacent in its approach to competitors. As part of its recov-
ery plan it is now paying much more attention to what they are doing. It is now analysing
the products offered by competitors and reviewing its own pricing policies in an attempt
to compete more effectively.
Source: Based on information from ‘How Hardy lost the lure of heritage’, ft.com, 1 December 2003.
FT
M09_ATRI3622_06_SE_C09.QXD 5/29/09 3:32 PM Page 320
this book, will concentrate on those sources providing information about the financial
resources and capabilities of competitors.
A useful starting point is to examine a competitor’s annual report. In the UK, all lim-
ited companies are legally obliged to provide information about their business in an
annual report that is available to the public. Similar provisions relate to limited com-
panies in most countries in the world. The income statement, cash flow statement and
statement of financial position (balance sheet) found in the annual report of a com-
petitor can be examined to gain insights about its financial performance and position.
Financial ratios may be used to help gain an impression of the profitability, liquidity,
efficiency and financing arrangements of the business. Trends may be detected over
time and particular strengths and weaknesses identified.
Where the competitor is not the whole business, but simply an operating division,
the annual reports are likely to be less helpful. This is because the results of the relev-
ant division will normally be obscured as a result of its aggregation with the rest of
the competitor’s operations. Though large businesses operating as limited companies
must publish some information about the sales revenues and profits of their various
operating divisions, this is often not enough to enable a full picture of the competitor
to be built up. Nonetheless, a competitor’s annual report should still offer some
useful information. Furthermore, a business will have detailed knowledge of its own
profitability, liquidity, efficiency and so on, which may well help in compiling a pic-
ture of the competitor’s position.
It may be possible to gain other information from both published and unpublished
sources. This could be from
l press coverage of the competitor’s business;
l statements by managers made at conferences or on the competitor’s website;
FACING OUTWARDS
321
Framework for competitor analysis
Figure 9.1
There are four key aspects of a competitor that should be examined.
M09_ATRI3622_06_SE_C09.QXD 5/29/09 3:32 PM Page 321
l house journals, brochures and catalogues produced by the competitor;
l market share data and discussions with financial analysts;
l discussions with customers who trade both with the business and with the competitor;
l discussions with suppliers to both the business and its competitor;
l physical observation, such as insights from ‘mystery shopping’;
l detailed inspection of the competitor’s products and prices;
l industry reports; and
l government statistics on such matters as the total size of the market.
By examining such sources, it may be possible to deduce likely capital investments,
acquisitions, promotional campaigns, new products and prices, cost structures and
so on. It is worth mentioning that specialist agencies can be employed to provide a
profile of competitors. These agencies normally rely on the kind of information sources
described above.
Of particular value to the business is knowledge of its competitors’ cost structures
in terms of the extent to which costs are fixed and variable. This would enable the
business to make some estimate of the effect on the competitors’ profit of an increase
or decrease in sales volume. This might, in turn, enable the business to assess how well
placed each competitor might be to react to a change in sales volume and/or sales
price. For example, a competitor with a high level of fixed costs (high operating gear-
ing) and, consequently, a low margin of safety may not be able to withstand a down-
turn in sales volume as comfortably as another business with lower operating gearing.
Real World 9.2 concludes this section by revealing that many businesses are not alert
to the moves made by competitors and so fail to gain competitive advantage.
CHAPTER 9 STRATEGIC MANAGEMENT ACCOUNTING
322
REAL WORLD 9.2
Too little, too late
A global survey of 1,825 business executives by McKinsey, the management consultants,
found that businesses were not as active as they should be in responding to competitive
threats or monitoring the behaviour of competitors. The survey asked executives how their
businesses responded to either a significant change in prices or to a significant change in
innovation. The answers of executives were strikingly similar across regions and industries.
A majority of executives stated that their businesses found out about the competitive
move too late to respond before it hit the market. Thirty-four per cent of those facing an
innovation threat and 44 per cent of those facing a pricing change said that they found out
about the competitors’ moves either when they were announced or when they actually hit
the market. An additional 20 per cent of the respondents facing a price change didn’t find
out until it had been in the market place for at least one or two reporting periods.
These findings suggest that businesses are not conducting an ongoing, sophisticated
analysis of their competitors’ potential actions. That view was supported by the execu-
tives’ responses to questions on how they gather information about what competitors
might do. Executives most often said that they track information using news reports,
industry groups, annual reports, market share data and pricing data. Far fewer respon-
dents obtained information from more complex sources such as detailed examination of
the products or mystery shopping.
Source: Adapted from ‘How companies respond to competitors: a McKinsey global survey’, mckinseyquarterly.com, May 2008.
M09_ATRI3622_06_SE_C09.QXD 5/29/09 3:32 PM Page 322
Customer profitability analysis
Businesses wish to attract and retain customers that produce profitable sales orders. It
is, therefore, important to know whether a particular customer, or type of customer,
generates profits for the business. Modern businesses are likely to find that much of the
cost incurred is not related to the products sold but to the selling and distribution costs
associated with those sales. This has led to a shift in emphasis from product profitabil-
ity to customer profitability.
Customer profitability analysis (CPA) assesses the profitability of each customer or
type of customer. In order for CPA to be undertaken, the total costs associated with sell-
ing and distributing goods or services to particular customers must be identified. These
include the cost of
l Handling orders from the customer. This covers the costs involved with receiving the
order and activities relating to it up to the point where the goods are despatched,
or the service rendered, including the costs of raising invoices and other accounting
work.
l Visiting the customer by the business’s sales staff. Many businesses have a member of
staff visit customers, perhaps to take orders, but often to keep the customer up to
date with the latest developments in the business’s products.
l Delivering goods to the customer, using either a delivery service provided by another
business, or the business’s own transport. Naturally, the distance involved and the
size and fragility of the goods will have an effect on this cost.
l Inventories holding. Some customers may require a particular level of inventories
to be held by the business: for example, a customer operating a ‘just-in-time’ raw
material delivery policy. This can require deliveries to be made frequently and at
short notice, in effect putting pressure on the supplier to hold higher inventories
levels. (We shall discuss ‘just-in-time’ inventories management in more detail in
Chapter 11.)
l Offering credit. The business will have to finance any credit allowed to its customers.
This could vary from customer to customer, depending on how promptly they pay.
l After-sales support. Technical assistance or servicing may be offered as part of the
sales agreement.
These customer-related costs are probably best determined using an activity-based
costing approach to cost allocation. This means that, once customer-related costs are
identified, cost drivers must be established and appropriate cost driver rates deduced.
FACING OUTWARDS
323
‘
Imam plc identified the following costs relating to its customers:
l Order handling
l Invoicing and collection
l Shipment processing
l Sales visits
l After-sales service.
Suggest a possible cost driver for each of the items identified.
Activity 9.1
‘
M09_ATRI3622_06_SE_C09.QXD 5/29/09 3:32 PM Page 323
Once customer-related costs are derived, a CPA statement, which is essentially an
abbreviated income statement, can be produced for each customer and/or type of
customer. The CPA statement will show the relevant sales revenues and, in addition
to the customer-related costs identified earlier, will include the basic cost of creating
or buying-in the goods or services supplied (that is, cost of goods sold) and any
general selling and administration costs of the business. Example 9.1 illustrates a CPA
statement.
CHAPTER 9 STRATEGIC MANAGEMENT ACCOUNTING
324
Imam plc – CPA statement for December
Customer
A plc B plc C plc D plc
£000 £000 £000 £000
Sales revenue 125 75 80 145
Cost of goods sold (87) (52) (56) (101)
Gross profit 38 23 24 44
General selling and administrative costs (19) (11) (12) (22)
Customer-related costs
Order handling (4) (2) (2) (4)
Invoicing and collection (4) (2) (2) (4)
Shipment processing (6) (4) (4) (8)
Sales visits (7) (1) (1) (2)
After-sales service (6) – (1) –
Profit/(loss) for the month (8) 3 2 4
Where all customers are sold products at the same price, the top part of the CPA
statement, which is concerned with deducing the gross profit, may be viewed as
relating to product profitability. The bottom part of the CPA statement, which is
the part below the gross profit figure, may be viewed as relating to customer
profitability.
To analyse customer profitability, we can express each of the costs found in this
part as a percentage of gross profit. The following table provides the results.
Example 9.1
We thought of the following:
Customer-related cost Possible cost driver
Order handling Number of orders placed
Invoicing and collection Number of invoices sent
Shipment processing Number of shipments made
Sales visits Number of sales visits made
After-sales service Number of technical support visits made
These are only suggestions. Other factors may be found that drive each cost.
Activity 9.1 continued
M09_ATRI3622_06_SE_C09.QXD 5/29/09 3:32 PM Page 324
FACING OUTWARDS
325
Customer
A plc B plc C plc D plc
%%%%
Gross profit 100.0 100.0 100.0 100.0
General selling and administrative costs 50.0 47.8 50.0 50.0
Customer-related costs
Order handling 10.5 8.7 8.3 9.1
Invoicing and collection 10.5 8.7 8.3 9.1
Shipment processing 15.8 17.4 16.7 18.2
Sales visits 18.4 4.3 4.2 4.5
After-sales service 15.8 – 4.2 –
Profit/(loss) for the month (21.0) 13.0 8.3 9.1
100.0 100.0 100.0 100.0
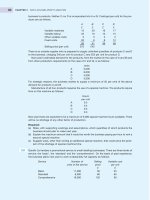
The information generated shows that one customer, A plc, is generating a loss.
To find out whether this is a persistent problem, trend analysis can be undertaken
which plots the customer-related costs as a percentage of gross profit over time.
An example of a trend analysis for A plc is shown in Figure 9.2.
Trend analysis for A plc
Figure 9.2
The trend in customer-related costs is shown as a percentage of gross profit for A plc,
the loss-making customer.
M09_ATRI3622_06_SE_C09.QXD 5/29/09 3:32 PM Page 325
In practice, it is often the case that a small proportion of customers generate a large
proportion of total profit. Where this occurs, the business may decide to focus its mar-
keting and customer support efforts on these customers. The less profitable customers
may then be targeted for price increases or, perhaps, reduced customer support, as we
saw in Activity 9.2 above.
Where a business has many customers, the analysis of individual customers’
profitability may not be feasible. In such a situation, it may be better to categorise cus-
tomers according to particular attributes and then to assess the profitability of each cat-
egory. Thus, the support services division of one large computer business divides its
customers into three categories based on technical capabilities, how they use the prod-
uct and the type of service contract they have (see reference 1 at the end of the chapter).
However, identifying appropriate categories for customers can sometimes be difficult.
Real World 9.3 provides some impression of the extent and frequency to which cus-
tomer profitability is assessed in practice.
CHAPTER 9 STRATEGIC MANAGEMENT ACCOUNTING
326
What steps might be taken to deal with the problem of A plc?
The problem appears to be the cost of both sales visits and technical support visits for A
plc. They are much higher than for those of other customers, whereas other customer-
related costs, when expressed as a percentage of gross profit, are broadly in line with the
other three customers. The cost of sales visits and technical support visits have shown a
persistent rise over time and do not appear to be due to a unique factor such as the sale
of faulty goods. In view of this, the managers may decide to cut down on the number of
sales and technical visits or to charge for them, perhaps through increased prices.
Activity 9.2
REAL WORLD 9.3
CPA in practice
A survey by Tayles and Drury, which elicited responses from 185 management account-
ants in UK businesses, gives some insight into the extent and frequency of customer pro-
fitability analysis. The key findings are shown in Figure 9.3.
M09_ATRI3622_06_SE_C09.QXD 5/29/09 3:32 PM Page 326
Many businesses try to compete on price: that is, they try to provide goods or services
at prices that compare favourably with those of their competitors. To do this success-
fully over time, they must also compete on costs: lower prices can only normally be
sustained by lower costs. A strategic commitment to competitive pricing must there-
fore be accompanied by a strategic commitment to managing the cost base.
In Chapter 5 we saw that, to manage costs in an active way, new forms of costing
have been devised. Some of these new costing techniques reflect a concern for long-
term cost management and so fall within the broad scope of strategic management
accounting. Total life-cycle costing, target costing and kaizen costing provide three
examples. In this section, we shall briefly review these forms of costing and then go on
to consider other ways in which costs may be strategically managed.
Competitive advantage through cost leadership
COMPETITIVE ADVANTAGE THROUGH COST LEADERSHIP
327
We can see that there are wide variations to be found in practice. Whereas nearly half
the respondents undertake CPA on a monthly basis, nearly a quarter do not undertake
CPA analysis at all.
Source: Based on information in Tayles, M. and Drury, C., ‘Profiting from profitability analysis?’, University of Bradford Working Paper
series No. 03/18, June 2003, p. 8.
Extent and frequency of customer profitability analysis
Figure 9.3
Approximately three-quarters of respondents indicated that CPA was undertaken, with a
monthly analysis being the most common.
M09_ATRI3622_06_SE_C09.QXD 5/29/09 3:32 PM Page 327
Total life-cycle costing
We saw in Chapter 5 that total life-cycle costing draws management’s attention to the
fact that it is not only during the production phase that costs are incurred. Costs begin
to accumulate at earlier phases, such as design, development and setting up the pro-
duction process. (For some businesses, such as pharmaceutical businesses, these early-
phase costs may represent a high proportion of the total costs incurred.) Furthermore,
costs continue to accumulate after production, such as those relating to distribution
and after-sales service. In certain cases there may also be abandonment costs, such as
the costs of decommissioning an oil rig operating in the North Sea.
Total life-cycle costing is concerned with tracking and reporting all costs relating to
a product from the beginning to the end of its life. If the revenues generated over the
life cycle of the product are also tracked, we can assess its profitability. Conventional
accounting reports do not attempt to do this and so it is difficult for managers to know
whether the decision to launch a new product will ultimately generate profits or losses.
Total life-cycle costing can be used to manage costs. Managers will be able to see, at
an early stage, the cost consequences of incorporating particular designs or particular
elements into products. Where the costs are unacceptable, changes may be made. Where
a number of equally acceptable designs for a particular product are being considered,
knowledge of the total life-cycle costs of each may help decide the final outcome.
Real World 9.4 shows how one well-known business operates a life-cycle approach
to both costing and environmental issues.
CHAPTER 9 STRATEGIC MANAGEMENT ACCOUNTING
328
REAL WORLD 9.4
Life cycle
Rolls-Royce provides engines for use in the air, at sea and on land, and is concerned with
the environmental impact as well as the costs over the whole life of its products. Rolls-
Royce states:
The environmental performance of our products has always been a priority for Rolls-Royce. A large
part of our research and development has been directed towards new products with increased
efficiency, together with reduced emissions and noise.
Our products typically remain in service for many years and consequently much of our busi-
ness is directed towards the whole life cycle of the product. Our product development processes
have evolved to address issues associated with manufacturing, assembly, operation, repair and
overhaul. This approach has much in common with the concept of Design for Environment (DfE)
which is a process for designing to minimise the overall impact of the product during its whole
life. . . .
We are also using Life Cycle Analysis techniques to benchmark the total environmental impact
associated with our products and ultimately to inform our decision-making processes. This
approach has proved the importance of the ‘in service’ phase of the life cycle for our products,
when the vast majority of the environmental impacts occur. Rolls-Royce has long applied life-cycle
management in the form of life-cycle costing to products. We incorporate environmental life-cycle
thinking into our design processes alongside cost measurement to ensure that our products are
the most cost-effective solutions while protecting the environment as far as possible.
Source: rolls-royce.com.
M09_ATRI3622_06_SE_C09.QXD 5/29/09 3:32 PM Page 328
Target costing
Target costing is a market-based approach to managing costs. We saw in Chapter 5 that
the starting point is to set the target price of a product on the basis of market research,
which may include an analysis of competitors’ prices. The target price, less the required
profit from the product, will be the target cost of the product. Target costing places
demands on managers because the target cost is usually lower than the current full cost
of the product. Thus, to achieve the target cost, a systematic approach to cost reduc-
tion is often required.
A team of managers, drawn from each of the main functional areas, such as design,
production, purchasing and marketing, will normally be charged with achieving the
target cost. Together they will examine all aspects of the product and the production
process to try to eliminate anything that does not add value. This can place consider-
able pressure on designers, as they are likely to be asked to redesign the product to a
specification that is more acceptable.
Kaizen costing
Once the product design and the production process have been agreed, the production
phase can begin. Kaizen costing may be used to manage the efficiency of this phase.
We saw in Chapter 5 that kaizen costing aims at continual and gradual incremental
improvements to the product design and the production process. Like target costing,
it also involves target setting: a cost reduction rate will be specified for a period and
actual performance will be compared against it. To achieve the required cost reduction,
the involvement of employees is normally essential. The suggestions they make can often
lead to significant savings. Kaizen costing is closely associated with lean manufacturing,
which is committed to the elimination of waste through continuous improvement.
Figure 9.4 shows the phases of the product life cycle covered by the three forms of
costing discussed.
COMPETITIVE ADVANTAGE THROUGH COST LEADERSHIP
329
‘
The relationship between the three types of costing
Figure 9.4
Total life-cycle costing covers all three phases of the product life cycle, whereas target costing
and Kaizen costing are each concerned with only a single phase.
M09_ATRI3622_06_SE_C09.QXD 5/29/09 3:32 PM Page 329
Value chain analysis
To secure competitive advantage, a business must be able to perform key activities
more successfully than its competitors. This means that it must either obtain some cost
advantage over its competitors, or differentiate itself in some way from them. To help
identify particular ways in which competitive advantage may be achieved, it is useful
to analyse a business into a sequence of value-creating activities. This sequence is
known as the value chain, and value chain analysis examines the potential for each
link in the chain to add value.
For a manufacturing business, the value-creating sequence begins with the acquisi-
tion of inputs, such as raw materials and energy, and ends with the sale of completed
goods and after-sales service. Figure 9.5 sets out the main ‘links’ in the value chain for
a manufacturing business. We can see that five primary activities are supported by four
secondary activities.
Value chain analysis applies as much to service-providing businesses as it does to
manufacturers. Service providers similarly have a sequence of activities leading to pro-
vision of the service to their customers. Analysing these activities in an attempt to
identify and eliminate non-value-added activities is very important.
Each link in the value chain represents an activity that will incur costs and affect
profits. Ideally, each will add value – that is, the customer will be prepared to pay more
for the activity than it costs to carry out. If, however, a business is to outperform its
rivals, it must ensure that the value chain is configured in such a way that it leads
either to a cost advantage or to differentiation.
To achieve a cost advantage, the costs associated with each link in the chain must
be identified and then examined to see whether they can be reduced or eliminated.
For example, a business may identify a non-value-added activity, such as the inspec-
tion of the completed product by a quality controller. The introduction of a ‘quality’
culture in the business could lead to all output being reliable. As a result, inspection
would no longer be needed and therefore this cost can be eliminated. To achieve
CHAPTER 9 STRATEGIC MANAGEMENT ACCOUNTING
330
‘
The main links in the value chain of a manufacturing business
Figure 9.5
The five primary activities which form the links in the value chain, are underpinned by four sup-
port activities.
Source: Adapted from Porter, M., Competitive Advantage, The Free Press, 1985, pp. 11–15.
M09_ATRI3622_06_SE_C09.QXD 5/29/09 3:32 PM Page 330
differentiation from its rivals, a business must achieve uniqueness in at least one part
of the value chain. A large baker, for example, may try to differentiate its products by
moving production facilities to its retail shops to ensure that the products are freshly
available to customers.
In some cases, value chain analysis may result in significant operational changes
such as the introduction of new manufacturing or service-provision technology, or the
development of new sales policies. In other cases it may result in significant strategic
shifts. A manufacturing business, for example, may find that it is unable to match the
manufacturing costs achieved by its rivals. Nevertheless, it has competitive strengths
in the areas of marketing and distribution. In such circumstances, a decision may
be made to focus on the business’s core competencies. This may lead it to outsource
the manufacturing function and to concentrate on the marketing and distribution of
the goods.
Real World 9.5 provides an example of how focusing on the value chain may help
transform the performance of a business.
An alternative view
Whilst the costing methods just described are used and are regarded as useful by many
businesses, some believe that they fail to provide the key to successful strategic cost
management. It has been suggested that undue emphasis on costing methods, such
as total life-cycle costing, is misplaced and what is really needed is for businesses to
COMPETITIVE ADVANTAGE THROUGH COST LEADERSHIP
331
REAL WORLD 9.5
What a sauce
Ahold is a major Dutch retailer that has recently been recovering its fortunes, under its
chief executive Anders Moberg. The business has a recovery plan that involves ‘re-
engineering the value chain’ and according to Mr Moberg, the key is a detailed analysis
of the cost of goods sold.
‘That is probably the single biggest opportunity [for savings] that we have.’
Take a bottle of tomato ketchup. ‘What are the costs of the growers of the tomatoes? What are
the components of the value chain, production, marketing, packaging and distribution? Can you
add a component in a different way, for example with standardised bottles? You are looking at
how to re-engineer the value chain [in order] to lower the price.’
Manufacturers’ brands do this, he says, ‘but they keep the savings, hence they have a better
return on capital’. With supermarket own-label brands on the rise – they account for 50 per cent
of Ahold Dutch store sales, and 15 per cent in the US – Mr Moberg can reduce what it costs him
to make products while at the same time lowering prices, attracting more shoppers to Ahold stores
and thereby raising volumes. . . .
Armed with intricate knowledge of supply chain costs, Ahold can press big brand manufac-
turers to cut the prices they ask of the retailer. It is a delicate balancing act. Both Grolsch, the
Dutch brewer, and Peijnenburg, a bakery group, have quarrelled with Ahold about the damage
inflicted on their brands by pricing policy, while Unilever, the consumer goods group, took Ahold
to court, claiming it had copied its packaging.
It appears, however, to be a battle Mr Moberg is winning. Not only is customer perception of
the quality of own-label products rising – a fact confirmed by independent industry research – but
Ahold has a strong position with big consumer brands through its control of distribution channels,
especially in the Netherlands, where its Albert Heijn chain is market leader and has 700 stores.
Source: Bickerton, I., ‘It is all about the value chain’, ft.com, 23 February 2006.
FT
M09_ATRI3622_06_SE_C09.QXD 5/29/09 3:32 PM Page 331
develop ways of learning and adapting to their changing environment. To manage
costs successfully, businesses should continually review them in the face of new threats
and pressures rather than relying on particular techniques to provide solutions.
Hopwood (see reference 2 at the end of the chapter) suggests that to transform costs
over time in order to fit the strategic objectives, businesses do not need very sophistic-
ated techniques or highly bureaucratic systems. Rather, they need to change the ways
in which costs are viewed and dealt with. He suggests that the following broad prin-
ciples should be adopted.
1 Spread the responsibility
Employees throughout the business should share responsibility for managing costs.
Thus, design experts, engineers, store managers, sales managers, and so on. should all
contribute towards managing costs and should see this as part of their job. The involve-
ment of non-accountants is, of course, a feature of target costing and kaizen costing,
and so this point already appears to be widely accepted.
Hopwood suggests that employees should be provided with a basic understanding of
costing ideas such as fixed and variable costs, relevant costs and so on, to enable them
to contribute fully. As cost-consciousness permeates the business, and non-accounting
employees become more involved in costing issues, the role of the accountants will
change. They will often facilitate, rather than initiate, cost management proposals and
will become part of the multi-skilled teams engaged in creatively managing them.
2 Spread the word
Throughout the business, costs and cost management should become everyday topics
for discussion. Managers should seize every opportunity to raise these topics with
employees, as talking about costs can often lead to ideas being developed and action
being taken to manage costs.
3 Think local
Emphasis should be placed on managing costs within specific sites and settings.
Managers of departments, product lines or local offices are more likely to become
engaged in managing costs if they are allowed to take initiatives in areas over which
they have control. Local managers tend to have local knowledge not possessed by man-
agers at head office. They are more likely to be able to spot cost-saving opportunities
than are their more senior colleagues. Business-wide initiatives for cost management
which have been developed by senior management are unlikely to have the same
beneficial effect.
4 Benchmark continually
Benchmarking should be a never-ending journey. There should be regular, as well as
special-purpose, reporting of cost information for benchmarking purposes. The costs of
competitors may provide a useful basis for comparison, as we saw earlier. In addition,
costs that may be expected as a result of moving to new technology or work patterns
may be helpful.
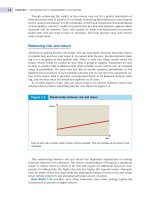
5 Focus on managing rather than reducing costs
Conventional management accounting tends to focus on cost reduction, which is,
essentially, taking a short-term perspective on costs. Strategic cost management, how-
ever, means that in some situations costs should be increased rather than reduced.
CHAPTER 9 STRATEGIC MANAGEMENT ACCOUNTING
332
M09_ATRI3622_06_SE_C09.QXD 5/29/09 3:32 PM Page 332
Hopwood argues that the above principles, when used in conjunction with overall
financial controls, provide the best way to manage costs strategically.
Real World 9.6 gives an example of how local managers who are not accountants
can identify potential cost savings and not resent their implementation.
Once the strategic objectives of a business have been set, progress towards these objec-
tives must be monitored. This means that there must be appropriate measures by
which progress can be assessed. Financial measures have long been seen as the most
important ones for a business. They provide us with a valuable means of summarising
and evaluating business achievement and there is no real doubt about the continued
importance of financial measures in this role. In recent years, however, there has been
increasing recognition that financial measures alone will not provide managers with
sufficient information to manage a business effectively. Non-financial measures must
also be used to gain a deeper understanding of the business and to achieve the objec-
tives of the business, including the financial objectives.
Translating strategy into action
TRANSLATING STRATEGY INTO ACTION
333
Under what kind of circumstances might it be a good idea to increase costs?
This may include situations that could lead to
l additional revenues being generated
l lower costs being incurred over the longer term
l lower costs being incurred in other areas of the business.
Activity 9.3
REAL WORLD 9.6
Costing problem? Call a doctor
One research study contrasts the difference in approach to cost management in UK and
Finnish hospitals. In the UK, cost management is seen as the domain of financial staff. This
can lead to problems as financial systems that have been introduced to manage costs
have led to more complex organisational structures. In addition there is often an em-
phasis on cost savings, which can lead to conflict between financial staff and medical
staff. The latter often resent cost cuts being imposed on them by the financial staff.
In contrast, medical staff in Finnish hospitals share responsibility for cost management.
Doctors and other medical professionals recognise the need to use resources in an effi-
cient way and are committed to ensuring that resources are not wasted. Rather than fight-
ing cost-cutting initiatives from financial staff, they see both medical knowledge and cost
awareness as being necessary to successful medical practice.
Source: Based on information in Hopwood, A., ‘Costs count in the strategic agenda’, ft.com, 13 August 2002.
FT
M09_ATRI3622_06_SE_C09.QXD 5/29/09 3:32 PM Page 333
Financial measures portray various aspects of business achievement (for example,
sales revenues, profits and return on capital employed) that can help managers deter-
mine whether the business is increasing the wealth of its owners. These measures are
vitally important but, in an increasingly competitive environment, managers also need
to understand what drives the creation of wealth. These value drivers may be such
things as employee satisfaction, customer loyalty and the level of product innovation.
Often they do not lend themselves to financial measurement, although non-financial
measures may provide some means of assessment.
Financial measures are normally ‘lag’ indicators, in that they tell us about outcomes.
In other words, they measure the consequences arising from management decisions
that were made earlier. Non-financial measures can also be used as lag indicators, of
course. However, they can also be used as ‘lead’ indicators by focusing on those things
that drive performance. It is argued that if we measure changes in these value drivers,
we may be able to predict changes in future financial performance. For example, a busi-
ness may find from experience that a 10 per cent fall in levels of product innovation
during one period will lead to a 20 per cent fall in sales revenues over the next three
periods. In this case, the levels of product innovation can be regarded as a lead indica-
tor that can alert managers to a future decline in sales unless corrective action is taken.
Thus, by using this lead indicator, managers can identify key changes at an early stage
and can respond quickly.
The balanced scorecard
One of the most impressive attempts to integrate the use of financial and non-financial
measures has been the balanced scorecard, developed by Robert Kaplan and David
CHAPTER 9 STRATEGIC MANAGEMENT ACCOUNTING
334
‘
‘
How might we measure:
(a) employee satisfaction?
(b) customer loyalty?
(c) the level of product innovation?
(a) Employee satisfaction may be measured through the use of an employee survey. This
could examine attitudes towards various aspects of the job, the degree of autonomy
that is permitted, the level of recognition and reward received, the level of participa-
tion in decision making, the degree of support received in carrying out tasks and so
on. Less direct measures of satisfaction may include employee turnover rates and
employee productivity. However, other factors may have a significant influence on
these measures.
(b) Customer loyalty may be measured through the proportion of total sales generated
from existing customers, the number of repeat sales made to customers, the per-
centage of customers renewing subscriptions or other contracts, and so on.
(c) The level of product innovation may be measured through the number of innovations
during a period compared to those of competitors, the percentage of sales attribut-
able to recent product innovations, the number of innovations that are brought suc-
cessfully to market, and so on.
Activity 9.4
M09_ATRI3622_06_SE_C09.QXD 5/29/09 3:32 PM Page 334
Norton (see reference 3 at the end of the chapter). The balanced scorecard is both a
management system and a measurement system. In essence, it provides a framework
that translates the aims and objectives of a business into a series of key performance
measures and targets. This framework is intended to make the strategy of the business
more coherent by tightly linking it to particular targets and initiatives. As a result,
managers should be able to see more clearly whether the objectives that have been set
have actually been achieved.
The balanced scorecard approach involves setting objectives and developing appro-
priate measures and targets in four main areas:
1 Financial. This area will specify the financial returns required by shareholders and
may involve the use of financial measures such as return on capital employed, oper-
ating profit margin, percentage sales revenue growth and so on.
2 Customer. This area will specify the kind of customer and/or markets that the busi-
ness wishes to service and will establish appropriate measures such as customer
satisfaction, new customer growth levels and so on.
3 Internal business process. This area will specify those business processes (for example,
innovation, types of operation, and after-sales service) that are important to the suc-
cess of the business, and will establish appropriate measures such as percentage of
sales from new products, time to market for new products, product cycle times, and
speed of response to customer complaints.
4 Learning and growth. This area will specify the kind of people, the systems and the
procedures that are necessary to deliver long-term business growth. This area is often
the most difficult for the development of appropriate measures. However, examples
of measures may include employee motivation, employee skills profiles and informa-
tion systems capabilities. These four areas are shown in Figure 9.6.
The balanced scorecard approach does not prescribe the particular objectives, mea-
sures or targets that a business should adopt; this is a matter for the individual business
to decide upon. There are differences between businesses in terms of technology
employed, organisational structure, management philosophy and business environ-
ment, so each business should develop objectives and measures that reflect its unique
circumstances. The balanced scorecard simply sets out the framework for developing a
coherent set of objectives for the business and for ensuring that these objectives are
then linked to specific targets and initiatives.
A balanced scorecard will be prepared for the business as a whole or, in the case of
large, diverse businesses, for each strategic business unit. However, having prepared an
overall scorecard, it is then possible to prepare a balanced scorecard for each sub-unit,
such as a department, within the business. Thus, the balanced scorecard approach can
cascade down the business and can result in a pyramid of balanced scorecards that are
linked to the ‘master’ balanced scorecard through an alignment of the objectives and
measures employed.
Though a very large number of measures, both financial and non-financial, exist and
so could be used in a balanced scorecard, only a handful of measures should be
employed. A maximum of 20 measures will normally be sufficient to enable the factors
that are critical to the success of the business to be captured. (If a business has come
up with more than 20 measures, it is usually because the managers have not thought
hard enough about what the key measures really are.) The key measures developed
should be a mix of lagging indicators (those relating to outcomes) and lead indicators
(those relating to the things that drive performance).
Although the balanced scorecard employs measures across a wide range of business
activity, it does not seek to dilute the importance of financial measures and objectives.
TRANSLATING STRATEGY INTO ACTION
335
M09_ATRI3622_06_SE_C09.QXD 5/29/09 3:32 PM Page 335
CHAPTER 9 STRATEGIC MANAGEMENT ACCOUNTING
336
The balanced scorecard – for translating a strategy into
operational processes
Figure 9.6
There are four main areas covered by the balanced scorecard. Note that, for each area, a funda-
mental question must be addressed. By answering these questions, managers should be
able to develop the key objectives of the business. Once this has been done, suitable measures
and targets can be developed that are relevant to those objectives. Finally, appropriate man-
agement initiatives will be developed to achieve the targets set.
Source: The Balanced Scorecard, Harvard Business School Press (Kaplan, R. and Norton, D. 1996). Reprinted by permission of
Harvard Business School Press, from The Balanced Scorecard by R. Kaplan and D. Norton. Boston, MA 1996. Copyright © 1996 by
the Harvard Business School Publishing Corporation; all rights reserved.
M09_ATRI3622_06_SE_C09.QXD 5/29/09 3:32 PM Page 336
In fact, the opposite is true. Kaplan and Norton (see reference 3 at the end of the chap-
ter) emphasise the point that a balanced scorecard must reflect a concern for the finan-
cial objectives of the business and so measures and objectives in the other three areas
that have been identified must ultimately be related back to the financial objectives.
There must be a cause-and-effect relationship. So, for example, an investment in staff
development (in the learning and growth area) may lead to improved levels of after-
sales service (internal business process area), which, in turn, may lead to higher levels
of customer satisfaction (customer area) and, ultimately, higher sales revenues and
profits (financial area). At first, cause-and-effect relationships may not be very clearly
identified. However, by gathering information over time, the business can improve its
understanding of the linkages and thereby improve the effectiveness of the scorecard.
Figure 9.7 shows the cause-and-effect relationship between the investment in staff
development and the business’s financial objectives.
Why is this framework referred to as a balanced scorecard? According to Kaplan
and Norton, there are various reasons. First, it is because it aims to strike a balance
between external measures relating to customers and shareholders, and internal measures
relating to business process, learning and growth. Secondly, it aims to strike a balance
between the measures that reflect outcomes (lag indicators) and measures that help
TRANSLATING STRATEGY INTO ACTION
337
The cause-and-effect relationship
Figure 9.7
The investment in staff development is linked through a cause-and-effect relationship to the
financial objectives of the business.
Do you think this is a rather hard-nosed approach to dealing with staff development?
Should staff development always have to be justified in terms of the financial results
achieved?
This approach may seem rather hard-nosed. However, Kaplan and Norton argue that
unless this kind of link between staff development and increased financial returns can be
demonstrated, managers are likely to become cynical about the benefits of staff develop-
ment and so the result may be that there will be no investment in staff.
Activity 9.5
M09_ATRI3622_06_SE_C09.QXD 5/29/09 3:32 PM Page 337
predict future performance (lead indicators). Finally, the framework aims to strike a bal-
ance between hard financial measures and soft non-financial measures.
It is possible to adapt the balanced scorecard to fit the needs of the particular busi-
ness. Real World 9.7 shows how this has been done by Tesco plc, the large retailer.
As a footnote to our consideration of the balanced scorecard, Real World 9.8 pro-
vides an interesting analogy with aeroplane pilots limiting themselves to just one con-
trol device.
CHAPTER 9 STRATEGIC MANAGEMENT ACCOUNTING
338
REAL WORLD 9.7
Every little helps
Tesco plc has modified the balanced scorecard approach to meet its particular needs. It
has added a fifth dimension, the community, to demonstrate its commitment to the com-
munities that it serves. There is frequent monitoring of the various performance measures
against the scorecard targets. The business states:
We operate a balanced scorecard approach which is known within the Group as our Steering
Wheel. This unites the Group’s resources around our customers, people, operations, community
and finance. The scorecard operates at every level within the Group, from ground level business
units, through to country level operations. It enables the business to be operated and monitored
on a balanced basis with due regard for all stakeholders. . . .
The Steering Wheel is reviewed quarterly. Steering Wheels are operated in business units
across the Group, and reports are prepared of performance against target KPIs on a quarterly
basis enabling management to measure performance.
Source: Tesco plc, ‘Internal control and risk management’, 2008, tesco.com.
(UN)REAL WORLD 9.8
Fear of flying
Kaplan and Norton invite us to imagine the following conversation between a passenger
and the pilot of a jet aeroplane during a flight:
Q: I’m surprised to see you operating the plane with only a single instrument. What does it measure?
A: Airspeed. I’m really working on airspeed this flight.
Q: That’s good. Airspeed certainly seems important. But what about altitude? Wouldn’t an alti-
meter be helpful?
A: I worked on altitude for the last few flights and I’ve gotten pretty good on it. Now I have to con-
centrate on proper airspeed.
Q: But I notice you don’t even have a fuel gauge. Wouldn’t that be useful?
A: You’re right; fuel is significant, but I can’t concentrate on doing too many things well at the same
time. So on this flight I’m focusing on airspeed. Once I get to be excellent at airspeed, as well as
altitude, I intend to concentrate on fuel consumption on the next set of flights.
The point they are trying to make (apart from warning against flying with a pilot like this!)
is that to fly an aeroplane, which is a complex activity, a wide range of navigation instru-
ments is required. A business, however, can be even more complex to manage than an
aeroplane and so a wide range of measures, both financial and non-financial, is necessary.
Reliance on financial measures is not enough and so the balanced scorecard aims to pro-
vide managers with a more complete navigation system.
Source: Kaplan and Norton (see reference 3 at the end of the chapter).
M09_ATRI3622_06_SE_C09.QXD 5/29/09 3:32 PM Page 338
The above story makes the point that, if one concentrates only on a few areas of per-
formance, other important areas may be ignored. Too narrow a focus can adversely
affect behaviour and distort performance. This may, in turn, mean that the busi-
ness fails to meet its strategic objectives. Perhaps we should bear in mind another
apocryphal story concerning a factory in Russia which, under the former communist
regime, produced nails. The factory had its output measured according only to the
weight of nails manufactured. For one financial period, it achieved its output target by
producing one very large nail!
Scorecard problems
Not all attempts to embed the balanced scorecard approach within a business are suc-
cessful. Why do things go wrong? It has been suggested that often too many measures
are employed, thereby making the scorecard too complex and unwieldy. It has also
been suggested that managers are confronted with trade-off decisions between the four
different dimensions, and struggle because they lack a clear compass. Imagine a man-
ager who has a limited budget and therefore has to decide whether to invest in staff
training or product innovation. If both add value to the business, which choice will be
optimal for the business?
Whilst such problems exist, David Norton believes that there are two main reasons
why the balanced scorecard fails to take root within a business, as Real World 9.9 explains.
MEASURING SHAREHOLDER VALUE
339
Traditional measures of financial performance have been subject to much criticism in
recent years and new measures have been advocated to guide and to assess strategic
management decisions. In this section we shall consider two new measures, both of
which are based on the idea of increasing shareholder value. Before examining each
Measuring shareholder value
REAL WORLD 9.9
When misuse leads to failure
There are two main reasons why companies go wrong with the widely used balanced scorecard,
according to David Norton, the consultant who created the concept with Robert Kaplan, a Harvard
Business School Professor.
‘The number one cause of failure is that you don’t have leadership at the executive levels of the
organisation,’ says Mr Norton. ‘They don’t embrace it and use it for managing their strategy.’
The second is that some companies treat it purely as a measurement tool, a problem he admits
stems partly from its name. The concept has evolved since its inception, he says. The latest
Kaplan–Norton thinking is that companies need a unit at corporate level – they call it an ‘office of
strategy management’ – dedicated to ensuring that strategy is communicated to every employee
and translated into plans, targets and incentives in each business unit and department.
Incentives are crucial, Mr Norton believes. Managers who have achieved breakthroughs in per-
formance with the scorecard say they would tie it to executive compensation sooner if they were
doing it again. ‘There’s so much change in organisations that managers don’t always believe you
mean what you say. The balanced scorecard may just be “flavour of the month”. Tying it to com-
pensation shows that you mean it.’
Source: When misuse leads to failure, ft.com, © The Financial Times Limited, 24 May 2006.
FT
M09_ATRI3622_06_SE_C09.QXD 5/29/09 3:32 PM Page 339
method, we shall first consider why increasing shareholder value is regarded as the ulti-
mate financial objective of a business.
The quest for shareholder value
For some years, shareholder value has been a ‘hot’ issue among managers. Many lead-
ing businesses now claim that the quest for shareholder value is the driving force
behind their strategic and operational decisions. As a starting point, we shall consider
what is meant by the term ‘shareholder value’, and in the sections that follow we shall
look at two of the main approaches to measuring shareholder value.
In simple terms, ‘shareholder value’ is about putting the needs of shareholders at the
heart of management decisions. It is argued that shareholders invest in a business with
a view to maximising their financial returns in relation to the risks that they are pre-
pared to take. As managers are appointed by the shareholders to act on their behalf,
management decisions and actions should therefore reflect a concern for maximising
shareholder returns. Though the business may have other ‘stakeholder’ groups, such as
employees, customers and suppliers, it is the shareholders that should be seen as the
most important group.
This, of course, is not a new idea. As we discussed in Chapter 1, maximising share-
holder wealth is assumed to be the key objective of a business. However, not everyone
accepts this idea. Some believe that a balance must be struck between the competing
claims of the various stakeholders. A debate concerning the merits of each viewpoint
is beyond the scope of this book; however, it is worth pointing out that, in recent years,
the business environment has radically changed.
In the past, shareholders have been accused of being too passive and of accepting
too readily the profits and dividends that managers have delivered. However, this has
changed. Shareholders are now much more assertive, and, as owners of the business,
are in a position to insist that their needs are given priority. Since the 1980s we have
witnessed the deregulation and globalisation of business, as well as enormous changes
in technology. The effect has been to create a much more competitive world. This has
meant not only competition for products and services but also competition for funds.
Businesses must now compete more strongly for shareholder funds and so must offer
competitive rates of return.
Thus, self-interest may be the most powerful reason for managers to commit them-
selves to maximising shareholder returns. If they do not do this, there is a real risk that
shareholders will either replace them with managers who will, or allow the business to
be taken over by another business that has managers who are dedicated to maximising
shareholder returns.
How can shareholder value be created?
Creating shareholder value involves a four-stage process. The first stage is to set objec-
tives for the business that recognise the central importance of maximising shareholder
returns. This will set a clear direction for the business. The second stage is to establish
an appropriate means of measuring the returns, or value, that have been generated
for shareholders. For reasons that we shall discuss later, the traditional methods of
measuring returns to shareholders are inadequate for this purpose. The third stage is
to manage the business in such a manner as to ensure that shareholder returns are
maximised. This means setting demanding targets and then achieving them through
CHAPTER 9 STRATEGIC MANAGEMENT ACCOUNTING
340
M09_ATRI3622_06_SE_C09.QXD 5/29/09 3:32 PM Page 340
the best possible use of resources, the use of incentive systems and the embedding of a
shareholder value culture throughout the business. The final stage is to measure the
shareholder returns over a period of time to see whether the objectives have actually
been achieved.
Figure 9.8 shows the shareholder value creation process.
The need for new measures
Given a commitment to maximise shareholder returns, we must select an appropriate
measure that will help us assess the returns to shareholders over time. It is argued that
the traditional methods for measuring shareholder returns are seriously flawed and so
should not be used for this purpose.
MEASURING SHAREHOLDER VALUE
341
The four-stage process for creating shareholder value
Figure 9.8
What are the traditional methods of measuring shareholder returns?
The traditional approach is to use accounting profit or some ratio that is based on
accounting profit, such as return on shareholders’ funds or earnings per share.
Activity 9.6
M09_ATRI3622_06_SE_C09.QXD 5/29/09 3:32 PM Page 341
There are broadly four problems with using accounting profit, or a ratio based on
profit, to assess shareholder returns. These are:
l Profit is measured over a relatively short period of time (usually one year). However,
when we talk about maximising shareholder returns, we are concerned with max-
imising returns over the long term. It has been suggested that using profit as the key
measure will run the risk that managers will take decisions that improve perform-
ance in the short term, but which may have an adverse effect on long-term per-
formance. For example, profits may be increased in the short term by cutting back
on staff training and research expenditure. However, this type of expenditure may
be vital to long-term survival.
l Risk is ignored. A fundamental business reality is that there is a clear relationship
between the level of returns achieved and the level of risk that must be taken
to achieve those returns. The higher the level of returns required, the higher
the level of risk that must be taken. A management strategy that produces an
increase in profits can reduce shareholder value if the increase in profits achieved
is not commensurate with the increase in the level of risk. Thus, profit alone is not
enough.
l Accounting profit does not take account of all of the costs of the capital invested by the busi-
ness. The conventional approach to measuring profit will deduct the cost of bor-
rowing (that is, interest charges) in arriving at profit for the period, but there is no
similar deduction for the cost of shareholder funds. Critics of the conventional
approach point out that a business will not make a profit, in an economic sense,
unless it covers the cost of all capital invested, including shareholder funds. Unless
the business achieves this, it will operate at a loss and so shareholder value will
be reduced.
l Accounting profit reported by a business can vary according to the particular accounting
policies that have been adopted. The way that accounting profit is measured can vary
from one business to another. Some businesses adopt a very conservative approach,
which would be reflected in particular accounting policies such as immediately
treating some intangible assets (for example, research and development and good-
will) as expenses (‘writing them off’) rather than retaining them on the statement
of financial position as assets. Similarly, the use of the reducing-balance method of
depreciation (which means high depreciation charges in the early years) reduces profit
in those early years.
Businesses that adopt less conservative accounting policies would report higher
profits in the early years of owning depreciating assets. Writing off intangible assets
over a long time period (or, perhaps, not writing off intangible assets at all), the use of
the straight-line method of depreciation and so on will have this effect. In addition,
there may be some businesses that adopt particular accounting policies or carry out
particular transactions in a way that paints a picture of financial health that is in line
with what those who prepared the financial statements would like shareholders and
other users to see, rather than what is a true and fair view of financial performance
and position. This practice is referred to as ‘creative accounting’ and has been a major
problem for accounting rule makers and for society generally.
Real World 9.10 provides some examples of creative accounting methods that have
recently been found in practice.
CHAPTER 9 STRATEGIC MANAGEMENT ACCOUNTING
342
M09_ATRI3622_06_SE_C09.QXD 5/29/09 3:32 PM Page 342