Mastering the Currency Market Forex Strategies for High and Low_8 ppt
Bạn đang xem bản rút gọn của tài liệu. Xem và tải ngay bản đầy đủ của tài liệu tại đây (863.43 KB, 32 trang )
the most reliable trade signals is the combination trendline
break and stochastic cross. In the last section we talked about
what happens when a trend reverses and how the order of
operation for the technical indicators plays out. Right at the top
of the list was the trendline break and the stochastic cross. The
combination of these two occurrences is always noteworthy
because a shift in the trend cannot occur without them. Because
of the simplicity and reliability of this signal, it is one of the
first trade signals we will be covering.
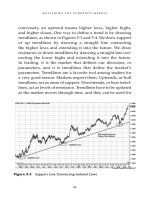
We see an example of these signals in Figure 9-5, where we
have the signals marked by vertical lines that show the candles
that gave us the signals. The vertical line on the left side of the
Mastering the Currency Market
212
Figure 9-5 Combination Stochastic and Trendline Trade Signal
chart marks a sell signal given by the combination of the price
closing below a short-term up trendline and the stochastic
crossing below the oversold line. The vertical line on the right
marks a buy signal marked by a close above the bear trendline
combined with the stochastic moving higher above the over-
sold line. The trendline drawn is intermediate-term in length
as it is between 15 and 60 candles.
Also note how the MACD supports both the sell signal and
the buy signal. To take a sell signal, we prefer to see that the
MACD histogram has stair-stepped lower at least once, which
tells us that there is a shift in momentum in favor of the signal.
For the buy signal on the right side of the chart, we see that
although MACD is below zero, the MACD histogram is stair-
stepping in the direction of the trigger.
When we use the trendline and stochastic cross signal, we
don’t need the MACD histogram for confirmation, but we want
it to confirm within the next couple of candles. A rule of thumb
is that if we are considering a trade signal and the MACD his-
togram is moving opposite to the signal, we know we are very
likely to be entering a countertrend trade and should be even
more active in monitoring the trade. Preferably, we want at least
the MACD histogram starting to stair-step in favor of the trade.
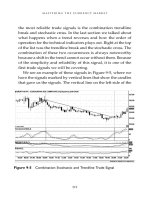
Figure 9-6 provides two more examples of trade signals
given by the trendline and stochastic combination. In the first
case the MACD does not confirm, and in the second it does.
For the first buy signal on the left side of the chart in
Figure 9-6, we see that the signal did help identify a bottom,
but the trader would have had to sit through a drawdown on
his or her position and a retest of that low. The reason for this
Tying the Technical Indicators Together
213
is that the momentum of the down move was too strong, as
marked by the increased slope of the sell-off. When we see
momentum that strong before a signal, we may decide that it
does not warrant the risk of taking the trade. When a price
move is marked by a nearly parabolic candle like this one, it is
best to stick with signals in the same direction as the momen-
tum or just not trade. The MACD confirms our decision not to
take the signal as it is below both the zero line and the trigger
line. Eventually the market gave us a rounded bottom, and the
next buy signal on the right side of the chart provided a nice
trade as the intermediate-term trendline was penetrated. At the
time of this signal the MACD confirmed by crossing above the
trigger line to give us a countertrend buy signal.
Mastering the Currency Market
214
Figure 9-6 MACD Confirms Trade Signal
The next signal we are going to cover is a close above a
bullish doji and a close below a bearish doji. When the market
gives us a doji or, more specifically, a shooting star doji at or
near resistance and then has a close below the low of that doji,
this is a sell signal. The shooting star candle tells us the
market is indecisive, and the candle that closes below that low
would be a change-of-direction candle by definition because it
closes below the low of the doji. We can take this combination
of candles as a sell trigger.
On the October 2008 GBPJPY chart shown in Figure 9-7 we
see a pair of sell signals created by a shooting star dojis
followed immediately by change-of-direction candles that
closed below the low of the dojis. The change-of-direction
candle is often going to provide a signal because by definition
Tying the Technical Indicators Together
215
Figure 9-7 Candlestick Trade Signals
it is breaking the previous pattern of price action, and it also
is very likely to create a short-term trendline break. In her 1996
book Trading with the Odds, Cynthia Kase describes how she
often uses this signal to exit trades.
Figure 9-8 shows examples of hammer dojis followed by
change-of-direction candles in the summer of 2007 that marked
a secondary low in GBPJPY.
Trending and Countertrending Behavior
In Chapter 4 we touched on the difference between trending
and countertrending markets by pointing out that elongated
candles extending up or down identify trending, or impulsive
price action, whereas shorter candles with smaller bodies
Mastering the Currency Market
216
Figure 9-8 Candlestick Buy Signals
indicate countertrending price action, or reactive trading. This
is an important distinction for a trader because although our
indicators and overlays remain the same, our trading strategy
will differ slightly with the type of market we are in. A trend-
ing market is one in which the directional bias is obvious and
can be seen on the chart by a pattern of highs, lows, and closes
moving in the same direction. A countertrending market is one
in which there is no obvious direction other than sideways.
Trending markets call for making quick decisions upon enter-
ing a trade but showing more patience once one is in the mar-
ket, whereas countertrending markets give the trader more
time in taking a trade but require less time in the trade and
speed in exiting. Trending markets by definition are impulsive
and move easily in one direction, whereas countertrend mar-
kets are reactive by nature and exhibit indecisive price action.
We can define a trend trade as a position taken in the same
direction as the overall pattern of highs, lows, and closing
prices. A countertrend trade is one in which the trader is going
against, or fading, the overall direction of the market in antic-
ipation of a correction or a reversal or a trade in which
the objective is to take advantage of a sideways market by
selling near the top of the current price range and buying near
the bottom.
Beginning traders often are attracted to countertrend trading
because of the perceived level of risk. To someone with a small
account, buying a market at a support level after a sharp price
drop and then placing a tight stop-loss order can seem like a bet-
ter choice than waiting for a market to correct or retrace and then
turn before entering the trade and then placing a stop-loss order
some distance away, below the last swing high. We believe a
Tying the Technical Indicators Together
217
trader is better off recognizing the environment she is in by see-
ing the overall pattern of highs and lows and gauging the
momentum before making the decision to go with a trending
strategy in which once she is in the trade, she may use a lagging
indicator and plan to allow the trend to develop. Or a trader can
decide to employ a countertrend strategy in which he uses sup-
port and resistance, individual candle behavior, and/or a lead-
ing indicator to get in and out of trades faster. In the long run,
trend traders will be rewarded more because they will be taking
advantage of the market’s tendency to trend. Countertrend trad-
ing strategies can be successful but require more diligence and
create higher transaction costs because of the higher frequency
of trading.
To enter any trade, whether in a trending or a coun-
tertrending environment, we generally prefer to use a signal
generated by a leading indicator coupled with a short-term
trendline break. In a countertrending environment, though,
we can speed up our entry process by using the closing price
beyond a doji or inside candles on existing support or resist-
ance as the trigger. In countertrending markets we want
to get in our position as close to the top or bottom of the
range as we can. In a trending environment, in contrast, we
want the market to give us more of an indication that it is
turning rather than just a pause in support or resistance. In a
strong trending market it is best to pass on countertrending
signals unless you have the time and skill to trade on a lower
time frame.
Something to know and remember about markets is that
they exhibit fractal geometry. What this means is that price
Mastering the Currency Market
218
behavior on the higher time frames is mimicked by price
behavior on the lower time frames. If we are seeing pro-
nounced trending behavior on the daily chart, we can expect
trending behavior on the intraday charts. This does not mean
that the intraday movement will always be in the same direc-
tion as the primary trend; it means that the candles will be
longer, which can seem counterintuitive to untrained traders.
Similarly, if the market is in a narrow sideways range over an
extended period on the daily chart, we would expect similar
reactive behavior on an intraday basis.
A very important difference between a trending market
and a countertrending market is that in a trending market
the higher time frames will dictate price movement and
direction, whereas in a countertrending environment the
lower time frame charts can dictate direction. This means
that in a trending market you do not want to go against the
trend on the next higher time frame. In a countertrending
market you are taking signals on the lower time frames
routinely regardless of the previous direction on the higher
time frames.
We titled this section “Trending and Countertrending Behav-
ior” instead of “Trending versus Countertrending Behavior”
because to be a complete trader, you must do both. The easiest
way to define whether you are in a trending or a coun-
tertrending market is to define the trends on the different time
frames and see if they are in agreement, which would mean a
trending market, or are conflicting, which would mean a coun-
tertrending market. We are going to teach you how to do that
in the next section.
Tying the Technical Indicators Together
219
Higher Time Frame Confirmation and
Quantifying the Trend
In this section we consider the words intermediate and second-
ary, with the words long-term and primary interchangeable. We
generally refer to a market movement as secondary and
describe the trend that constitutes that movement to be inter-
mediate-term. Similarly, we measure a primary move by iden-
tifying the long-term trend.
Knowing how to use a higher time frame chart to confirm
a price signal on a lower time frame is a skill that can reward
a trader greatly. Many students will become impatient and
take a trade that is coordinated on the lower time frames,
not on the higher time frames. This is a mistake and often
a waste of time, energy, and, more important, money.
Although you may not always have all the time frames line
up, there will be times when this happens. More often than
not, though, if you are trading an intraday chart and have
the current trend on the daily chart lined up in the same
direction, you are going to have the wind at your back. If you
have the knowledge to identify markets in which the intra-
day trends are moving in the same direction as the daily and
weekly trends, you are going to put yourself in a position to
reap a reward.
Here are the time frames we analyze and trade from:
Monthly weekly daily 240 minutes
60 minutes 15 minutes 5 minutes
The different time frames we use must remain three to six
increments apart to maintain continuity:
Mastering the Currency Market
220
Monthly/4 ϭ weekly chart
Weekly/5 ϭ daily chart
Daily/6 ϭ 240-minute chart
240/4 ϭ 60-minute chart
60/4 ϭ 15-minute chart
15/3 ϭ 5-minute chart
In analyzing a market we never skip over a time frame. If we
are trading off a 60-minute chart, we look to our 240-minute chart
for confirmation. We never jump time frames because we would
lose continuity. If we see a signal on the daily chart, we look to
the trend on the weekly chart for confirmation. If we see a signal
or setup on the 15-minute chart, we look to the 60-minute chart
for confirmation. It is paramount to maintain this continuity.
The collage of charts in Figure 9-9, with the long-term on the
left, the intermediate-term on the lower right, and the short-term
on the upper right, provides an excellent perspective from which
to analyze and trade markets. (For this example we are using
the monthly chart for the long term, the weekly chart for the
intermediate term, and the daily chart for the short term.) Here
we see the market’s stance, with the higher time frame charts
encompassing all the activity on the lower time frame charts.
We’ve overlaid most of the significant support and resistance
levels and trendlines on the charts, along with the MACD,
stochastic, and RSI at the bottom. (For ease of viewing we have
omitted the RSI on the lower time frame charts.) We should
always take direction and identify a trade setup from our
intermediate-term chart, in this case the weekly chart. We can
look to the long-term chart for confirmation or support—though
this is not a prerequisite, particularly if one is day trading—and
use the short-term chart to hasten our entry and exit signals.
Tying the Technical Indicators Together
221
In Figure 9-9 we can see from price action and from the
MACD being below zero on the monthly chart that the current
trend is lower. We’ve marked the weekly chart with two verti-
cal lines to show both the close of the week when the stochas-
tic crossed its trigger line and the oversold line at 75 and the
period when the bull trendline from March 2008 through
August 2008 was penetrated on a closing basis. We’ve also
marked the corresponding periods when those events occurred
on the monthly chart and the daily chart with vertical lines. For
the monthly chart there is only one line as both of those events
occurred in one month. Note also on the monthly chart that
when this market topped out just above 110.00, it gave us a
Mastering the Currency Market
222
Figure 9-9 Coordinating Time Frames
shooting star doji followed by a change-of-direction candle that
closed below the low of the doji. This is certainly a bearish
development, but we do not have penetration of the five-
month bull trendline. Looking again to the weekly chart, we
can see the advantage of waiting for sell indications on our
intermediate-term chart to initiate positions on our daily chart.
Traders who take signals from the daily chart without waiting
for confirmation on the weekly chart risk getting into positions
prematurely, and traders who wait for confirmation on the
monthly chart risk missing the move and getting into the trade
too late. Waiting for the weekly chart to confirm does not nec-
essarily mean waiting till the end of the week. If the behavior
of price on the weekly chart gives us a sell indication on a daily
close, we can take this as higher time frame confirmation.
As a general rule we look first to a market for a tradable
setup on its intermediate-term time frame. If we see an attrac-
tive setup such as the beginnings of a trend shift following
price challenging a confluence of a long-term trendline and a
Fibonacci level, we would look to our long-term time frame for
confirmation. The trend on the long-term chart does not have
to be in the same direction as the shift on the intermediate-term
chart but should be showing behavior that indicates that it is
shifting, such as a stochastic cross or MACD histogram shift or
a close beyond a doji on support or resistance in the direction
of the shift on the intermediate-term chart. If we have a favor-
able setup on the intermediate-term chart, we can wait to take
a signal on that chart or look to the short-term chart for a sig-
nal in the same direction. If we take a signal on the short-term
chart and the intermediate-term chart doesn’t confirm within
three candles, we need to exit the trade quickly.
Tying the Technical Indicators Together
223
We always place our charts on the screen (the computer
monitor) in this order for a reason: The trader’s eye should fall
on the intermediate-term chart first. If direction is not obvi-
ous, we change to another market and keep doing that until
we find one with obvious direction. Once we find a market
with a favorable setup on the intermediate-term chart, based
on support and resistance, trend, and current candlestick
behavior, we monitor the shorter-term chart for a trade signal.
By placing the different time frame charts on our screens in
the same manner every time, we train ourselves always to
look to the same area of the screen for the same information.
You will find this repetition both comfortable and reliable.
After you have viewed hundreds and then thousands of
screen shots in this manner, your intuition will be drawn into
your analysis and trading.
There is a difference between analyzing a market and trad-
ing a market. From a trading perspective, for all but the most
experienced (well-capitalized) and confident traders, it is not
realistic to put yourself in a position where you have to wait
for the monthly chart to complete before exiting a position. It’s
preferable to start out by seeing the big picture and having
existing trends in place that are in agreement with your posi-
tion. The markets, however, are very dynamic pricing vehi-
cles, and when underlying shifts occur, they do so quickly.
“Change happens” is something experienced traders don’t
need to be told. Because of this there are time frames we ana-
lyze the market from, such as monthly-weekly-daily, and time
frames we trade the market from, such as the weekly-daily-
240-minute, 240-minute-60-minute-15-minute, or even 15-
minute and 5-minute. In moving from analyzing a market to
Mastering the Currency Market
224
trading a market, our measurements for trends such as short-
term, intermediate-term, and long-term also are adjusted. For
trading, we define the three time frames as the short-term
trend, which can be as short as two candles if price has closed
beyond the last trendline and as long as 15 candles; the sec-
ondary trend, which can be as long as 15 to 60 candles; and
the primary trend, which can be from 60 candles to hundreds.
It’s also important to understand that on any one chart there
are these three time frames or trends at play. On the 60-minute
chart there would be a short-term trend, an intermediate-term
trend, and a long-term term at play, as there would be on the
240-minute chart and the daily chart. On the 240-minute
GBPUSD chart shown in Figure 9-10 we have identified these
three trends.
Tying the Technical Indicators Together
225
Figure 9-10 Trendlines Quantified
Another way to determine the short-term trend, aside from
noting the pattern of the most recent highs, lows, and closes
and trendlines, is by using the direction of the stochastics.
Figure 9-11 shows how tightly the stochastic follows the
short-term trendline shifts and how the shifts occur as old
trendlines give out, allowing a new trendline to begin. A good
rule of thumb for active markets is that once the stochastics
cross and close above the oversold line, the short-term trend
has shifted higher, and once they cross and close below the
oversold line, the short-term trend has shifted lower. As
always, we need to confirm the trend by the pattern of highs,
lows, and closes. Another technical rule of thumb is that once
the MACD crosses and closes above or below zero, the inter-
mediate-term trend is shifting.
Mastering the Currency Market
226
Figure 9-11 Using the Technical Indicators to Quantify Trend
Being patient and observing how the different trendlines
shift like this will give you confidence and help you under-
stand how price action works. Knowing the various trends at
work in the market also helps a trader coordinate lower time
frame charts. If the short-term and intermediate-term trends
are higher on the 240-minute chart, we don’t have to look to
know that it is very likely that the primary trend on the 60-
minute chart also will be higher. If the intermediate-term trend
is higher on the 240-minute chart, most likely the short-term
trend on the daily chart will be higher. The implications of this
are very important for traders on both the lower and higher
time frames. Knowing when the trends started and in which
direction they are pointed is also a simple way to determine
whether the market we are analyzing is in a trending or coun-
tertrending mode. If the majority of trends, particularly the
long-term trends, are pointing in the same direction, we are in
a trending market. If the trends are in flux, we are very likely
in a countertrend market.
It is also important to understand that once a short-term
trendline is violated, it is likely that the market will migrate to
the intermediate-term trendline, and once the intermediate-
term trend is violated, it becomes more likely that the market
will try to test the long-term trendline. It is often at this point,
after a closing penetration of the intermediate-term trend, that
a market will show us whether it has real underlying strength
or this is just another secondary move. Note in Figure 9-11 how
powerful the stochastic buy signal marked by the gray vertical
line on November 24 turned out to be. This was the case
because we already had an intermediate-term trend shift in
place. This short-term stochastic signal was the equivalent of
Tying the Technical Indicators Together
227
two streams meeting and forming a river. The short-term buy
signal confirmed the intermediate-term trend shift, and the
market accelerated higher before being stopped by the force of
the resistance powered by the long-term, or primary, trend.
When we view our charts, we always want the proper
amount of time visible to use in making our decisions. The pre-
ferred amount of time is as follows:
Monthly chart ϭ 7 years
Weekly chart ϭ 2.5 years
Daily chart ϭ 8 months
240-minute chart ϭ 1.5 months
60-minute chart ϭ 10 days
15-minute chart ϭ 28 hours
5-minute chart ϭ 8 hours
Higher Time Frame Confirmation
In Figure 9-12 we see a trend trade setup for trading the
USDCHF market; both charts are for the same market but on
different time frames. We would be looking for the setup and
signal on the chart on top, in this case the daily chart, and
using the next higher time frame chart, the weekly, on the bot-
tom to confirm.
In light of the sell-off in mid-September and the subsequent
buy signal in late September by the stochastic indicator on the
daily chart—see the vertical line on both charts—this would be
an attractive buy setup. Although the short-term trend is lower
here on the daily chart, both the secondary trend and the pri-
mary trend remain higher. Despite a falling stochastic on the
Mastering the Currency Market
228
weekly chart, the short-term trend here also remains higher,
with the same stochastic remaining above the overbought line
at the 75 level. This setup makes for an acceptable risk-reward
ratio. We can buy on the stochastic signal on the daily chart
with a stop-loss order beneath the last swing low for an
approximate two-point loss. Seven sessions after the buy sig-
nal, the market had risen by six points. Before this trade we
also can see from the recent price action on the daily chart that
after a steady two-month up move, perhaps this market is due
for a correction. Remember that in Chapter 5 we talked about
how seasoned traders know to expect corrections and under-
stand that they are a healthy part of directional moves. That is
Tying the Technical Indicators Together
229
Figure 9-12 Higher Time Frame Confirmation
a good lesson to keep in mind. A steady rally is an indication
of market strength, particularly when there is no obvious
resistance above the market. A price correction, or sell-off, in
such a market can provide a buying opportunity more easily
than an actual price reversal can.
We also must address how impulsive price movement—
candles of the same color with elongated bodies—and coun-
tertrending price movement—shorter-candles of different
colors with dojis—will differ depending on which stage a
market is in on the higher time frame charts. Although it can
be counter to the primary trend, a secondary trend often starts
as an impulsive price move. It is this impulsive, or trending,
behavior defined by elongated candles that leads traders to
think that a new trend has developed when what actually
has happened is that a short-term trendline has given way
and the market is moving to test the next level of support or
resistance.
Figure 9-12 provides a good example of this price behav-
ior. Bear market rallies and bull market corrections are also
examples of this. When a bear market gives us a countertrend
or secondary rally, it generally occurs as long-term traders
cover their short positions and shorter-term traders initiate
long positions to take advantage of a quick move. The speed
and strength of this move, particularly after a drawn-out
move, lead inexperienced and shorter-term traders to believe
that a reversal has occurred. Unlike long-term trends, which
build strength slowly over time before climaxing with wide
price ranges and heavy volume, secondary moves that prove
to be countertrend corrections of the overall long-term trend
start out fast and strong, exhibiting impulsive behavior,
Mastering the Currency Market
230
before fading quickly as price extends itself back up or down
until it runs into the force of the primary trend. These sec-
ondary moves are a healthy way for the market to let off
steam after the primary trend overextends itself.
These price corrections can be particularly tricky when they
come after an actual reversal of a primary bull trend, when
many market participants believe the previous trend is still
intact. They believe they are seeing an opportunity to initiate
longs in the direction of the overall trend but then get caught
in the second down leg of a new primary move. Similarly,
when an extended bear market gives way to a new bull mar-
ket, inexperienced or shorter-term traders can get caught sell-
ing into the sell-off that follows the first rally after an actual
reversal, only to see price move against their position in the
same direction as the new primary trend. Thus, we need to
understand that impulsive or trending price behavior also can
occur counter to the primary trend.
Figure 9-13 shows an example of a bear market rally, or a sec-
ondary move counter to the primary downtrend, in the EURJPY
in October 2008. Note that on the 240-minute chart on the left
we can see price making lower lows during the week starting
October 5; however, we also see positive divergence building as
both the MACD and the stochastic record higher lows in this
week. This provides a good heads-up that the odds of a coun-
tertrend move are increasing, particularly as prices continues to
angle away from the long-term and intermediate-term bear
trendlines as the primary trend extends itself. The divergence on
the 240-minute chart is indeed a harbinger of a secondary rally
as price closes above the short-term trendline on October 10 and
the intermediate-term trendline on October 13. After the close
Tying the Technical Indicators Together
231
above the intermediate-term bear trendline we see impulsive
price action as the market sprints higher. At this point it is tricky
to determine whether we have a new trend in place or simply a
secondary rally just before a climax. As long as we are below the
long-term trendline, we assume the second case: We are seeing
a secondary rally marked by impulsive price behavior that tends
to fade quickly in the face of the more mature primary trend.
Note how the last candle on the 240-minute chart on the left
would make it look to the untrained eye that EURJPY is in a
good position to move higher and test the long-term trendline
just below 145.00, having just made a higher high to close above
the previous week’s high. The long-term trendline above the
price, however, provides a reminder of which way the primary
trend still is pointed.
Mastering the Currency Market
232
Figure 9-13 Identifying Secondary Moves
The chart on the lower right in this figure is also a 240-
minute chart. We’ve placed a vertical line on this chart to mark
the candle that was the last candle in the larger chart on the
left. That candle marked the top of the countertrend, or sec-
ondary move. The point here is that it is wise to keep track of
the primary trend and the secondary trend because by nature
a secondary move will start out strong and fast but fade sooner
than inexperienced traders think, just as the primary trend will
start slower yet stay intact longer and move farther than most
market participants think. Another word of caution about sec-
ondary moves: Because they start out fast and exhibit impul-
sive behavior, they generally will overrun support and
resistance levels such as previous highs and lows, pivots, and
retracement levels quickly, leaving untrained traders to believe
that a new trend is under way.
Continuing with our example in Figure 9-13, we now look
at the 60-minute chart on the upper right. Note that there is a
vertical line on this chart marking the same time interval that
is on the 240-minute chart below it. We should start to under-
stand now that when we get a sell signal here in the form of a
trendline break and a stochastic cross, although it would be a
countertrend to the secondary move under way on the 240-
minute chart, it is in the same direction as the primary trend
on the chart with the higher time frame. These are favorable
setups because most of the shorter-term momentum traders are
positioned for a resumption of the current intermediate-term
rally or secondary move that follows the market’s higher high,
believing there is room above for it to continue to rally. We may
be long ourselves, having taken the countertrend buy signal on
the 240-minute or 60-minute chart that marked the beginning
Tying the Technical Indicators Together
233
of the secondary move. Once we saw the divergence on the 60-
minute chart given by both the MACD and the stochastic, fol-
lowed by the sell signal, we would exit our countertrend longs
and swing short, back in the direction of the primary trend.
There are a couple of lessons in this example. First, we need
to know that as traders risking our hard-earned money in the
marketplace, we have to have the freedom to drop down to
lower time frames to maximize our performance and still fol-
low our trading plan. Similarly, we need the ability to trade
higher time frames to catch primary trends with the same trad-
ing plan. As you see in the charts in this section, we are doing
just that, and we are using the same overlays and indicators.
Coordinating time frames also means seeing setups on a
higher time frame and then waiting for a signal in the same
direction on the next lower time frame. An important aspect of
this tactic is to remember that once the signal comes on the
lower time frame, it is important to look back to the higher time
frame to make sure the indications that originally warranted the
signal are still in place. Figure 9-14 shows a sustained down-
trend in EURJPY on the 240-minute chart in the lower panel,
with the MACD well below the zero line. The chart on top is a
60-minute chart of the same market over the same period. Note
that to the left of the vertical lines, starting on September 5, 2008,
and running through September 9, 2008, we see a sharp rally.
We would draw our support trendlines underneath this rally
and wait for a penetration on a closing basis to give us a sell sig-
nal on the 60-minute chart on top. Once we get a sell signal, we
check back to our 240-minute chart and see that it is still
below its primary bear trendline and that the MACD is still
below zero. This confirms the sell trigger. With the MACD being
Mastering the Currency Market
234
below zero on the 240-minute chart, we have assurance that the
primary trend on the 60-minute chart is lower. We also would
place a buy stop-loss order in the marketplace just beyond
the bear trendline on the 240-minute chart; less capitalized
traders could place the buy stop-loss order above the high of
September 7.
When we see a trade signal on a chart and look to the next
higher time frame for confirmation, it does not mean that the
trend must be in agreement, but it does mean we should be
seeing indications that support the signal in the lower
time frame. An indication on the higher time frame that
is in agreement with the lower time frame could be consid-
ered a countertrend signal by a leading indicator such as
Tying the Technical Indicators Together
235
Figure 9-14 Intraday Higher Time Frame Confirmation
a stochastic trigger line cross, divergence on a momentum
indicator, a trendline violation, or even a one-bar reversal on
the MACD histogram.
Figure 9-15 shows an example of a primary trend reversal
and how we needed to analyze the monthly and weekly charts
to confirm this sea change occurrence. Keep in mind that pri-
mary trend reversals are rare and that a trader or market stu-
dent will see many more continuation patterns than reversal
patterns in his or her career.
In Figure 9-15 we see GBPUSD give us a sell signal on the
weekly chart (top chart) in the form of a trendline break and a
stochastic cross, with the monthly chart (bottom chart)
confirming.
Mastering the Currency Market
236
Figure 9-15 Monthly Activity Confirms Weekly Figure