Money and Power Great Predators in the Political Economy of Development_6 ppt
Bạn đang xem bản rút gọn của tài liệu. Xem và tải ngay bản đầy đủ của tài liệu tại đây (279.86 KB, 20 trang )
The privatisation process used most in sub-Saharan Africa has
been the sale of shares (directly or through competition),
followed closely by liquidations and sales of assets. Other
methods are used much more rarely: leases, public flotation,
transfers, management contracts, buyouts, joint ventures,
concessions, trustees and swaps.
(2004: 43)
Indeed, the vast majority of privatisations recorded in their book were
by selling shares to private individuals, a fact which the authors
implied meant that local elites are as culpable for the outcome as
external institutions, since there was, nominally, a choice about the
implementation method for privatisation. The authors continue: ‘what
is achieved by privatisation is essentially a clarification of the role of
the state’ (2004: 12), which underscores their point that it was a deci-
sion of local elites, in association with their advisors, which has led
privatisation processes to be, in the main, supportive of widening
inequality and personalised wealth creation. While the CDC cannot be
singularly held responsible for this, the sale of shares model which has
predominated, has also held sway in many arrangements involving
DFIs, although the OECD authors maintain that the IFIs did not ‘push’
just the share option. Case study evidence and material the CDC
produced in line with its role of preparing governments for privatisa-
tion do indicate, however, a clear preference in this direction. In
practice, donor agendas – for a secure and profitable investment envi-
ronment – and the priorities of local elites – domestic accumulation
and wealth – may converge around this outcome (see Craig 2000 for an
excellent case study of Zambia).
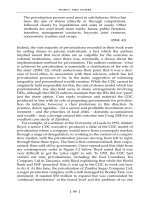
For example, at a seminar at the University of Leeds in 1992, Alistair
Boyd, a senior CDC executive, produced a slide of the CDC model of
privatisation where a company would move from a monopoly market,
through a stage of deregulation, to working in the context of a compet-
itive market, with the privatisation process moving from left to right,
through these three types. The firm is first commercialised, then corpo-
ratised, then sold off by government. I have reproduced this slide from
my contemporary notes in Figure 5.2 below. Boyd noted that it was
very difficult to get the ‘price right’ to sell. To 1992, the CDC had
carried out nine privatisations, including the East Usambara Tea
Company Ltd in Tanzania, with Boyd explaining that while the World
Bank and IMF ‘preached’ this, it was up to the CDC to work out how
to do it. At this time, the privatisation of Zambia Sugar Company Ltd,
a sugar production company with a mill managed by Booker Tate, was
imminent. It needed $50 million to expand but was confounded by
‘continual interference’ at the board level and the problem of no one
MONEY AND POWER
[86]
Bracking_06_cha05.qxd 10/02/2009 12:34 Page 86
wanting to lend to (even productive) parastatals. The solution,
according to Boyd was to move it out of government control. Mean-
while, The Companhia Do Buzi Sarl, a cotton and sugar production
unit in Mozambique – in a ‘terrible state and worth nothing’ – the
Kariba North Bank Co. Ltd electricity generating unit in Zambia, and
the Botswana Power Corporation were also slated for privatisation.
Boyd spoke of the problem of raising sufficient private sector finance
to buy large public utilities, although moving them into the hands of
the IFC could be an option, as in the last case of electricity in Botswana.
Other obstacles to privatisation he listed as: retrenchment of excess
labour and management; a resulting concentration of ownership, with
Lonhro named as a company which could end up owning ‘everything’;
the sensitive issue of foreign ownership and control in an economy; the
loss of strategic enterprises, although Boyd saw no productive asset as
potentially strategic; and established interests and loss of privileges,
where government appoints senior board members and wishes to
continue to do so.
Since the World Bank and IMF have often imposed conditionality
which makes financial assistance dependent on the execution of
privatisation, there is then no surprise that a ‘strong correlation
between privatisation and international aid’ (Berthelemy et al. 2004:
65) has been the outcome. For example, Guinea signed a lease with the
private sector in 1989 for water, which resulted in a $102.6 million
THE BRITISH MARKET MAKERS
[87]
Figure 5.2 CDC’s privatisation model
Source: Note that this is reproduced from the author’s notes and thus may contain errors.
Government Commercialisation Corporatisation Divestiture
-ownership Government
department
State-owned
corporation
Private-sector
company
-management User charges Restructuring
-finance Self accountability
Monopoly market Deregulated Competitive market
Bracking_06_cha05.qxd 10/02/2009 12:34 Page 87
transfer to the Government for water sector investment. In Mozam-
bique in 1999, the Government signed a contract with Bouygues for
water provision for seven cities, and the World Bank and other donors
granted $117 million for rehabilitation of the water infrastructure
(Berthelemy et al. 2004). The amounts have also been large in support
of privatisation relative to other funds. For example, in 2005, a year of
famine in Niger, the World Bank was spending $14.8 million on the
‘Financial Sector Technical Assistance Project’, and $18.6 million on a
‘Privatisation and Regulatory Reform Technical Assistance Project’;
initiatives to privatise the water and make Niger fit for Western
companies to invest in and exploit (World Bank 2005a). Yet the
combined governments which own the World Bank couldn’t initially
find the $15 million the Government of Niger, through the UN, said it
needed for famine relief until many had died. Up to 2 August 2005,
DfID had provided $5.25 million matched roughly by the United States
and the European Union (DfID 2005): too little too late, and not in the
same league as the amounts spent on technical assistance to capitalism.
These are not, moreover, accidental correlations of funds around the
same time as privatisation processes: a clear policy link remains
between the resource flow and the change of ownership. Moreover, the
culpability of the CDC and other IFIs grows if one considers that this
was not an unpredicted result: that privatisation might lead to a
concentration of ownership and control in the hands of some of the
world’s largest multinational corporations (MNCs) was recognised at
the time. In 1994, the regional CDC Officer for southern Africa
remarked, echoing Alistair Boyd, that ‘The trouble with privatisation
down here is whether we want Lonhro to own everything’ (Fieldwork
Interview, April 1994). At its worst, this process of concentration of
ownership has allowed ‘aid-spoilt’ elites to adopt a particular style of
exclusionary politics alongside MNCs, particularly in critical extrac-
tive enclaves (see Ferguson 2005 and 2006). MNCs, donors and local
elites have then jointly managed a system of accumulation embedded
in state authoritarianism and political kleptocracy (on Kenya, see
Murunga and Nasong’o 2007; Browne 2007; Murunga 2007).
A more recent emphasis on public–private partnership (PPP) has not
stopped privatisations, but has covered the process with an ideological
fig leaf. While some projects genuinely combine public and private
money in the supply of a good, such as mosquito nets or school text
books, others combine public technical assistance in support of a private
sector buyout. The PPP model describes both and is ubiquitous. By 2007,
the US Agency for International Development (USAID), for example,
was claiming that ‘International development has entered a new era of
public-private partnerships’ and referred to a dramatic increase in
private financing in 2003–05 from the United States to developing coun-
MONEY AND POWER
[88]
Bracking_06_cha05.qxd 10/02/2009 12:34 Page 88
tries (apparently a threefold rise, large enough to provide 80 per cent of
their capital funding), which offered a ‘profound and promising change
in the way international development is financed and conducted’.
USAID has ‘embraced this change’ and adopted the ‘Global Develop-
ment Alliance (GDA) business model’ to cultivate more than 600
alliances with 1,700 partners, using $2.1 billion in public funding to
leverage $5.8 billion in private money (USAID 2007: iii, 1), including
global level partnerships with Intel, Starbucks, Microsoft and Cisco
(USAID 2007: 1). Whether this rise in financing is a permanent one, or
capital rushing to escape the Northern epicentre of the credit squeeze by
buying up Southern assets, is an open question. What is probable,
however, is that the public money used to leverage the private has been
used as subsidy or technical assistance, and does not result in profit-
carrying assets, whereas the private money will result in wealth-creating
assets for some time, long into the future.
Conclusion
The promotion of financial regulation and coordination has been a
feature of the Bretton Woods settlement since the Second World War,
and alongside this role of regulation there have always been contested
spaces of power: between a bounded national sovereignty on the one
hand and the imperatives of a global capitalist economy on the other.
In this the British market makers are no exception, as an early row in
1949 between the Commonwealth Development Corporation (CDC)
and the newly formed International Bank for Reconstruction and
Development (IBRD) illustrates. In this prescient case the management
of liquidity in the overseas territories of the British imperial state was
at issue, in an early situation of ‘credit crunch’ following the war and a
general shortage of dollars in the ‘sterling area’. The negotiations
concerned ‘American investment in the Colonies’, since at this point in
time, the IBRD was seen as a conduit solely for US money. Negotia-
tions broke down since the board of the CDC were ‘convinced that the
standard procedures of the International Bank are inappropriate in the
case of this Corporation’, rejecting a level of conditionality they consid-
ered only appropriate for less developed countries than Britain (CDC
1949: 6–7), since the:
security offered for the loan was not and could not be chal-
lenged. Apart from the fact that the assets of the Corporation
amounted to many times the amount of any loan contem-
plated, the capital and interest and the transferability of both
were to have been guaranteed by His Majesty’s Government.
(CDC 1949: 47)
THE BRITISH MARKET MAKERS
[89]
Bracking_06_cha05.qxd 10/02/2009 12:34 Page 89
To the CDC this amounted to ‘impregnable security’, such that they
express shock that the International Bank proposed:
[a] loan conditional upon the Bank’s being able to exercise a
documentary supervision over the numerous undertakings in
which some part of the equipment purchased might at some
time be used.
(CDC 1949: 47–8)
The CDC was unprepared to contemplate an early IBRD show of
conditionality given the power and status of a British Government
guarantee! Dismissing US investors’ fears, the CDC concluded that
growth of the Corporation would lead to a ‘demonstrably economic
institution through which American dollar investment in various
forms can be canalized’ (CDC 1949: 49). In chapters 7 and 8 we see how
this took place, such that the Bretton Woods era, despite its technical
demise with the US inconvertibility announcement in 1971, remains
one in which IFIs learned how to collectively manage the allocation of
liquidity to poorer countries. It was in solving these ‘problems’ facing
the American investor that the current global system, characterised by
the collectivisation of the management of development finance and the
socialisation of risk in the markets of the South, emerged.
This chapter has given an historical review of the frontier institu-
tions of the British state and an account of the changing role of the CDC
in managing investment and liquidity. The case study shows how one
dominant core lender in the global interstate system, Britain, worked
within the Bretton Woods system to make its bilateral development
finance work in the private sector of Southern countries, alongside
British firms. In this process it also made a profit for the British Trea-
sury. Over time, the needs of the ‘American investor’ combined with
the development aspirations of the Southern populations to render a
collectivised system with attendant rules and codifications of entry
and behaviour. Together, the bilateral lenders institutionalised finan-
cial leadership within more truly multilateral organisations: the World
Bank, IMF and IFC. The British case is specific in that it is bound up
with the closing history of territorial empire. However, the experience
of the CDC within empire, in particular, became an important catalyst
of how post-colonial institutions were structured, and in that sense, the
post-colonial structures directly carried relationships of power, of
command and subordination of Southern populations into the ‘post’
colonial era. The system of financial management of liquidity is the
materiality behind wider relationships of unequal power. Because of
this, it is no surprise that institutions such as the CDC were perfectly
placed to lead the neoliberal privatisation agenda. It is also within
MONEY AND POWER
[90]
Bracking_06_cha05.qxd 10/02/2009 12:34 Page 90
similar institutional contexts that the bilateral system emerged in other
European countries. Tensions arose between and within the Anglo-
phone, Francophone and Lusophone (Portuguese-speaking) zones
which came to be managed within the EU as it developed a ‘competi-
tion’ policy for aid projects, a collectivised market which nonetheless
continues to privilege European companies and financiers relative to
those outside.
Notes
1. A metaphor borrowed from Gallagher and Robinson (1953: 1), who used
it in a related context. They claimed that judging the size of empire merely
by territories under direct control missed the ‘informal empire’, the
submerged part of the iceberg.
2. And its liberal nature must not be overstated, since, as one example, it still
blames labour shortages on the ‘reluctance of backward people [sic] to
enter regular employment, [and their] limited use for cash wages’ (CDC
1950: 40)!
3. Sir William Rendell joined the Corporation in 1952, was appointed the first
General Manager in 1953, retired in 1973 and is credited with successfully
carrying out the Reith reforms from 1950 to 1959 of management stream-
lining and decentralisation through Regional Controllers, and
subsequently of developing an efficient management structure (CDC 1972:
8). He also wrote a rare history on which much of this section is based.
4. Between 1951 and 1955, 20 earlier ventures closed, although direct
management had to be used, ‘thus breaching a most sacred principle of the
time’, which demands private management (Rendell 1976: 36, 38).
5. Geoff Tyler was a CDC employee from 1983 to 2000, and then a retained
consultant from 2000 to 2004.
6. In the case of coffee, the Authority only paid 20–30 per cent of the sale
price to growers but still accumulated a debt of 40 million kwacha by 1999,
when it was privatised and bought by growers. (New Agriculturist online,
March 2004: www.new-agri.co.uk/04-2/develop/dev04.htm)
7. The relationship of Actis to CDC is described in a CDC press release as:
‘The firm was formed following a demerger from CDC in July 2004 when
it assumed all direct investment activity and operations previously over-
seen by CDC’. In May 2008 it had US$3.5 billion funds under management
(CDC 2008).
THE BRITISH MARKET MAKERS
[91]
Bracking_06_cha05.qxd 10/02/2009 12:34 Page 91
[92]
6 Poverty in Africa and the history
of multilateral aid
This chapter presents an overview of poverty in African countries
and then explores the role of the multilateral aid architecture that has
grown up in the last 60 years in ostensibly ameliorating widespread
poverty. That majority populations in African countries in particular,
as compared to their European, Asian or Latin American counter-
parts, suffer from acute poverty, is not generally contested. In the
United Nations Development Programme’s (UNDP), ‘human devel-
opment index’ (HDI) for 2007–08, the lowest ranking 24 countries
were in Africa, and of the lowest 50, 38 were African. In 2005, incom-
ing private investment was in single figures or negative (Angola) in
all of the bottom 20 African countries by the ranking (except Chad,
where it was 12.9 per cent of GDP), and in the table of African coun-
tries as a whole, foreign direct investment (FDI) was in double figures
in 2005 in only five – Seychelles (11.9%), Equatorial Guinea (57.6%),
Congo (14.2%), Gambia (11.3%) and Chad (12.9%).
1
In a further HDI
category covering ‘other private flows’ – which are ‘non-debt-
creating portfolio equity investment flows, portfolio debt flows and
bank and trade-related lending’ – 22 were negative in 1990, with
eight not recording any value, and Eritrea and Namibia not existing,
and a further twelve remained negative in 2005, with seven not
recording. In other words, there was considerable disinvestment of
‘free-floating’ portfolio holdings within Africa in both these years,
and presumably most of those in between. Meanwhile, the aid
dependence of the countries at the low end of the HDI ranking
is reflected in the high figures of Official Development Assistance
(ODA) receipts as a proportion of GDP.
These figures are significant because without adequate fiscal
resources social spending to alleviate poverty is undermined: if the
government, and by extension the country as a whole, has no money,
it can’t be expected to fund social welfare. In other words, intuitive
logic would suggest that the debt burden requires to be lifted and aid
needs to increase, to allow the theoretical chance of government
revenue and then its passage to those needing social welfare and
protection. This is not to argue that the availability of aid and finance
is the only factor which affects the quality of social services in Africa,
far from it, since there is a complex relationship between the state of
fiscal balance in a country and the quantity and quality of social,
health and educational services. For example, the oil-rich Angolan
Bracking_07_cha06.qxd 12/02/2009 10:55 Page 92
elite have managed to run up a debt of $11 billion despite oil-related
earnings of $8 billion a year (Global Witness 1999: 6, cited in Fergu-
son 2006: 198–9), and despite the borrowing, had only managed a
paltry 162nd place on the HDI by 2007. Also, how far these aggregate
figures translate to people’s lived experience of poverty is difficult to
deduce, although the difference between contemporary poverty and
traditional frugality and scarcity is to be found both in the context of
increased global inequality, which renders relational context more
extreme, and in people’s knowledge and perception of that inequal-
ity, which has also been enhanced, not least because of sustained
contact with development discourse and practice.
Thus economic deprivation is not, as Mbembe reminds us, a simple
story for contemporary Africans, but involves:
an economy of desired goods that are known, that may some-
times be seen, that one wants to enjoy, but to which one will
never have material access.
(Mbembe 2002: 271, cited in Ferguson 2006: 192)
Indeed, global inequality has been increasing rapidly (Easterly 2001),
and the economic gap between the rich and poor is extreme and seem-
ingly unbreachable, discouraging the once fashionable talk of
developmental convergence in income or quality of life and encour-
aging the view that socio-economic status and income are just a matter
of place within a de-temporalised hierarchy (Ferguson 2006). In other
words, there is no improvement envisaged in order to progress to
where others are: those with the desired goods. Many African coun-
tries are even worse off in absolute terms than they were 20 or 30 years
ago, which adds to the cruelty of appreciation of one’s poverty: not
only are you worse off than your parents, but other people have
become richer in the meantime and you are unlikely to have a change
in status over the course of your lifetime. The current hierarchy is de-
temporalised in the sense that the modernisation paradigm has
decomposed, and while culture has enjoyed a consequent move to
coeval pluralities and ‘alternative modernities’, socioeconomic
inequality is left with nowhere to go, no evolutionary promise of
betterment: countries are no longer ‘behind’ they are ‘beneath’ or
‘somewhere else’ (Ferguson 2006: 183–92).
What we can say with some certainty is that some of the reason why
many African economies fail to provide for their populations is
provided by the aggregate data on total available finance, and that this
is then compounded or ameliorated by political contexts and fiscal
policy. Getting the balance of explanation right is important: too much
emphasis on the former issue of finance ‘framing’ causality lets elites
POVERTY IN AFRICA AND THE HISTORY OF MULTILATERAL AID
[93]
Bracking_07_cha06.qxd 12/02/2009 10:55 Page 93
off the hook, while too little on the former and too much emphasis on
domestic politics serves only to pathologise African elites and political
systems. However, in an absolute and relational context it remains
clear that the outcome of these two sets of processes is, in most African
countries, both exceptionally cruel and unprecedented, given other
people’s contemporary wealth. For example, the extent of service
delivery failure for poor Africans is acute, as this example from the
health sector illustrates:
Africa currently loses over 8 million people a year mainly to
TB, HIV, Malaria, maternal mortality this tragic loss which is
the equivalent of whole countries dying out and greater than
losses from all modern conflicts combined is a result of weak
or collapsed public health systems.
(Africa Public Health Development Trust,
cited at Abdul-Raheem 2008)
In the case of HIV/AIDS, for example, of the estimated 6.5 million
people in need of antiretroviral (ARV) treatment in June 2006, only 1.65
million people were reported to have had access to ARV treatment in
low- and middle-income countries (UNAIDS 2008, citing World Health
Organisation (WHO), June 2006).
2
This has made many wonder that African lives can be deemed so
expendable, including Stephen Lewis, the UN Special Envoy for
HIV/AIDS in Africa, who asked:
What is it about Africa that allows the world to write off so
many people – to make people expendable – when all the
money needed is found for war on Iraq? Is it so over-
whelming? Have wealthy countries simply washed their
hands of Africa? Is it too far away? Is it subterranean racism?
(Mail and Guardian, 29 November to 5 December 2002,
cited in Jones 2004: 385)
This problem of distance is at the centre of the political and cultural
problem of relational poverty. As Mayer summarises, again in terms of
the HIV/AIDS pandemic:
the real problem remains one of political will on most fronts, of
social and political isolation of first world countries from the
realities and tragedies of HIV in sub-Saharan Africa, and of
their continuing perception that the African epidemic is still
far away.
(Mayer 2005: 12)
MONEY AND POWER
[94]
Bracking_07_cha06.qxd 12/02/2009 10:55 Page 94
This isolation, or distance, confines African people to expendability, as
it contributes to profound chronic relief failure. This is not to say that
African people are distant from each other, far from it. Rather, a
plausible explanation for why rich people and their governments fail
to assist is that they feel distant and act somewhere else. Also, efforts
to help, when solidarity is expressed, have not worked for a series of
reasons, some of which we explore in chapter 10.
Contemporary development research and poverty
The extensive statistical lows of poverty across Africa have led to a
veritable cottage industry in recent years of poverty research, much of
which addresses the likely (non) achievement of the Millennium
Development Goals (MDGs) agreed in 2000 and set for 2015. Woolcock
summarises this recent poverty research as having established a
number of related propositions, namely that:
poverty has many dimensions, that among these dimensions
income is centrally important, and that inclusive (“pro-poor”)
economic growth policies are necessary but insufficient for
reducing it.
(2007: 1)
He notes that ‘poverty traps’ has become the ‘policy shorthand for the
microeconomics of poverty’, while ‘inequality traps’ (citing World
Bank 2005) are the equivalent for non-economics perspectives. In its
simplest form, inequality traps refers to ‘durable (compare Tilly 2000)
structures of economic, political, and social difference that serve to
keep poor people (and by extension, poor countries) poor’ (Woolcock
2007: 4). Much chronic poverty is intergenerationally transmitted, and
affects women, children, sick people and those with disabilities dispro-
portionately to others. Those who are identified as most vulnerable,
through vulnerability analysis, are those most affected by adverse life
chances and shocks, generally those who are also members of lower
social classes and/or suffer social stigma (CPRC 2004; see also Oppong
1998 on HIV and vulnerability).
However, while a great deal of research has confirmed what was
already known intuitively about who is poor – the weak, sick and
vulnerable, and those who are unable to work – there has been
comparatively little research to establish why this might be the case in
a relational context (Green and Hulme 2005). A promising central
theme though is the theorisation of distance referred to above –
cultural, structural and spacial – which serves to facilitate an absence
of empathy for the poor. As Woolcock puts it, ‘distance reduces elective
POVERTY IN AFRICA AND THE HISTORY OF MULTILATERAL AID
[95]
Bracking_07_cha06.qxd 12/02/2009 10:55 Page 95
affinity and sense of shared interests’ (2007: 4) between rich and poor,
such that the rich, citing Skocpol (1990), live in a different ‘moral
universe’, with political characteristics and liberal democratic mores
that are often starkly different to the political contexts in which poor
people live, such that political solutions which are advocated, and
which rely on these mores, often don’t fit the place they are intended
for (Bracking 2005). In short, the poor are often confined to discrete
cultural and social networks, which nonetheless form the basis of their
survival (compare Fafchamps 2006), and are often found in spacially
remote places, where their social exclusion is secured from the rela-
tively wealthier not least by political systems that exclude them. This
is first and foremost a relationship of space, ordered by the political
economy of development globally, itself configured by structures of
power globally and locally.
Place, poverty and culture
Ferguson in Global Shadows has written an extremely pertinent book on
culture and aspiring to global place in the context of relational poverty.
It is worth quoting at some length. He notes that:
[It] is not that analysts of Africa ought to focus on “political
economy” instead of “culture” (as if economic inequalities
were somehow non-cultural or cultural differences were
somehow immaterial or apolitical). It is, rather, that the ques-
tion of cultural difference itself is (everywhere, no doubt, but
perhaps especially in contemporary Africa) tightly bound up
with questions of inequality, aspiration, and rank in an
imagined “world”.
(2006: 19)
In other words, people frame, understand and ‘feel’ poverty through
culture and not being ‘like’ richer people. Moreover, the resulting
African aspiration to ‘likeness’ ‘forces an unsettling shift from a ques-
tion of cultural difference to the question of material inequality’ (2006:
20), such that:
yearnings for cultural convergence with an imagined global
standard … can mark not simply mental colonisation or capit-
ulation to cultural imperialism, but an aspiration to overcome
categorical subordination. The persistence of cultural differ-
ence, meanwhile (however inventive and hybrid it may be),
can come to appear as the token not (as it often appears to the
anthropologist) of brave cultural resistance, but of social and
MONEY AND POWER
[96]
Bracking_07_cha06.qxd 12/02/2009 10:55 Page 96
economic subjection (where a “traditional African way of life”
is simply a polite name for poverty).
(2006: 20–1)
This is an important corrective to both an overactive academic political
correctness which sees just cultural difference when there is economic
poverty, but also a corrective to a residual and popular reading of
‘African life’ which suggest that poverty does not impact as much as
‘we’ in the West would suspect, because areas of rural Africa are
uncommodified or enjoy a ‘traditional way of life’ where $1 a day ‘goes
a long way’.
Ferguson’s argument also impacts greatly on efforts to tackle
African poverty, since he is pointing out the neglect of economic
inequality which has become permissible because of the ‘cultural turn’
in social science. Thus, while it was an achievement to recognise
contemporary African culture as ‘modern’ rather than ‘backward’,
African views of everyday life and culture as signifying their low
socioeconomic ranking have been simultaneously occluded. This then
demotes economic justice from development agendas. The political
consequences of Ferguson’s corrective is that:
the most challenging political demands go beyond the claims
of political independence and instead involve demands for
connection, and for relationship, even under conditions of
inequality and dependence.
(2006: 22)
In other words, economic hierarchy needs to be foregrounded again,
not least because, as Mbembe (2002) reminds us, aspiration for inclu-
sion and connection relates to an acute and accurate knowledge of
what global inequality means on the part of the poor themselves.
We can turn the question around somewhat and ask not ‘what
makes some people poor’ but ‘what makes some people allow poverty
and what prevents them from forming relationships and empathy with
their fellow humans’? On this question, which has been much less
researched, we can only note some tentative possibilities as to what
that relationship is prevented by: racial ‘othering’; clumsy and popular
accounts of cultural difference that suggest the poor are responsible or
culpable for their own circumstances, perhaps because of inappro-
priate consumption of alcohol or drugs; blaming people’s cultures for
‘irrational’ behaviours which undermine the (otherwise) ‘scientific’
interventions of aid workers; an overly ‘cultural turn’ that occludes
poverty and insists on plurality of experience (Ferguson 2006); and the
simple logistics of poverty which prevent poor people from doing
POVERTY IN AFRICA AND THE HISTORY OF MULTILATERAL AID
[97]
Bracking_07_cha06.qxd 12/02/2009 10:55 Page 97
‘recognisable’ things that prompt relationship, like going to town on
the bus (fieldwork, Chivi, 2005). There are also various excuses for
non-intervention which mirror the TINA (‘there is no alternative’)
argument in economics, that nothing can be done because, to cite a
current trope, ‘their’ own elites are ‘too corrupt’ and aid money won’t
reach them anyway.
There is also the possibility that Ferguson (2006) can be misread,
and that the argument risks a romanticisation of African aspiration
which overemphasises ‘culture’ in the sense of global inclusion being
won through iconic global goods, cell-phones, designer jeans and so
forth, an aspiration which overemphasises this in relation to more
mundane desires for basic commodities, school fees and the like.
Ferguson’s case study of a Zambian internet magazine illustrates the
scenario of the young searching for and using the technology of the
modern, but equally there is a greater majority who would want bread
and meat as a signifier of inclusion. Whatever the finer points here, the
problem of distance does not deter the transnational epistemic aid
community from passing resolution after resolution aiming and prom-
ising to reduce poverty, themselves largely absent and critically distant
from the subjects of their policy. Abdul-Raheem at the NGO Justice
Africa called this the process of ‘resolutionism’ in his ‘Tajudeen’s
Thursday Postcard’ (Abdul-Raheem 2008).
Thus, the African Renaissance, New Partnership for African
Development (NEPAD), the Commission on Africa, the Millennium
Challenge Account and the poverty reduction strategy (PRS) process,
all share the paradigmatic coordinates of an African crisis suppos-
edly ‘made in Africa’ by irredeemable and intractable failures and
inappropriate behaviours, which re-renders Africa as failed,
intractable and (inaccurately) uniformly poor and needy. Corrupt
elites are given a particularly nefarious central agency. But corrupt
government and rapacious elites in Africa did not make the current
crisis of African economies and welfare states, they are a symptom of
it, although their behaviour can, and often does, make it more
intractable. What is being made, instead, in these keynote transcripts
and dominant cultural practices (aid conditionality), is not an accu-
rate, empirically grounded and historically informed analysis of
African ‘reality’. It is instead a narrative that says more about the
writers and promoters, and the wider beliefs of the ‘development
community’, than about the avowed subjects. It is a culturally
embedded understanding of African socioeconomic processes and
cultural life, written largely by people who don’t live there, which
denies historical connectivity (slavery, colonialism, debt peonage);
contemporary connectivity (internet communities; the World Social
Forum; shared coeval history; diasporas; ‘modern’ middle classes;
MONEY AND POWER
[98]
Bracking_07_cha06.qxd 12/02/2009 10:55 Page 98
educated, urban and professional Africans; debt peonage); and future
connectivity (without a better policy response than this, Africans will
feel, rightly, demonised and forsaken, and will seek autarchy, while a
number who are chronically poor and sick will die). Waiting around
for the MDGs to not be met is also a tedious intellectual milieu in
which conservatism in human objectives – who said we only wanted
to half the proportion of people in poverty, rather than eliminate it
altogether? – has been written into policy to 2015, regardless of other
more radical proposals which could have been attempted in the
meantime.
Resolutionism also discourages historical evaluations of what has
been tried to date in favour of a future which is always just around the
corner, with a bit more effort and research in the present. This tends to
conservative prescription and practice, again, because those very polit-
ical economy processes that have made poverty in the present are not
examined. Poverty was not made in the absence of efforts in the area
of development ‘aid’, but in spite of it, and alongside it, and sometimes
because of it, as the analysis in this book argues. Bearing this in mind,
the rest of this chapter, and the next two, will explore the suggestion
that the process of the political economy of concessional relationship
and development finance might not be helping, might not help to
attain the MDGs in the future, and indeed, might be a process in which
poverty is, in a counterintuitive proposition, embedded and produced.
So what is aid, how does it work, and why might there be problems
with it?
The theoretical contribution of multilateral
development assistance
One of the earliest arguments for multilateral activity to reduce
poverty is that foreign assistance can provide a much needed global
public good: not only can it help poor people, but it provides a shared
infrastructure for international trade and finance, and helps to main-
tain peace and political stability (Krueger 1986). The public good
nature of aid, particularly from multilaterals, ‘springs from its unique
ability to overcome global market failures in international trade and
finance, particularly adverse selection and moral hazard in interna-
tional credit and insurance’ (Mellor and Masters 1991: 505), thus, in
conventional economic terms, increasing the efficiency of global
resource allocation. In other words, official development finance
helps to raise the availability of credit for poorer countries. As we
saw in chapter 4, official creditors have more recourse to powerful
states should a risk of default occur, have broad portfolios with a
high diversification of risk, and can lower the initial cost of capital
POVERTY IN AFRICA AND THE HISTORY OF MULTILATERAL AID
[99]
Bracking_07_cha06.qxd 12/02/2009 10:55 Page 99
through economies of scale in bulk borrowing. In addition, currency
and exchange rate swaps lower the cost of loanable capital, while
retained earnings from successful ventures have been impressive. For
example, by 1985, the World Bank had accumulated $5.2 billion in
retained earnings from its operations, more than the total paid-in
capital from donors of $5.1 billion (see Blitzer 1986, cited in Mellor
and Masters 1991: 507). In June 2007 ‘retained earnings and other
equity’ for just the International Bank for Reconstruction and Devel-
opment (IBRD) (not including the International Development Associ-
ation (IDA)) were valued at $27,127 million, calculated on a current
value basis (World Bank 2007: 7), a figure repeated elsewhere as a
‘fair value’, but slightly larger at $28,440 million on ‘carrying value’
terms (World Bank 2007b: 93). While there can be problems surround-
ing the funding of global public goods, the free rider scenario being
the most obvious, in neoclassical accounts, at least, development
finance encourages the banks and the market to work more effi-
ciently. In our terms, it extends capitalist markets and regulates
dependent development.
To summarise arguments made earlier, aid in our terms is referred
to as development finance – rather than ‘aid’ which suggests an uncrit-
ical benevolence – which is the provision of liquidity through public
institutional frameworks. Only a small component of this is worthy of
the ‘benevolent’ signifier; that tiny grant element spent directly on
social welfare. Development finance is a category of second-line
liquidity, the vast majority of which is borrowed rather than given, as
low interest, long term (mostly) government to government lending,
through either direct multilateral payments to international financial
institutions (IFIs), or payments channelled through bilateral financial
institutions. It is conventionally organised, particularly so since 1997,
to reduce poverty. But some further definitions of ‘aid’ are required
here. Official Development Assistance involves flows to developing
countries and multilateral institutions from official government agen-
cies, flows which have ‘economic development and welfare as [their]
main objective’ with a grant element of at least 25 per cent, which
excludes export credit used solely for export promotion (OECD 2008).
‘Official Development Finance’ (ODF), is defined as Official Develop-
ment Assistance (ODA) combined with all development-oriented
multilateral flows, while ‘Other Official Flows’ (OOF), is everything
else vaguely developmentally inspired. To be development-oriented
can mean flows which are non-concessional since these are, by
increasing convention, included in the statistics for ‘multilateral aid’,
with the major exception of IMF credit.
3
Mellor and Masters explain
that this convention was increasingly used by the Development
Assistance Committee (DAC):
MONEY AND POWER
[ 100 ]
Bracking_07_cha06.qxd 12/02/2009 10:55 Page 100
because they judge that interest rates and payment structure
(which determine the ‘concessionality’ of aid) do not fully
describe multilateral aid. In particular, nonconcessional multi-
lateral aid is additional to what would be otherwise available
at that interest rate, is often targeted toward public goods, and
may be accompanied by valuable technical assistance. It may
also serve as a catalyst for other funds For these reasons, it
functions more like bilateral ODA than like a nonconcessional
bilateral flow.
(Mellor and Masters 1991: 504)
4
We are, therefore, analysing flows of money disbursed by multilateral
institutions which can be more expensive than commercial rates, but
which are deemed concessional by those who lend them, because they
project a positive developmental light on their institutional context. So
the Commonwealth Development Corporation (CDC), International
Finance Corporation (IFC) and other bilateral export and multilateral
disbursers of aid can view their flows as concessional, despite transac-
tions at ‘market’ interest rates or above. Inflated generosity can further
be suggested when the agencies’ own figures are reported in the
media, such as in World Bank press releases, because far and away the
largest element of resource transfer of the IFIs takes the form of non-
concessional loans, which therefore falls outside even this conservative
OECD definition of aid (ODA), but people assume that they are refer-
ring to aid because of the organisation which is doing it. In other
words, an impression of generosity is exaggerated by the inclusion of
commercial flows, when the CDC or IBRD announce a commitment.
While a proportion of these non-concessionary funds is channelled to
ODA-qualifying countries and used to support development projects,
a large part is not but rather, for example, used for export credits for
military equipment sales or to fund a new port for a timber exporter,
or some such.
Indeed, Riddell makes the point that there are three different types
of multilateral agency – the group of IFIs, which are the principal
subject of this book; the UN agencies; and a growing collection of
‘others’, such as the Bill and Melinda Gates Foundation or the Global
Fund to Fight AIDS, Tuberculosis and Malaria (GFATM) established in
2002 – which collectively disburse about one-third of all ODA (Riddell
2007: 77, citing Rogerson et al. 2004: 29–31). The developmental value
of the two latter types is more easily demonstrated in direct transfers
of life-saving resources. However, the IFIs’ activities are larger than the
other two types, accounting for 44 per cent of total net multilateral
ODA disbursements in 2004 and 71 per cent if the EC aid is excluded
(Riddell 2007: 78). But, this actually underestimates their activities
POVERTY IN AFRICA AND THE HISTORY OF MULTILATERAL AID
[ 101 ]
Bracking_07_cha06.qxd 12/02/2009 10:55 Page 101
since that proportion of money disbursed by IFIs which is strictly
counted as ODA – with the grant element, and which is used for this
statistic – is generally a small proportion of their total turnover. For
example, Riddell gives the example of 2004, where the IFIs together
provided just over $9 billion in ODA (net disbursements) to ODA-
qualifying countries, but their total spend in these countries was nearly
five times that figure at just over $34 billion (Riddell 2007: 80, citing
OECD 2006: 200). A quite astonishing statistic is that ‘Excluding EC
aid, the IFIs accounted for almost 90 per cent of all gross concessional
and non-concessional funds channelled to ODA-qualifying developing
countries, the UN’s development and humanitarian agencies
accounting for only 8 per cent of the total’ (ibid.). These differences
have also widened over time, with a similar figure for the early 1990s
being that the UN agencies contributed 17 per cent of flows. In total,
the IFIs provide twice as much official ODA as all the aid provided by
the UN agencies in 2003, and in addition, their gross disbursements
were ten times as large, at $36.5 billion compared to $3.5 billion.
In other words, the official statistics record a lower figure than
actual disbursements, meaning that ‘the reach and influence of the IFIs
is far greater than the official statistics would suggest’ (Riddell 2007:
80). For those commentators who view IFI activities as an unqualified
success, this extra commercial reach will be considered a welcome
bonus. Thus, the income and expenditure figures recorded by most
multilateral agencies are ‘considerably and consistently’ higher than
the equivalents recorded in official statistics, because the bulk of their
spending – such as money to countries which are not poor, or ODA-
qualifying, or which is tied to particular projects and therefore
classified as bilateral – do not count within the stricter official statistics.
Most of it is commercial loans to the private sector, and this gap
between official ‘aid’ and agency recorded business can be wide.
Riddell reports, for example, for the less commercial United Nations
Children’s Fund (UNICEF), that in 2003 its worldwide expenditure
was nearly $1.5 billion, while the OECD recorded its net ODA
disbursements at only $629 million (Riddell 2007: 78). Therefore, it is
possible to read the figures promoted by the organisations themselves
and get an inflated view of their actual grant-making or developmental
character, because one might reasonably but erroneously assume that
they are reporting ODA rather than turnover, which is generally the
norm. While in the case of UNICEF, this might not be such a big
problem, because their other expenditures which are not ODA are
probably pretty much spent on welfare, staff and overheads in any
case, for other institutions this difference is more misleading. For
example, in the case of IFIs, the official figures hide the actual larger
extent of commercial activity, a tendency which is exacerbated by the
MONEY AND POWER
[ 102 ]
Bracking_07_cha06.qxd 12/02/2009 10:55 Page 102
habit of their publishing ‘net disbursements’ rather than balance sheet
‘profits’: this underplays the amount which is paid back. For example,
in 2003 a gross transfer of about $26 billion of non-concessional flows
was ‘wiped out’ by a reverse flow of $33 billion in repayments from
previous loans, making a balance of $7.2 billion in the IFIs’ favour
(Riddell 2007: 80). These repayments scuppered the apparent
generosity of ‘new’ ODA for that year of $10.8 billion, reducing the
combined net flow of concessional and non-concessional to only
$3.6 billion (ibid.). Needless to say, it tends to be the former ‘new aid’
figure that hits the news headlines or is announced by development
ministers, not the net figure with profits included.
Another error of reporting is also common. This is where authors
inflate the developmental character of the monetary flows of IFIs, by
talking about concessional provision, without putting it into the
context of all the flows that are counted when total figures are
announced. For example, Calderisi (2006) argues that there are a
number of ‘excuses’ which are used to shift the blame for African
development failure to agents outside Africa – slavery, imperialism,
former colonialists and so forth – illustrating his (dubious) point with
a summary of development assistance that portrays it as exceptionally
generous. Calderisi writes:
since 1985, most new assistance for Africa has been in the form
of grants or near-grants. All World Bank assistance has come
from a special fund that allowed it to offer 40-year loans, with-
out interest. The European Union, which controls the other large
multinational fund for Africa, provides total grants rather than
soft loans. Other countries would be pleased to have such help
rather than lament the way the world is treating them.
(2006: 29)
While he is correct about these particular vehicles of assistance, the
remark is not contextualised relative to all flows, which leaves the
reader with the impression, and ubiquitous misunderstanding, that the
big numbers often quoted on ‘aid’ apply to grant assistance of these
types. The truth is more qualified, as we see below, since most assis-
tance is commercially oriented, bilateral and relates to export credits,
leaving these types of special concessional funds a much smaller
proportion of all accounted development assistance.
5
A short history of multilateral development finance
With these definitions and the consequent problems of reporting in
mind, Table 6.1 shows the flows of Official Development Assistance
POVERTY IN AFRICA AND THE HISTORY OF MULTILATERAL AID
[ 103 ]
Bracking_07_cha06.qxd 12/02/2009 10:55 Page 103
(ODA), Official Development Finance (ODF) and Other Official Flows
(OOF) to developing countries in aggregate, and then the latter to
Africa, from 1960 to 2007. ODA rises steadily over the whole period,
but starts to climb quite rapidly from 2002 to 2003 onward, reaching a
new plateau of over $100,000 million from roughly $50,000 million in
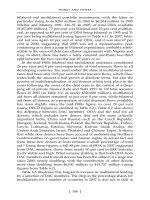
constant prices. This very recent hike in ODA is illustrated for its effect
on African flows in Figure 6.1, and looks impressive. However, other
flows compromise this story.
Multilateral assistance, as opposed to bilateral flows, is roughly
one-third of the total, and rises proportionately to bilateral aid,
although payments to the IFIs are quite sporadic. The total bilateral
OOF includes export credits, and during the years 2000 to 2006, six of
the seven entries were quite sharply negative, with only the single
positive year of 2005 which is shown in Table 6.1, indicating that flows
were returning back to DAC members in repayments and liabilities,
rather than being donated. Indeed, in 2006 the figure was a signifi-
cantly negative $9,774 million! In terms of the two lines for Africa in
particular, the OOF figures were negative in five of the seven years
since 2000, and were only positive in 2002 and 2003. The ODF flows
remained healthily positive, but as the definitions indicate, these
include finance transferring at non-concessional rates. Thus, official
aid, or ODA, might have been rising, but other related flows have
compromised the net resource transfer.
In the early 1970s, in a period of rapidly growing total aid, both
bilateral and multilateral lenders increased the share of funds to the
least developed countries influenced by the 1970s emphasis on help-
ing the poorest. While members of the OECD DAC’s bilateral flows
MONEY AND POWER
[ 104 ]
Figure 6.1 Official Development Assistance to Africa, 1990–2006
Source: African Development Bank (2008), Group Financial Presentation
ODA US$ bill
ODA
50
40
30
20
10
0
1990
1992
1994
1996
1998
2000
2002
2004
2006
$bill
Year
Bracking_07_cha06.qxd 12/02/2009 10:55 Page 104
shifted away from the least developed countries in the late 1970s,
they shifted back a few years later, although toward the Middle East,
North Africa and sub-Saharan Africa at the expense of Asia (Mellor
and Masters 1991: 343). There was a rapid increase in ODA to multi-
laterals in the earlier period, and shown in Table 6.1, but also in
POVERTY IN AFRICA AND THE HISTORY OF MULTILATERAL AID
[ 105 ]
Table 6.1 OECD members’ aid to developing countries, 1960–2007
Notes:
OECD (Organisation for Economic Co-operation and Development), ODA (Official Development
Assistance), ODF (Official Development Finance), OOF (Other Official Flows). In millions of current
US$, various years.
(1) From ‘ODA by Donor’, Table 1, at OECD.StatExtracts:
/>(2) From DAC1, ‘Official and Private Flows’, at:
/>In the years 2000–06 only two years were positive.
(3) From DAC2b, ‘Other Official Flows’, at:
/>OOF are defined as ‘official sector transactions which do not meet the ODA criteria, e.g.: i.) Grants to
aid recipients for representational or essentially commercial purposes; ii.) Official bilateral transactions
intended to promote development but having a grant element of less than 25 per cent; iii.) Official bilat-
eral transactions, whatever their grant element, that are primarily export-facilitating in purpose. This
category includes by definition export credits extended directly to an aid recipient by an official agency
or institution (“official direct export credits”); iv.) The net acquisition by governments and central
monetary institutions of securities issued by multilateral development banks at market terms; v.) Subsi-
dies (grants) to the private sector to soften its credits to aid recipients [see Annex 3, paragraph
A3.5.iv)b)]; vi.) Funds in support of private investment.’
(4) From DAC ref_Reference Total ODF, at:
/>ODF is defined as ‘the sum of their receipts of bilateral ODA, concessional and non-concessional
resources from multilateral sources, and bilateral other official flows made available for reasons unre-
lated to trade, in particular loans to refinance debt.’
Source: OECD, statistics databases online for DAC country members.
US$ mill. 1960 1970 1975 1980 1985 1990 1995 2000 2005 2007
ODA, 4,676 6,713 13,254 26,195 28,755 54,264 58,780 53,749 107,099 103,655
total
(1)
Bilateral 4,094 5,672 9,808 16,983 21,190 38,462 40,481 36,064 82,445 71,666
ODA
Multilateral 582 1,277 4,046 9,212 7,566 15,802 18,299 17,685 24,653 31,988
ODA
OOF,
(2)
300 1,122 3,912 5,037 3,144 8,648 10,070 –4,326 1,430
to all
developing
OOF, to 55 233 1,050 1,182 851 3,577 –333 –494
Africa,
total
(3)
ODF,
(4)
4,412 7,806 21,140 40,480 43,483 73,778 70,964 55,393 115,684
to all
developing
ODF, 1,418 1,766 6,870 12,098 14,594 27,773 26,210 14,800 37,114
to Africa,
total
(4)
Bracking_07_cha06.qxd 12/02/2009 10:55 Page 105