Opal''''s Site Organization and Development of Russian Business_7 ppt
Bạn đang xem bản rút gọn của tài liệu. Xem và tải ngay bản đầy đủ của tài liệu tại đây (250.93 KB, 23 trang )
Corporate Governance and Managerial Turnover 123
called “the great transformation” and the degree of adaptation by its citi-
zens to the new principles of life in a market economy.
Although the empirical results are mixed, many financial economists con-
firm the statistically significant impacts of the governance mechanism and
corporate performance on managerial turnover in developed countries.
1
As
we will discuss later, empirical evidence does exist concerning the close rela-
tionship between ownership structure and managerial turnover in Russia.
With regard to the impact of corporate performance on the dismissal of
poor performing managers, however, there are only a handful of papers sup-
porting the empirical relation between the two elements (Muravyev 2001,
2003a, 2003b; Kapelyushnikov & Demina 2005). As many researchers of the
Russian economy have pointed out, the insignificant or neutral association
between bad performance and managerial turnover in Russian firms is due
to the obstinate managerial entrenchment in the background of substan-
tial insider ownership as a result of the mass-privatization policy, weakly
functioning internal corporate organs, and deep informational asymmetry
between management and outside shareholders (Iwasaki 2007b). Although
their arguments are convincing, taking the degree of economic transforma-
tion and the current social circumstances in Russia into consideration, we
feel that there is room for more detailed research on this topic.
In this chapter, we deliberate the possible impacts of governance systems
and corporate performance on managerial turnover in Russian firms. As in
other chapters of this book, we utilize the results of the joint survey as the
basis for our empirical analysis.
From a methodological perspective, this study is different from most pre-
vious work in that we deal not only with CEO dismissals but also with man-
agerial turnover in a company as a whole, assuming that different types of
shareholders may have distinct impacts on the removal of poorly perform-
ing managers.
2
We found that nonpayment of dividends is significantly cor-
related with managerial turnover in our samples. We also found that the
presence of dominant shareholders and foreign investors is another impor-
tant factor causing managerial dismissals in Russian corporations, but these
two kinds of company owners reveal different effects in terms of turnover
magnitude.
The remainder of this chapter is organized as follows. The next section
reviews preceding studies on managerial turnover in Russian firms. The third
section discusses testable hypotheses and empirical methodology. The fourth
section describes the data. The fifth section presents our empirical results on
the determinants of managerial turnover, and the sixth section concludes.
Managerial turnover in transition Russia: Literature review
3
Many studies have been devoted to the CEO turnover observed in developed
countries because this phenomenon offers a unique dimension to corporate
9780230_217287_07_cha05. dd 123 5/14/2009 3:47:53 PM
124 Organization and Development of Russian Business
governance theory. Likewise, this theme is also a center of attention for those
involved in the study of Russian corporate governance. In fact, many research-
ers and research teams have conducted studies on CEO turnover from the view-
point of the appointment date of the current president and the reason for the
resignation of the predecessor in order to use the data in empirical studies.
Although abundant information on managerial turnover in Russia is avail-
able from these survey papers, most of them simply show the percentage of
enterprises that experienced a CEO replacement during a given survey period
but not changes in the turnover rate over time. Therefore, we estimated the
annual CEO turnover for each year from 1993 to 2003 by examining the rel-
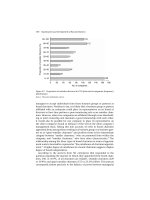
evant data available in 14 papers. Figure 5.1 contains a plot of simple means
as well as weighted means by sample size in individual surveys. Dolgopyatova
(2003) suggested that CEO turnover increased after the 1998 financial crisis.
However, the data in Figure 5.1 suggest that it is highly possible that such an
upward trend started earlier than that event. In fact, the differences between
the average turnover for 1996 and that for 1997 are statistically significant at
the 1% level by the one-tail test (t ϭ 3.55, p ϭ 0.004), whereas the differences
between 1997 and 1998 are not significant (t ϭ 0.474, p ϭ 0.323). Furthermore,
a regression analysis of CEO turnover adapted from the reform years (setting
1993 to 1 as the starting point) and the use of a level-shift dummy (set at 1
for 1997 onwards) as an explanatory variable led to the conclusion that there
was a statistically significant average divergence of 5.8% in CEO turnover
between the two subperiods of 1993 to 1996 and 1997 to 2003.
4
3
6
9
12
15
1993
1994
1995
1996
1997
1998
1999
2000
2001
2002
2003
(%)
Simple mean Weighted mean
Figure 5.1 Changes in CEO turnover frequency, 1993–2003
Source: Authors’ illustration based on Klepach et al. (1996) (covering 66 firms); Linz (1996) (1,714
firms); Filatotchev et al. (1999a) (314 firms); Filatotchev et al. (1999b) (98 firms); Radygin &
Arkhipov (2000) (872 firms); Goltsman (2000) (217 firms); Kapelyushnikov (2001) (135 to 156
firms); Rachinsky (2001, 2002) (110 firms); Gurkov (2002) (530 firms); Muravyev (2003a) (413
firms); Dolgopyatova (2003) (523 firms); Dolgopyatova (2004) (20 firms); and Dolgopyatova &
Kuznetsov (2004) (328 firms).
9780230_217287_07_cha05. dd 124 5/14/2009 3:47:53 PM
Corporate Governance and Managerial Turnover 125
As indicated in Figure 5.2, after the mass privatization of state-owned
enterprises conducted in early 1990s, the year of 1997 became the first year
when the average share of insider ownership fell below 50%.
5
In the same
year, the average age of top managers was nearly as high as their retirement
age, with the proportion of CEOs older than 60 topping 28%. In addition,
the average CEO tenure (7 to 8 years) and turnover frequency (10 to 11%)
for Russian corporations over the past few years have been almost the same
as those for American and Japanese companies. In terms of the frequency
of outside CEO succession (40 to 50%), Russian firms have kept their level
10 to 20% higher than the average for corporations in developed coun-
tries (Weisbach 1988; Martin & McConnell 1991; Kang & Shivdasani 1995;
Muravyev 2001; Rachinsky 2002; Muravyev 2003a; Abe & Oguro 2004;
Yasin 2004). Therefore, the increasing upward trend of CEO turnover fre-
quency shown in Figure 5.1 can be attributed to the accelerated develop-
ment of flexibility of CEO appointment against the background of declining
insider control and the aging of Soviet-generation managers (so-called “red
executives”).
Empirical studies that scrutinize the linkage between CEO turnover and
corporate restructuring in Russia are listed in Table 5.1. All studies, except
0.0
10.0
20.0
30.0
40.0
50.0
60.0
70.0
Just after
mass privatization
1995 19961994 1997 1998 1999 2001 20022000
(%)
Insiders (incumbent managers and workers)
Outside shareholders (without state shareholding)
The State
Figure 5.2 Changes in average ownership share by insiders, outside shareholders,
and the state in industrial firms, 1994–2002
Source: Authors’ illustration. The ownership share of each category of shareholders was calcu-
lated on the basis of survey results reported in 25 different papers investigating the ownership
structure of industrial firms for various periods. For more details, see Iwasaki (2007b).
9780230_217287_07_cha05. dd 125 5/14/2009 3:47:54 PM
126 Organization and Development of Russian Business
that by Linz (1996), highlight the critical effects of ownership structure on
managerial renewal. They share the following four common perceptions.
First, outside ownership is positively and highly statistically correlated with
CEO turnover frequency. Second, in contrast, insider shareholding signifi-
cantly hampers CEO changes, as 40 to 50% of enterprises with dominant
ownership by managers and worker collectives have a holdover CEO from
the Soviet days, a much higher proportion than that in other types of cor-
porations (15 to 20%). Third, substantial changes in ownership structure
resulting from the replacement of the largest or dominant shareholders are
highly likely to cause CEO turnover. Fourth, the higher the investment share
of a top shareholder and the ownership concentration rate are, the more
Table 5.1 Studies of managerial turnover in Russian firms
Paper Analysis
period
Tested
interrelations
a
Empirical
method
b
Barberis et al. (1996) 1992–1993 II RA (OLS, 2SLS)*
Frydman et al. (1996) 1994 I RA (LOG)
Klepach et al. (1996) 1995 II DS
Linz (1996) 1992–1995 I RA (PRO)
Filatotchev et al. (1999a) 1992–1996 I DS
Filatotchev et al. (1999b) 1995–1998 III DS, RA (LOG)
Basargin & Perevalov (2000) 1994–1999 I RA (PRO)
Goltsman (2000) 1999 I RA (PRO, TOB)
Bevan et al. (2001) 2000 I DS
Kapelyushnikov (2001) 2001 I DS
Muravyev (2001, 2003a) 1999–2000 I DS, RA (PRO)
Rachinsky (2001) 1997–2000 II RA (OLS)
Rachinsky (2002) 1997–2001 I DS, CS
Dolgopyatova (2003) 2001 I DS
Peng et al. (2003) 1995 II RA (PRO)
Wright et al. (2003) 1997 I DS
Dolgopyatova (2004) 2003 I DS
Dolgopyatova & Kuznetsov (2004) 2001 III DS
Krueger (2004) 1994–1997,
1999
II RA (OLS)
Yasin (2004) 2003 III DS, PS
Kapelyushnikov & Demina (2005) 1995–2003 I DS, RA (PRO)
Notes:
a
Each code represents the following: I: Ownership structure and/or corporate performance have
an impact on managerial turnover; II: Managerial turnover has an impact on corporate perform-
ance and/or restructuring; III: I+II.
b
Each code represents the following: CS: Case study; DS: Descriptive statistical analysis (t-test of
differences in means, ANOVA, etc.); RA: Regression analysis (OLS: Ordinary least squares; 2SLS:
Two-stage least squares; PRO: Probit; LOG: Logit; TOB: Tobit; *: Analysis dealing with selection
bias for privatized enterprises); PS: Point systems for individual survey items.
Source: Compiled by the authors.
9780230_217287_07_cha05. dd 126 5/14/2009 3:47:54 PM
Corporate Governance and Managerial Turnover 127
frequently CEO turnover occurs.
6
Moreover, there are two other noteworthy
points. The first is that the government does not necessarily speak for the
current management, considering that state ownership increases CEO turn-
over as well (Kapelyushnikov 2001; Muravyev 2001, 2003a), and the second
is that the frequency of insider CEO succession is positively correlated with
shareholding by insiders and the federal government, while the presence of
outside investors and local governments enhances the possibility of outsider
succession (Muravyev 2003b; Kapelyushnikov & Demina 2005).
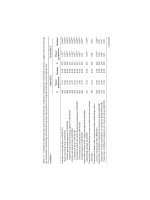
Table 5.2 shows the results from vote-counting analysis of the impact
of different types of owners and changes in ownership structure on CEO
turnover based on the 12 estimation results available in the papers listed
in Table 5.1.
7
Here, multiple estimation results were taken from one study
only when regression modeling, analysis period, and other conditions were
substantially different from others in that study. In cases in which more
than one estimation result was available from one study regarding the same
subject, the most appropriate was selected by judging the coefficient of
determination (R
2
) and selection of control variables and by considering the
simultaneous equation bias, among other factors.
This table confirms the reversed relationship between insiders and out-
siders regarding the direction of their impact on CEO turnover. Except for
state ownership, all types of outside owners had a positive impact on mana-
gerial turnover if they are estimated statistically significant at the 5% level
or less. Domestic individual shareholders and financial institutions enjoy a
relatively high probability to affect the renewal of company top officers in
comparison with domestic nonfinancial corporate shareholders and foreign
investors. Changes in ownership structure also exert positive effects on CEO
turnover.
Regarding the interrelation between managerial turnover and corpo-
rate performance, eight studies shown in Table 5.1 examine the effects of
the renewal of top-notch managers on ex-post corporate performance and
restructuring activities. Four of them evaluate the refreshment of manage-
ment as positive (Barberis et al. 1996; Klepach et al. 1996; Filatotchev et al.
1999b; Krueger 2004), and the other four have a neutral or negative view of
its influence (Rachinsky 2001; Peng et al. 2003; Dolgopyatova & Kuznetsov
2004; Yasin 2004), leaving room for further discussion.
A more debatable aspect in this regard is the reverse angle of the relation-
ship between these two elements, that is, the role of corporate performance
as a trigger of CEO turnover. The majority of researchers do not provide
clear evidence that corporate performance affects the frequency of mana-
gerial turnover. Many papers have suggested an extremely limited corre-
lation between these two factors (Kapelyushnikov 2001; Dolgopyatova &
Kuznetsov 2004) or denied a significant correspondence (Goltsman 2000;
Yasin 2004). An exhaustive event study by Rachinsky (2002) covering 110
listed corporations also supports these mainstream views. According to his
9780230_217287_07_cha05. dd 127 5/14/2009 3:47:55 PM
Table 5.2 Results from vote-counting analysis of the impact of different types of owners and changes in ownership structure on CEO
turnover
Type of owner
Number of samples Composition (%)
Significantly
negative
Not
significant
Significantly
positive
Total Significantly
negative
Not
significant
Significantly
positive
Total
Insiders 2 1 0 3 66.7 33.3 0.0 100.0
Workers 3 1 0 4 75.0 25.0 0.0 100.0
Outsiders 0 2 2 4 0.0 50.0 50.0 100.0
Domestic individuals 0 1 2 3 0.0 33.3 66.7 100.0
Domestic corporations 0 5 2 7 0.0 71.4 28.6 100.0
Financial institutions 0 2 3 5 0.0 40.0 60.0 100.0
Foreign investors 0 2 1 3 0.0 66.7 33.3 100.0
State 2 2 2 6 33.3 33.3 33.3 100.0
Changes in ownership
structure 0 0 2 2 0.0 0.0 100.0 100.0
Note: The significance level for the verification was set to the 5% level.
Source: Compiled by the authors on the basis of previous studies listed in Table 5.1.
9780230_217287_07_cha05. dd 128 5/14/2009 3:47:55 PM
Corporate Governance and Managerial Turnover 129
study, only 19.5% of all 113 CEOs who left their post from 1997 to 2001
resigned to take responsibility for the worsening of their business results.
8
This percentage is much lower than that of CEOs who stepped down for
nonmanagerial reasons, such as career changes, age-limit retirements, inter-
nal reassignments resulting from organizational changes, and nonmana-
gerial problems (51.3% in total) and even lower than that of those who
resigned for other reasons, such as managerial intervention by local govern-
ments, social conflicts including labor disputes, legal procedures concern-
ing corporate rehabilitation, takeover, and others (24.8% in total). Judging
from the above findings, Rachinsky (2002) reports that it is difficult, even in
the listed companies, to drive out top management on the grounds of poor
performance, and, consequently, CEO changes are not sensitive to corporate
performance in Russia.
In contrast, the remaining two studies, by Muravyev (2003a) and
Kapelyushnikov & Demina (2005), demonstrate that poor corporate per-
formance is positively related to managerial turnover. Using data obtained
in the survey of 437 Russian enterprises, Muravyev (2003a) regressed CEO
turnover in the period from January 1999 to May 2000 on industry-adjusted
labor productivity and other control variables, including ownership struc-
ture, board composition, and company size, and he found a statistically
robust relationship between past performance and turnover frequency. He
concludes with the following statement: “The fact that bad managers (either
incompetent or opportunistic) are punished implies that the widely held
assumption about virtual nonexistence of corporate governance in Russia
is not valid” (p. 168).
The study by Kapelyushnikov & Demina (2005) is the most recent one on
managerial turnover in Russia. Using the results of a longitudinal question-
naire survey of industrial firms
9
carried out in 1997–2003, they performed a
probit estimation of the CEO-turnover model and confirmed that, on aver-
age, the possibility of CEO replacement in loss-making firms is 8.5% higher
than that in profitable corporations. Moreover, Kapelyushnikov & Demina
(2005) also examined the impact of corporate performance on new CEO
appointment and substantiated that the appointment of incumbent workers
to top management is less probable in underperformed enterprises than in
profitable ones. Indeed, according to their regression results, the possibil-
ity of succession by insiders to company presidents in loss-making firms is
68.8% lower on average than in well-performing firms. Because their data-
set consists of many unlisted firms and ex-state-owned privatized firms,
their empirical evidence may suggest that the positive link between poor
performance and CEO renewal becomes usual governance practice in daily
management life in contemporary Russia.
Although their empirical analysis clearly indicates that bad corporate per-
formance enhances CEO turnover in Russian firms, Muravyev (2003a) and
Kapelyushnikov & Demina (2005) are still in the minority. In the following
9780230_217287_07_cha05. dd 129 5/14/2009 3:47:55 PM
130 Organization and Development of Russian Business
sections, we will show additional evidence supporting the empirical rela-
tionship between corporate performance and managerial turnover, relying
on a complete new dataset of Russian corporations.
Hypothesis and empirical methodology
As we discussed in the previous section, most prior studies on Russian com-
panies do not find a significant impact of company performance on CEO
turnover. We can think of various reasons for the absence of a statistically
significant relationship between these two factors in Russia. It is possible
that previous literature simply did not have a sufficient number of observa-
tions of turnover events. Another possibility is that top managers in Russia
do not play the same role in other countries, such as the United States. In
the US, the CEO is the bridge between the board of directors and man-
agement team and is solely responsible for management outcomes in gen-
eral. In other words, American CEOs are very powerful and accountable.
In contrast, in other developed countries, such as Japan, CEOs or company
presidents are not as powerful and accountable as their American counter-
parts. Rather, they are regarded as a key member of the management team
in their company. In such a case, when company performance is poor, it
does not have to be the CEO alone who should accept full responsibility;
other management members are to share in the responsibility (Abe & Jung
2004). Furthermore, in such countries, it is highly likely that the manage-
ment team in a company will take collective responsibility and resign as a
group when the company performs extremely badly or when there is a great
scandal about its corporate affairs.
With regard to Russia, management researchers argue that, because of the
national culture of social collectivism, the 70-year-long history of the risk-
averse way of life in the Soviet period, and the Continental European nature
of corporate law, the management system in Russian corporations, especially
in the former socialist enterprises, leans toward team leadership and the col-
lective decision-making practice on everyday management (Holt et al. 1994;
Puffer & McCarthy 1995; Ralston et al. 1997; Elenkov 1997, 1998). Indeed,
Russian company presidents do not generally stand aloof from other exec-
utives, and they do not have sole responsibility for all company matters,
including poor performance. In other words, Russian managers often share
the fruits of collective achievement in corporate management, and, at the
same time, they jointly sustain damage from any failure as a team member.
Consequently, it is conceivable that not only the top corporate managers
but also other high-ranking executives leave their company in response to
bad corporate performance caused mainly by their mistakes. It is also pos-
sible that the entire management team in a Russian company may resign
together due to an irrecoverable loss in its shareholder wealth or company
reputation.
9780230_217287_07_cha05. dd 130 5/14/2009 3:47:56 PM
Corporate Governance and Managerial Turnover 131
Furthermore, it may be optimal for outside shareholders, who have a cer-
tain insight into management style in a company they own, to call for the
resignation not of its company president but of one or more senior man-
agers, depending on the cause and seriousness of the company problems.
Such a decision can be justified when outside shareholders expect that the
top-manager dismissal may not bring enough positive effects on the ex-post
management of that company to offset the loss of the top manager’s firm-
specific knowledge and experience. This is particularly true of dominant
shareholders, mainly Russian oligarchs and business groups, who have a
strong incentive to monitor the management because they have a large
share in ownership and can easily obtain definite and reliable information
on top-management activities in their companies. In Russia, foreign inves-
tors are also regarded as active shareholders. However, due to the cautious
attitude of Russian managers toward the possibility of hostile takeovers,
the non investor-friendly disclosure system of Russian companies, and the
incompleteness and low enforceability of the FDI-related laws, many diffi-
culties attend the attempt of foreign shareholders to obtain access to insider
information of their invested companies if they do not control their own
firms.
If the above were more accurate concerning company management life
in contemporary Russia, we should examine the impact of corporate per-
formance not on CEO turnover alone but also on managerial turnover in a
company as a whole. In addition, with regard to the influence of ownership
structure on managerial turnover, we should pay attention to the deep gap
between domestic shareholders and foreign investors in terms of accessibil-
ity to insider information on management in their own companies.
Relying on these presumptions, we attempt to investigate turnover events
of not only top managers but also other high-ranking corporate officers
who are in charge of finance, accounting, strategic planning, marketing, or
sales management. There are four possible events to examine. They are the
turnover of both CEO and senior managers (Type I), the turnover of only
the CEO (Type II), the turnover of only senior managers (Type III), and no
turnover (Type IV). This means that we now have four mutually exclusive
outcomes. Taking informational asymmetry between Russian large share-
holders and foreign investors into consideration, we adapt the next testable
hypotheses:
Hypothesis H1: When a company’s performance is poor, the company tends
to experience Type I or Type III turnover if the company has a dominant share-
holder.
Hypothesis H2: When a company’s performance is poor, the company
tends to experience Type I or Type II turnover if the share is owned by foreign
investors.
9780230_217287_07_cha05. dd 131 5/14/2009 3:47:56 PM
132 Organization and Development of Russian Business
The rationale for the above hypotheses is that dominant shareholders
with sufficient information on top management are so capable of speci-
fying the cause and responsibility of bad performance in their companies
that they incline to dismiss only responsible person(s). In contrast, foreign
owners are prone to demand the removal of the top managers or the whole
management team in reaction to their bad financial performance because
foreign shareholders are more ineffective in pinpointing company problems
than dominant shareholders because higher information asymmetry results
in higher monitoring costs.
Let the value to the ith company of choosing turnover type j (j = 1, ,4)
be y
ij
* and assume that y
ij
* depends on company performance (Performance),
corporate governance-related variables, such as ownership structure (CG),
and other variables, including firm size, legal form of incorporation, indus-
trial dummies (X), and an error term H
ij
:
*
123
jj j j
y
a b Performance b CG b X e
ij i i i ij
. (1)
Usi
ng Type IV (no turnover) as the base case, we adopt the multinomial
probit (MNP) model to estimate the relationship between company per-
formance and the type of turnover.
10
The probability of observing Type j turnover, y
ij
= 1, is:
**
Pr[ 1] Pr[ , | , ,
]
Py yykjPerformanceCGX
i
j
i
j
i
j
iii
ik
!z
.
11
(2)
If there are only two outcomes, such as no turnover and CEO turnover, (2)
can be written as a standard probit or logit model.
Data description
To perform regression analysis based on the abovementioned methodology,
we employ detailed micro data of Russian nonfinancial joint-stock compa-
nies with more than 100 employees. The data are derived from the joint-
enterprise survey conducted in 2005 by Hitotsubashi University and State
University Higher School of Economics. See Appendix of this volume for
more details on the dataset.
Of 822 observations, we dropped workers’ joint-stock companies (people’s
enterprises) due to the specific nature of their internal control system stipu-
lated by a special law on these legal entities.
12
We also dropped companies
that refused to answer at least one of the questions regarding managerial
turnover, relationship between shareholders and managers, and company
performance, which gave us 602 observations.
Our survey contains many items on turnover of not only CEO or board
members but also of senior managers. One of the drawbacks of the survey
is its weakness in accounting information. Most surveyed companies are
9780230_217287_07_cha05. dd 132 5/14/2009 3:47:56 PM
Corporate Governance and Managerial Turnover 133
not listed. Although we asked questions on company performance, such as
profit, dividends, and sales growth, such variables most likely contain many
measurement errors. In the following empirical analyses, it is important to
take the characteristics of the data into account.
13
The variables we use in our empirical model (2) are as follows:
y: The CEO-turnover dummy takes unity if the CEO left the company
between 2001 and 2004 on the initiative of shareholders; otherwise, the
dummy takes zero. The turnover dummy of senior managers takes a value of
1 if the company reports that many managers who are in charge of finance,
accounting, planning, marketing, and sales left the company between 2001
and 2004. The turnover index is created from these two dummy variables,
which gives us four mutually exclusive outcomes.
Performance: We use two different indices as independent variables represent-
ing corporate performance. First, we use a dividend payment dummy (DIVPAY),
which takes unity when dividends on common stock were paid between 2001
and 2004 and zero otherwise; second, we use a sales growth index (SALGRO),
which captures the relative sales growth to the industrial median from 2000
to 2004. The original variable is an index (1 for doubled or more sales growth
during the period, 2 for 1.5 times less than doubled, 3 for less than 1.5 times,
4 for not changed, and 5 for declined). We take the industrial medians of the
variable and subtract the company level variable.
CG: As independent variables of the governance mechanism, we adapt
two ownership variables taking into account the findings of prior studies on
managerial turnover in Russia, as reported in the second section. They con-
sist of: first, an index for ownership share by foreign investors (OWNFOR)
that takes 0 for zero, 1 for 10% or less, 2 for 10.1–25%, 3 for 25.1–50%, 4 for
50.1–75%, and 5 for more than 75%; and second, a dummy for the existence
of dominant shareholders (DOMSHA). The dominant shareholder is defined
as the shareholder who owns more than 50% of common stock and has a
controlling interest.
14
X: Furthermore, we introduce the next three variables to control other
firm specificity. Namely, (a) Natural logarithms of the number of employ-
ment as a proxy of company size (COMSIZ), (b) Open joint-stock company
dummy (OPECOM),
15
and (c) Industry dummies for nine classifications.
Table 5.3 contains the descriptive statistics for all 602 observations and
those for each turnover type. Among 602 companies, 68 firms (11.3%)
report that they experienced turnover of both CEO and managers (Type I).
Combining Types I and II, about 27% of the companies went through CEO
turnover initiated by shareholders. SALGRO is positive for the no-turnover
case (Type IV) but positive for all other cases, which suggests that companies
that experienced any type of turnovers grew more slowly than other com-
panies. The mean of DIVPAY is 0.45 for Type IV and 0.28 for the turnover of
only the CEO (Type II), which suggests companies whose CEO had recently
9780230_217287_07_cha05. dd 133 5/14/2009 3:47:56 PM
Table 5.3 Descriptive statistics of independent variables by company group in terms of turnover type
Observations COMSIZ
a
OWNFOR
b
DOMSHA
c
OPECOM
d
SALGRO
e
DIVPAY
f
Number (%) Mean (S.D) Mean (S.D) Mean (S.D) Mean (S.D) Mean (S.D) Mean (S.D)
All firms 602 (100.0) 6.464 (1.251) 0.364 0.728 (0.446) 0.688 (0.464) 0.029 (1.249) 0.392 (0.489)
Firms with turnover
of CEO and senior
managers (Type I)
68 (11.3) 6.802 (1.506) 0.618 0.912 (0.286) 0.794 (0.407) 0.132 (1.234) 0.426 (0.498)
Firms with CEO
turnover only (Type II)
75 (12.5) 6.614 (1.308) 0.693 0.760 (0.430) 0.667 (0.475) 0.051 (1.406) 0.280 (0.452)
Firms with turnover
of senior managers
only (Type III)
107 (17.8) 6.393 (1.203) 0.336 0.738 (0.442) 0.729 (0.447) 0.149 (1.220) 0.318 (0.468)
Firms with no
turnover (Type IV)
352 (58.5) 6.389 (1.190) 0.253 0.682 (0.466) 0.659 (0.475) 0.032 (1.226) 0.432 (0.496)
Notes:
a
Company size measured by the total number of employees.
b
Ownership share of foreign investors rated on the following 6-point scale: 0: 0%; 1: 10.0% or less; 2: 10.1 to 25.0%; 3: 25.1 to 50.0%; 4: 50.1 to 75.0%;
5: 75.1 to100.0%.
c
A dichotomous variable with a value of 1 if the company has a dominant shareholder.
d
A dichotomous variable with a value of 1 if the company is operated as an open joint-stock company.
e
Changes in gross sales during 2000 to 2004. The original variable is an index (1 for doubled or more sales growth during the period, 2 for 1.5 times
less than doubled, 3 for less than 1.5 times, 4 for not changed and 5 for declined). We take the industrial median of the variable, and then subtract the
company level variable from the industrial median.
f
Frequency of dividend payments during 2001 and 2003.
Source: Authors’ calculation.
9780230_217287_07_cha05. dd 134 5/14/2009 3:47:56 PM
Corporate Governance and Managerial Turnover 135
resigned did not pay dividends. There tended to be more open joint-stock
companies that experienced a Type I turnover. Companies with more for-
eign shareholders went through more Type I and Type II turnovers than
other types of turnover. The most noticeable point of Table 5.3 is probably
the role of dominant shareholders in turnover. More than 90% of compa-
nies whose CEO and mangers resigned had a dominant shareholder, while
less than 70% of the companies that did not experience any managerial
turnover had a dominant shareholder. On the whole, the information in
Table 5.3 suggests that a company that has a dominant shareholder, low
sales growth, and more ownership share by foreigners experienced a Type
I turnover. A company without dividend payments went through a Type II
turnover. Overall, these findings seem to be consistent with the hypothesis
discussed in the previous section.
Empirical results
In this section, to evaluate the impacts of corporate performance and gov-
ernance mechanism on managerial turnover, we conduct regression analy-
sis in a multivariate setting. Our analysis begins with an examination of the
determinants of CEO turnover by the logit model, taking the CEO-turnover
dummy as a dependent variable. Next, we perform the multinomial probit
estimation of managerial turnover using the four mutually exclusive turno-
ver indices capturing the magnitude of managerial removal in a company
as a whole.
Table 5.4 contains the standard logit estimates. Model [L1] in Table 5.4
uses the full sample consisting of 602 companies. In addition, in order to
validate the robustness of the estimation results, a supplementary estimation
is performed using the following three cases. In other words, we estimate the
model [L2] using the full sample excluding all firms with no dividend pay-
ment. Model [L3] uses the sample with a negative relative sales growth index,
and Model [L4] is estimated on the basis of the sample with no dividend
payments and negative relative sales growth. The marginal effects of each
independent variable are reported in the next column to the coefficients.
16
The results of Models [L1] and [L4] show that company performance, rep-
resented by DIVPAY and SALGRO, do not have significant effects on CEO
turnover. We can observe several positive significant effects of foreign own-
ership (OWNFOR) and the presence of a dominant shareholder (DOMSHA)
on the dismissal of a CEO initiated by shareholders. The results of Models
[L2] and [L3] suggest that a company with poor performance tends to expe-
rience CEO removal more often if their ownership share by foreign investors
is high or if there exists a dominant shareholder. A serious problem in this
specification is the statistically weak effects of performance on CEO turno-
ver in the full sample estimation of Model [L1]. Largely, our logit estimates
in Table 5.4 confirm the main findings of preceding studies, which suggest
9780230_217287_07_cha05. dd 135 5/14/2009 3:47:57 PM
Table 5.4 Logit regression analysis of the impacts of corporate governance and performance on CEO turnover
Model
a
[L1] [L2] [L3] [L4]
Coef. dF/dx Coef. dF/dx Coef. dF/dx Coef. dF/dx
COMSIZ 0.1635 0.0278 0.1364 0.0247 0.0788 0.0127 Ϫ0.0544 Ϫ0.0089
(1.86) (1.88) (1.12) (1.12) (0.48) (0.48) (Ϫ0.22) (Ϫ0.22)
OWNFOR 0.2594** 0.0442** 0.2621* 0.0475* 0.2284 0.0369 0.2004 0.0327
(2.95) (3.03) (2.42) (2.49) (1.26) (1.27) (0.91) (0.92)
DOMSHA 0.7696** 0.1200*** 0.3338 0.0582 0.5756 0.0877 0.183 0.0294
(3.05) (3.41) (1.11) (1.15) (1.47) (1.57) (0.38) (0.38)
OPECOM 0.1221 0.0206 Ϫ0.0222 Ϫ0.0040 0.4026 0.1409* 0.9402 0.1443
(0.52) (0.53) (Ϫ0.08) (Ϫ0.08) (2.20) (2.48) (1.75) (1.92)
SALGRO 0.0033 0.0006 0.029 0.0053
(0.04) (0.04) (0.30) (0.30)
DIVPAY Ϫ0.3933 Ϫ0.0665 Ϫ0.0789 Ϫ0.0127
(Ϫ1.79) (Ϫ1.84) (Ϫ0.22) (0.22)
Constant Ϫ2.7456*** Ϫ2.3804* Ϫ2.5268** Ϫ2.0095
(Ϫ3.79) (Ϫ2.35) (Ϫ2.75) (Ϫ1.62)
Industry
dummies
Yes Yes Yes Yes
N 602 366 237 136
Log likelihood Ϫ312.4620 Ϫ199.5589 Ϫ117.7487 Ϫ68.1209
Notes:
a
Model [L1] is estimated using a full sample; Model [L2], firms without dividend payment; Model [L3], firms with lower sales growth than the industrial
average; Model [L4], firms without dividend payment and with lower sales growth than the industrial average.
dF/dx denotes the marginal effects of independent variables.
t-values are in parentheses. *, **, and *** denote the 5%, 1%, and 0.1% significance, respectively.
Source: Authors’ estimation.
9780230_217287_07_cha05. dd 136 5/14/2009 3:47:57 PM
Corporate Governance and Managerial Turnover 137
a weak correlation between corporate performance on CEO turnover and a
significant impact of ownership structure on top-management removal.
Next, we look into the joint turnover of company presidents and senior
managers in our samples. Table 5.5 contains the regression results by the
multinomial probit maximum likelihood. The base category for our MNP
estimation is firms with no-turnover events (Type IV). Models [M1] to [M4]
use the same sample criteria and control variables as Models [L1] to [L4],
respectively. This time, we can confirm the negative significant impacts of
performance on CEO turnover (Type II). That is to say, DIVPAY has nega-
tive significant effects on CEO dismissal under all specifications. Although
SALGRO does not have statistically significant impacts on CEO removal, the
sign is positive under most specifications, which suggests that poor com-
pany performance in terms of sale growth reduces the probability of the
turnover of top managers. The MNP estimation results contrast with previ-
ous literature and our logit regressions reported in Table 5.4.
We believe that the difference is due to two reasons. The first is the
fact the multinomial probit model is statistically more powerful than the
standard logit model. It is noteworthy that, although the DIVPAY dummy
variable in Table 5.4 is insignificant, the sign is negative. Utilizing infor-
mation of various turnovers simultaneously, we can increase the statistical
powers to reject the null hypothesis. The second reason is the importance
of the distinction between the turnover of CEOs and other high-ranking
managers. As we discussed in the third section, when company perform-
ance is poor, it is not always the CEO who is responsible. It is likely that
other senior manager(s) may resign instead of the company president,
especially if companies are running under a collective management sys-
tem. Although it is almost impossible to identify who should take the
responsibility from the data, by controlling for ownership structure and
other company characteristics, we believe that we can obtain information
on how companies react differently to the occurrence of bad company
performance.
Another noteworthy result in Table 5.5 is that shareholding by foreign
investors (OWNFOR) has positive and significant effects on the turnover
of the CEO alone (Type II), although the effects on other turnovers are not
significant. The effects of the dominant shareholder dummy (DOMSHA)
are significant in the Type I turnover, that is, the turnover of both the
CEO and senior managers, but not significant in the turnover of the CEO
alone. As for Type II turnover, i.e., the turnover of CEO only, and Type III
turnover, i.e., the turnover of senior managers only, DOMSHA is generally
insignificant, while OPECOM dummy is generally positive and significant.
We interpret this result as follows. It is very difficult for foreign owners to
monitor the activities of the CEO and other company managers in Russian
firms for several reasons, including weak disclosure requirements and
management hostility to foreigners. Therefore, when the outcome from
9780230_217287_07_cha05. dd 137 5/14/2009 3:47:57 PM
Table 5.5 Multinomial probit regression analysis of the impacts of corporate governance and performance on managerial turnover
taking its magnitude into consideration
Model
a
[M1] [M2] [M3] [M4]
Coef. dF/dx Coef. dF/dx Coef. dF/dx Coef. dF/dx
Firms with turnover of CEO and
senior managers (Type I)
COMSIZ 0.1338 0.0145 0.1577 0.0032 Ϫ0.0882 Ϫ0.0032 Ϫ0.2831 Ϫ0.0236
(1.57) (1.35) (1.29) (1.07) (Ϫ0.53) (Ϫ0.45) (Ϫ1.16) (Ϫ0.95)
OWNFOR 0.2021* 0.0195 0.1399 0.0018 0.1915 0.0109 0.0509 0.0157
(2.26) (1.78) (1.12) (0.59) (1.07) (1.38) (0.25) (0.72)
DOMSHA 1.0467*** 0.1038*** 0.5959 0.0096 0.9293* 0.0315* 0.3676 0.0348
(3.85) (4.71) (1.87) (1.65) (2.05) (2.45) (0.73) (0.80)
OPECOM 0.3457 0.0381 0.2900 0.0053 0.9409* 0.0254 0.9054 0.0641
(1.47) (1.42) (0.99) (0.82) (2.19) (1.82) (1.79) (1.57)
SALGRO 0.0501 0.0039 0.0796 0.0014
(0.64) (0.39) (0.82) (0.60)
DIVPAY Ϫ0.1524 0.0061 0.1743 0.0143
(Ϫ0.73) (0.23) (0.49) (0.86)
Constant Ϫ3.0772*** Ϫ3.4906** Ϫ1.9006 Ϫ0.6846
(Ϫ4.23) (Ϫ3.20) (Ϫ1.43) (Ϫ0.44)
Firms with CEO turnover
only (Type II)
COMSIZ 0.125 0.0157 0.0878 0.0114 0.1379 0.0097 Ϫ0.1360 Ϫ0.0110
(1.50) (1.29) (0.75) (0.56) (0.90) (1.19) (Ϫ0.69) (Ϫ0.33)
OWNFOR 0.2135* 0.0255* 0.2472* 0.0421* 0.0598 0.0060 Ϫ0.0199 0.0127
(2.56) (2.18) (2.51) (2.50) (0.34) (0.63) (Ϫ0.10) (0.36)
DOMSHA 0.3058 0.0169 0.2128 0.0115 0.1698 0.0052 0.0453 Ϫ0.0011
(1.44) (0.58) (0.80) (0.25) (1.51) (0.31) (0.11) (Ϫ0.02)
OPECOM Ϫ0.0121 Ϫ0.019 Ϫ0.0403 Ϫ0.0290 0.7861* 0.0258 0.6447 0.0701
(Ϫ0.06) (Ϫ0.59) (Ϫ0.16) (Ϫ0.63) (2.05) (1.57) (1.59) (1.18)
SALGRO 0.0052 Ϫ0.0038 0.0174 0.0020
(0.07) (Ϫ0.35) (0.20) (Ϫ0.12)
9780230_217287_07_cha05. dd 138 5/14/2009 3:47:57 PM
DIVPAY Ϫ0.6183** Ϫ0.0758** Ϫ0.4496 Ϫ0.0196
(Ϫ2.95) (Ϫ2.73) (Ϫ1.30) (Ϫ1.25)
Constant Ϫ1.8564** Ϫ1.8015 Ϫ2.7905* Ϫ0.7308
(Ϫ2.79) (Ϫ1.96) (Ϫ2.25) (Ϫ0.59)
Firms with turnover of senior
managers only (Type III)
COMSIZ 0.0217 Ϫ0.0049 0.0731 0.0102 Ϫ0.0975 Ϫ0.0211 Ϫ0.1564 Ϫ0.019
(0.27) (Ϫ0.32) (0.66) (0.44) (Ϫ0.67) (Ϫ0.74) (Ϫ0.80) (Ϫ0.50)
OWNFOR 0.0873 0.0028 0.0678 Ϫ0.0003 Ϫ0.2025 Ϫ0.0488 Ϫ0.3806 Ϫ0.0784
(0.98) (0.17) (0.63) (Ϫ0.01) (Ϫ0.88) (Ϫ0.98) (Ϫ0.95) (Ϫ1.00)
DOMSHA 0.2471 0.010 0.4635 0.0833 0.0985 0.0082 0.0374 Ϫ0.0032
(1.28) (0.28) (1.79) (1.72) (0.32) (0.14) (0.10) (Ϫ0.04)
OPECOM 0.2267 0.0351 0.3388 0.0742 0.7977* 0.1289* 0.5033 0.0516
(1.15) (0.99) (1.39) (1.56) (2.24) (2.22) (1.35) (0.79)
SALGRO 0.0864 0.0158 0.080 0.01625
(1.27) (1.23) (0.97) (0.95)
DIVPAY Ϫ0.3824* Ϫ0.0488 Ϫ0.3551 Ϫ0.0666
(Ϫ2.05) (Ϫ1.45) (Ϫ1.11) (Ϫ1.11)
Constant Ϫ0.9618 Ϫ2.3899* Ϫ0.0764 Ϫ0.2816
(Ϫ1.52) (Ϫ2.56) (Ϫ0.07) (Ϫ0.23)
Industry dummies Yes Yes Yes No
b
N 602 366 237 141
Log likelihood Ϫ640.8457 Ϫ403.6555 Ϫ234.7226 Ϫ150.0274
Notes:
a
Model [M1] is estimated using a full sample; Model [M2], firms without dividend payment; Model [M3], firms with lower sales growth than the indus-
trial average; Model [M4], firms without dividend payment and with lower sales growth than the industrial average.
b
Industrial dummies are not included because the marginal effects are not estimated clearly probably due to the small number of Type I turnovers (11
out of 140)
dF/dx denotes the marginal effects of independent variables.
tϪvalues are in parentheses. *, **, and *** denote the 5%, 1%, and 0.1% significance, respectively.
Source: Authors’ estimation. The base category for estimation is firms with no turnover (Type IV).
9780230_217287_07_cha05. dd 139 5/14/2009 3:47:58 PM
140 Organization and Development of Russian Business
company management is poor, foreign investors are unable to identify its
main cause. In such a case, the foreign shareholders may simply call for the
CEO to take the responsibility following practices in place in the United
States and Western Europe.
On the other hand, if the dominant shareholder, who is in many cases
either a rich Russian private investor or a nonfinancial corporate share-
holder including holding companies and other business groups, exists in a
company, such a shareholder has a strong incentive to monitor the activities
of its company managers. With intensive monitoring, it might be possible
for him or her to identify who is really responsible for the poor outcome.
Hence, the dominant shareholders with deep insight into management
activities in the companies they fund may exert pressure on an individual
manager to resign for his/her bad performance, possibly through unofficial
contact with the management. It is also possible for them to call on the
whole management team to leave their companies, when, for instance, bad
corporate performance has its roots in the ineffective coordination of col-
lective decision-making on strategic management matters or in very poor
opportunistic behavior as a team. Comparing the marginal effects of Model
[M3] with those of [M1], the former coefficient of DOMSHA is greater than
that of the latter. Recall that Model [M3] uses the observations with lower
sales growth. In other words, the dominant shareholders increase the turn-
over of both CEO and senior managers when the company performance
measured by sales growth is poor. This is consistent with the view that the
dominant shareholder plays a disciplinary role in Russian companies.
Turnover of a CEO or senior managers could take place when internal
conflict occurs between outside shareholders and management. In Russia,
company infighting is not an extraordinary case, rather an everyday inci-
dent. In fact, 206 or 25.1% of 822 surveyed firms responded that they expe-
rienced a harsh internal conflict(s) at least once from 2001 to 2004.
17
Apparently, an internal conflict is not a random event. Poor company per-
formance or ownership structure and other company characteristics could
trigger the conflict. It is possible that the statistical relationship between turn-
over and other variables is spurious and the conflict could explain the turno-
ver. To evaluate this possibility, we performed additional multinomial probit
regressions by including an internal conflict dummy (INTCON), in which
the value of 1 is assigned to companies that experienced infighting between
managers and shareholders in 2001–2004, as independent variables.
The results are shown in Table 5.6.
18
First of all, we observe that the log
likelihood of Model [M5] is Ϫ620.49 in Table 5.6, which is much larger
than that of Model [M1] (Ϫ640.85) in Table 5.5. This implies that inter-
nal conflict itself has a large explanatory power for our turnover model.
Second, although it is not always statistically significant, INTCON has pos-
itive significant effects on various turnovers. Third, there are no remark-
able differences in the estimated coefficients of other variables, such as
9780230_217287_07_cha05. dd 140 5/14/2009 3:47:58 PM
Table 5.6 Multinomial probit regression analysis of the impacts of corporate governance, corporate performance, and internal con-
flict on managerial turnover taking its magnitude into consideration
Model
a
[M5] [M6] [M7] [M8]
Coef. dF/dx Coef. dF/dx Coef. dF/dx Coef. dF/dx
Firms with turnover of CEO and senior
managers (Type I)
COMSIZ 0.1214 0.0143 0.1344 0.0037 Ϫ0.1418 Ϫ0.0036 Ϫ0.2901 Ϫ0.0242
(1.41) (1.31) (1.10) (0.99) (Ϫ0.82) (Ϫ0.64) (Ϫ1.18) (Ϫ0.97)
OWNFOR 0.1938* 0.019 0.1252 0.0021 0.2067 0.0088 0.0489 0.0161
(2.15) (1.70) (0.99) (0.55) (1.14) (1.43) (0.24) (0.72)
DOMSHA 1.0019*** 0.1020*** 0.5356 0.0116 0.9742* 0.0243* 0.3851 0.0379
(3.65) (4.48) (1.66) (1.53) (2.09) (2.45) (0.75) (0.87)
OPECOM 0.3204 0.0367 0.2890 0.0065 0.9558* 0.0195 0.8878 0.064
(1.34) (1.32) (0.96) (0.78) (2.18) (1.83) (0.75) (1.56)
SALGRO 0.0608 0.0046 Ϫ0.1005 Ϫ0.0023
(0.77) (0.45) (Ϫ1.02) (Ϫ0.73)
DIVPAY Ϫ0.2193 Ϫ0.0006 0.3147 0.0151
(Ϫ1.03) (Ϫ0.02) (0.85) (1.07)
INTCON 0.4004 0.0430 0.5371 0.0134 Ϫ0.4336 Ϫ0.0102 Ϫ0.2537 Ϫ0.0251
(1.88) (1.39) (1.86) (1.09) (Ϫ1.08) (Ϫ0.99) (Ϫ0.47) (Ϫ0.54)
Constant Ϫ2.9050*** Ϫ3.3167** Ϫ1.5881 Ϫ0.5843
(Ϫ3.92) (Ϫ3.02) (Ϫ1.16) (Ϫ0.37)
Firms with CEO turnover only
(Type II)
COMSIZ 0.0899 0.0105 0.0647 0.0087 0.0727 0.0048 Ϫ0.1547 Ϫ0.0144
(1.04) (0.87) (0.55) (0.43) (0.46) (0.82) (Ϫ0.78) (Ϫ0.44)
OWNFOR 0.1987* 0.0223 0.2091* 0.0351* 0.0853 0.0054 Ϫ0.026 0.0123
(2.31) (1.91) (2.05) (2.02) (0.48) (0.78) (Ϫ0.13) (0.34)
DOMSHA 0.2489 0.0094 0.1226 Ϫ0.0025 0.0942 0.0008 Ϫ0.0399 Ϫ0.0172
(1.14) (0.32) (0.45) (Ϫ0.05) (0.27) (0.07) (Ϫ0.10) (Ϫ0.25)
OPECOM Ϫ0.008 Ϫ0.0151 0.0139 Ϫ0.0169 0.6804 0.0148 0.5882 0.0619
(Ϫ0.04) (Ϫ0.47) (0.05) (Ϫ0.36) (1.77) (1.24) (1.45) (1.03)
SALGRO 0.0228 Ϫ0.0016 Ϫ0.0325 0.0004
(0.31) (Ϫ0.16) (Ϫ0.37) (0.02)
DIVPAY Ϫ0.7448*** Ϫ0.0881** Ϫ0.5398 Ϫ0.0182
(Ϫ3.38) (Ϫ3.23) (Ϫ1.48) (Ϫ1.46)
Continued
9780230_217287_07_cha05. dd 141 5/14/2009 3:47:59 PM
Table 5.6 Continued
Model
a
[M5] [M6] [M7] [M8]
Coef. dF/dx Coef. dF/dx Coef. dF/dx Coef. dF/dx
Firms
with CEO
turnover
only
(Type II)
INTCON 0.4424* 0.0572 0.4370 0.0597 0.3219 0.0211 0.3570 0.0931
(2.09) (1.68) (1.58) (1.10) (1.93) (1.19) (0.86) (1.15)
Constant Ϫ1.5278* Ϫ1.6151 Ϫ2.1186 Ϫ0.6078
(Ϫ2.21) (Ϫ1.71) (Ϫ1.68) (Ϫ0.49)
Firms with turnover of senior managers only
(Type III)
COMSIZ 0.0091 0.0105 0.0426 0.0047 Ϫ0.1389 0.0048 Ϫ0.1513 Ϫ0.014
(0.11) (0.87) (0.38) (0.20) (Ϫ0.93) (0.82) (Ϫ0.77) (Ϫ0.44)
OWNFOR 0.0889 0.0223 0.0596 0.0001 Ϫ0.2039 0.0054 Ϫ0.3978 0.0123
(0.99) (1.91) (0.55) (0.01) (Ϫ0.86) (0.78) (Ϫ0.95) (0.34)
DOMSHA 0.2224 0.009 0.4007 0.0754 0.1150 0.0008 0.0464 Ϫ0.0172
(1.14) (0.32) (1.53) (1.51) (0.36) (0.07) (0.12) (Ϫ0.25)
OPECOM 0.1706 Ϫ0.0151 0.3066 0.0643 0.7906* 0.0148 0.4877 0.0619
(0.86) (Ϫ0.47) (1.23) (1.30) (2.17) (1.24) (1.30) (1.03)
SALGRO 0.0966 Ϫ0.0016 Ϫ0.098 Ϫ0.0195
(1.41) (Ϫ0.16) (Ϫ1.17) (Ϫ1.11)
DIVPAY Ϫ0.3858* Ϫ0.0881** Ϫ0.2489 Ϫ0.0182
(Ϫ2.03) (Ϫ3.23) (Ϫ0.75) (Ϫ1.46)
INTCON
0.1119 0.0572 0.3562 0.0493 Ϫ0.4212 0.0211 Ϫ0.3853 0.0931
(0.56) (1.68) (1.36) (0.84) (1.22) (1.19) (0.88) (1.15)
Constant Ϫ0.7478 Ϫ2.1102* 0.2478 Ϫ0.2216
(Ϫ1.15) (Ϫ2.22) (Ϫ0.22) (Ϫ0.18)
Industry dummies Yes Yes Yes NO
b
N 586 358 231 140
Log likelihood Ϫ620.4855 Ϫ394.0279 Ϫ227.9279 Ϫ136.0024
Notes:
a
Model [M5] is estimated using a full sample; Model [M 6], firms without dividend payment; Model [M7], firms with lower sales growth than the indus-
trial average; Model [M8], firms without dividend payment and with lower sales growth than the industrial average.
b
Industrial dummies are not included because the marginal effects are not estimated clearly probably due to the small number of Type I turnovers (11 out of 140).
dF/dx denotes the marginal effects of the independent variables.
t-values are in parentheses. *, **, and *** denote the 5%, 1%, and 0.1% significance, respectively.
Source: Authors’ estimation. The base category for estimation is firms with no turnover (Type IV).
9780230_217287_07_cha05. dd 142 5/14/2009 3:47:59 PM
Corporate Governance and Managerial Turnover 143
DIVPAY, OWNFOR, and DOMSHA, between the MNP estimations with
and without the internal conflict dummy variable. Since it is possible that
the estimated coefficients of INTCON are biased due to the correlation
between this variable and error terms, we should be careful to interpret
the results. However, it is safe to say that the relationships between turno-
ver and company characteristics, such as corporate performance and own-
ership structures observed in Table 5.3, are not spurious due to the effects
of the intracompany infighting.
Concluding remarks
Although the corporate governance literature provides a significant amount
of empirical evidence of the significant association between corporate
performance and CEO turnover in developed countries, the majority of
research on Russian firms is quite negative in this respect. The little cor-
relation between two factors may be due to not having a sufficient number
of observations of turnover events. It is also possible that the reason of the
insignificant relation between bad performance and CEO turnover in prior
studies is that the authors implicitly assume that the Russian manner of
managerial dismissal is very similar to that in the United States, disregard-
ing the collective nature of the management system in Russian firms, espe-
cially in ex-socialist enterprises.
Using a unique firm-level dataset obtained from our large-scale enterprise
survey conducted in 2005, we attempted to deal with the above two prob-
lems. The estimation results of the multinomial probit model reported in
the previous section strongly suggest that nonpayment of dividends as a
proxy of bad corporate performance is significantly correlated with mana-
gerial turnover, in stark contrast to the standard logit estimation of CEO
turnover, as in preceding studies. By using information of various turnovers
simultaneously, we could increase the statistical powers to reject the null
hypothesis.
We also found that the presence of a dominant shareholder or foreign
investor is another important factor causing managerial dismissal in
Russian corporations. This finding is mostly consistent with previous work.
However, it is more important to point out from the analytical viewpoint
that these two kinds of shareholders may have different effects on manage-
rial turnover in terms of magnitude. That might be because there is a per-
ceptible difference in the behavioral patterns between Russian and foreign
investors. Large shareholding may also play a significant role in inspiring
dominant shareholders to conduct intensive monitoring over management
activities in companies they own. By not simply removing company presi-
dents in response to poor management outcomes, dominant shareholders
may utilize human capital in their companies more effectively than minor-
ity shareholders, including foreign investors, do.
9780230_217287_07_cha05. dd 143 5/14/2009 3:48:00 PM
144 Organization and Development of Russian Business
At any rate, the presence of an empirical relationship between dividend
payment and managerial turnover indicates the growing respect for share-
holder wealth in Russia among domestic investors. As the transition to a
market economy proceeds, we may see more defined changes in the empiri-
cal results of this country, even in the near future.
Acknowledgments
This chapter is an outcome from the Japan–Russia joint research project
entitled “Corporate governance and integration processes in the Russian
economy” launched by the Institute of Economic Research, Hitotsubashi
University (Tokyo) and the Institute for Industrial and Market Studies, State
University – Higher School of Economics (Moscow). Our research work was
financially supported by the Japan Securities Scholarship Foundation (JSSF)
and grants-in-aid for scientific research from the Ministry of Education and
Science of Japan (No. 16530149; No. 17203019) in FY2005–6.
Notes
1. See Coughlan & Schmidt (1985), Weisbach (1988), Martin & McConnell (1991),
Kang & Shivdasani (1995), Denis et al. (1997), Goyal & Park (2002), Abe & Oguro
(2004), Huson et al. (2004), and others.
2. In Russia, the title of CEO is a relatively new appointment, appearing only
recently among listed firms. The majority of Russian companies still use the title
of General Director or Company President for their top executives. With this in
mind, in this chapter we utilize the title of CEO for all levels of top management
in Russia for simplicity
3. This section quotes Iwasaki (2007b) but is substantially modified for discussion
in this chapter.
4. The OLS estimation result is as follows:
Turnover = 7.64 * Ϫ0.27 Reformyear + 5.79 * After 1997,
(8.00) (1.18) (4.69)
N = 56, R
2
= 0.480, Adj. R
2
= 0.461, F = 24.484*.
The t-values are in parentheses. * denotes that the coefficient is significant at the
1% level.
5. During the mass-privatization period from August 1992–June 1994, 67% of all
state-owned enterprises eligible for privatization adopted an option plan in
which management and employees were allowed to acquire a maximum of 51%
of a firm’s total stock at 70% of face value. As a result, the vast majority of the
privatized firms were heavily controlled by insiders. However, in the second half
of the 1990s, shareholding by insiders was remarkably decreased mainly due to
massive sales of their own shares by rank and file workers (Iwasaki 2007b).
6. For instance, a survey covering 334 industrial firms revealed that, as of the end
of 2001, the largest shareholders in enterprises whose CEOs were appointed in
or after 1998 had an average ownership of 45.1%, whereas those in enterprises
whose CEOs had been in office for 10 years had an average ownership of 24.2%
(Dolgopyatova 2003).
9780230_217287_07_cha05. dd 144 5/14/2009 3:48:00 PM
Corporate Governance and Managerial Turnover 145
7. For details of the vote-counting method, see Hunter & Schmidt (2004).
8.
CEO turnover occurred in 69 of the 110 companies surveyed. Twenty companies
experienced the phenomenon twice, and 9 companies experienced it three or
more times during the survey period (Rachinsky 2002).
9. It is called the “Russian Economic Barometer” survey project and is one of repre-
sentative longitudinal enterprise surveys in Russia. More information is available
at: />10. In this paper, we do not use the multinomial logit (MNL) model for our empiri-
cal analysis because the IIA (independence from irrelevant alternatives) assump-
tion for MNL is rejected. Since MNP with a general covariance matrix takes a
prohibitively long time to converge, we assume that all the covariances between
type i residuals and type j residuals, except for diagonal elements, are identical.
11. See Stern (1997) for details of the procedure to work with MNP model.
12. For more details on a workers’ joint-stock company, see Iwasaki (2007a).
13. Another aspect to be noticed is its response rate. Because our survey was inter-
view-based, the response rate was not expected to be high. The rate was approxi-
mately one third; i.e., one of three company executives refused to participate in
the survey (Dolgopyatova & Iwasaki 2006).
14. Although the survey evaluates current board composition, it did not ask the
composition before the managerial turnover event. We could have included the
board composition in our explanatory variables, but we did not do so because
(a) turnover of top executives is likely to precede changes in board composition
and the endogeneity issue is thus serious; (b) in many cases, when we included
information on the outside board member ratio, our likelihood functions failed
to converge; and (c) for some cases in which we could obtain the maximum, the
outside board member ratio was not statistically significant.
15. There are two types of stock corporations in Russia – open and closed companies.
The stock of a closed company cannot be traded without permission of all other
stockholders. To be a closed company, several criteria, such as the number of
shareholders and the amount of capital, should be met. For more details on this
matter, see Iwasaki (2007a).
16. The marginal effects in the logit model are calculated as
()[1()]Yx x x
ii i

⌳⌳ww
,
where Y is a dichotomous dependent variable, x is a vector of independent vari-
ables including a constant term, E is a parameter vector, and / (.) indicates the
logistic cumulative distribution function. In the multinomial probit models, /
(.) is substituted as the standard normal distribution function.
17. See page 52 in Dolgopyatova & Iwasaki (2006).
18. The sample size is smaller in Table 5.6 because some companies refused to answer
the question about the occurrence of internal conflict.
Bibliography
Abe, N. & Jung, T. (2004) Cross-shareholdings, outside directors, and managerial
turnover: The case of Japan. Hi-Stat discussion paper No. 38, Tokyo: Institute of
Economic Research, Hitotsubashi University.
Abe, N. & Oguro, Y. (2004) Shacho koutai to gaibushusinsha torisimariyaku:
Semiparametric suitei niyoru bunseki, Keizai Kenkyu, 55/1: 72–84.
Barberis, N., Boycko, M., Shleifer, A., & Tsukanova, N. (1996) How does privatiza-
tion work? Evidence from the Russian shops, Journal of Political Economy, 104:
764–790.
9780230_217287_07_cha05. dd 145 5/14/2009 3:48:00 PM