The Financial Times Guide to Options: The Plain and Simple Guide to Successful Strategies (2nd Edition) (Financial Times Guides)_5 doc
Bạn đang xem bản rút gọn của tài liệu. Xem và tải ngay bản đầy đủ của tài liệu tại đây (389.81 KB, 23 trang )
76 Part 2
Options spreads
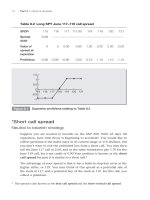
Table 8.2 Long SPY June 117–119 call spread
SPDR
115 116 117 117.90 118 119 120 121
Spread
debit
–0.90
Value of
spread at
expiration
0 0 0.00 0.90 1.00 2.00 2.00 2.00
Profit/loss
–0.90 –0.90 –0.90 0.00 0.10 1.10 1.10 1.10
*Short call spread
Neutral to bearish strategy
Suppose you are neutral to bearish on the S&P 500. With 45 days till
expiration, June time decay is beginning to accelerate. You would like to
collect premium if the index stays in its current range or if it declines, but
you don’t want to risk the unlimited loss from a short call. You may then
sell the June 117 call at 2.60, and in the same transaction pay 1.70 for the
June 119 call, for a net credit of 0.90 Your position is known as the short
call spread because it is similar to a short call.
4
The advantage of your spread is that it has a built-in stop-loss cover at the
higher strike, or 119. You may think of this spread as a potential sale of
the stock at 117, and a potential buy of the stock at 119. For this risk, you
collect a premium.
4
This spread is also known as the bear call spread and the short vertical call spread.
1.5
1
0.5
0
–0.5
–1
115 116 117 118 119 120 121
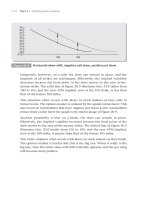
Figure 8.1
Expiration profit/loss relating to Table 8.2
8
Call spreads and put spreads, or one by one directional spreads 77
The expiration profit/loss of this spread is opposite to the above long call
spread, but the break-even level is the same. Here, the maximum profit
is the credit received from the spread, or 0.90. This profit is earned if the
stock is at or below the lower strike, or 117.
The maximum loss occurs if the stock is at or above the higher strike. This
is calculated as the difference between strike prices minus the income from
the spread, or (119 – 117) – 0.90 = 1.10.
The break-even level is the same as the long call spread. This is the level
at which a loss due to an increase in the stock price matches the income
from the spread. The calculation is the lower strike price plus the price of
the spread, or 117 + 0.90 = 117.90. Below is a summary of this spread’s
expiration profit/loss:
Credit from short June 117 call: 2.60
Debit from long June 119 call: –1.70
–––––
Total credit: 0.90
Maximum profit: credit from spread: 0.90
Maximum loss: (difference between strikes) – credit from spread:
(119 – 117) – 0.90 = 1.10
Break-even level: lower strike + credit from spread: 117 + 0.90 = 117.90
The risk/return potential from this spread is also opposite to the long call
spread, or maximum loss divided by maximum return at 1.10/0.90. Here, a
risk of each $110 offers a potential return of $90.
Table 8.3 shows the expiration profit/loss for this short call spread.
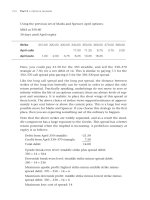
Table 8.3 Short SPY June 117–119 call spread
SPDR
115 116 117 117.90 118 119 120 121
Spread
credit
0.90
Value of
spread at
expiration
0 0 0.00 0.90 1.00 2.00 2.00 2.00
Profit/loss
0.90 0.90 0.90 0.00 –0.10 –1.10 –1.10 –1.10
The expiration profit/loss for this spread is graphed in Figure 8.2.
78 Part 2
Options spreads
*Long put spread
Bearish strategy
The SPDR is currently trading at 115.22, and you are bearish, short term,
on the S&P 500 index. You may wish to purchase the June 113 put to
profit from a downside move. With 45 days till expiration, time decay is
accelerating and the implied volatility is higher than it has been recently,
so an expenditure of 3.10 or $310, may seem too great.
Instead, you could sell the June 111 put at 2.60, and in the same transac-
tion pay 3.10 for the June 113 put, for a total debit of 0.50. Your short
put then effectively finances the purchase of your long put, and minimises
your exposure to the Greeks.
The trade-off is that your downside profit is limited by the 111 put, but
at that point you have probably captured the best part of the move. Your
analysis may tell you that the SPX is supported below 111, in which case
your 111 put would effectively be the level at which you take the profit
from your 113 put.
In this case, you are buying the June 113–111 put spread. This position
is known as the long put spread because it is similar to a long put.
5
You
may simply think of this spread as a potential sale of the index (the ETF)
at 113, and a potential buy of the index at 111. For this profit potential
you pay a premium.
In order to assess the profit/loss potential of the spread at expiration, first
the price of the spread is considered as a unit: 0.50.
1
0.5
0
–0.5
–1
–1.5
115 116 117 118 119 120 121
Figure 8.2
Expiration profit/loss relating to Table 8.3
5
This spread is also known as the bear put spread and the long vertical put spread.
8
Call spreads and put spreads, or one by one directional spreads 79
At expiration, the maximum profit is gained if the stock is at or below
the lower strike, or 111. This is calculated as the difference between strike
prices minus the cost of the spread, or (113 – 111) – 0.50 = 1.50.
The maximum loss is taken if the stock is at or above the higher strike, or
113, at expiration. This is calculated simply as the cost of the spread, or 0.50
.
The break-even level is the level at which a decline in the stock pays for
the cost of the spread. This is calculated as the higher strike minus the cost
of the spread, or 113 – 0.50 = 112.50. The expiration profit/loss is summa-
rised as follows:
Debit from long June 113 put: –3.10
Credit from short June 111 put: 2.60
–––––
Total debit: –0.50
Maximum profit: difference between strikes – cost of spread:
(113 – 111) – 0.50 = 1.50
Maximum loss: cost of spread: 0.50
Break-even level: higher strike – cost of spread: 113 – 0.50 = 112.50
The risk/return potential of this spread is maximum loss divided by maxi-
mum profit, or 0.50/1.50. In other words you are risking $0.33 for each
potential profit of $1.00, or a risk/return ratio of 1/3.
6
In tabular form the expiration profit/loss is as in Table 8.4.
Table 8.4 Long SPY June 113–111 put spread
Microsoft
109 110 111 112 112.50 113 114 115
Spread
debit
–0.50
Value of
spread at
expiration
2 2 2 1 0.50 0 0 0
Profit/loss
1.50 1.50 1.50 0.50 0 –0.50 –0.50 –0.50
6
This is a more justifiable R/R than we had with the 117–119 call spread. The reason why
this put spread is cheaper than the call spread is because of the steep put skew. We’ll dis-
cuss this later.
80 Part 2
Options spreads
In graphic terms, the profit/loss of this spread is illustrated in Figure 8.3.
*Short put spread
Neutral to bullish strategy
On the other hand, suppose that you are neutral to bullish on the SPX
or the SPDR. Your analysis tells you that it is oversold, or that earnings
prospects are better than expected. You would like to sell a put in order
to profit either from time decay if the index stabilises or from a decline in
the put’s value if the index rallies. At the same time, you do not want the
exposure of a naked short put.
You may then sell the June 113 put at 3.10, and in the same transaction
pay 2.60 for the June 111 put, for a net credit of 0.50. This position is
known as the short put spread because it is similar to a short put.
7
The
advantage of this spread is that if the stock declines, a possible loss is cut
at the lower strike, or 111. You may think of this spread as a potential buy
of the stock at the higher strike, or 113, and a potential sale of the stock at
the lower strike, or 111. For this potential risk you collect a premium.
The expiration profit/loss of this short put spread is exactly opposite to the
former long put spread. The maximum profit is earned if the stock is at or
above the higher strike, or 113. This amount is simply the premium col-
lected for the spread, or 0.50.
The maximum loss occurs if the stock is at or below the lower strike, or
111. This is calculated as the difference between the strike prices minus
the income from the spread: (113 – 111) – 0.50 = 1.50.
1.5
2
1
0.5
0
–0.5
–1
109
110 111 112 113 114 115
Figure 8.3
Expiration profit/loss relating to Table 8.4
7
This spread is also known as the bull put spread and the short vertical put spread.
8
Call spreads and put spreads, or one by one directional spreads 81
The break-even level is the level at which a decline in the stock matches
the spread income. This is calculated as the higher strike minus the price
of the spread, or 113 – 0.50 = 112.50.
The profit/loss at expiration is summarised as follows:
Credit from short June 113 put: 3.10
Debit from long June 111 put: –2.60
–––––
Total credit from spread: 0.50
Maximum profit: credit from spread: 0.50
Maximum loss: difference between strikes – credit from spread:
(113 – 111) – 0.50 = 1.50
Break-even level: higher strike – credit from spread: 113 – 0.50 = 112.50
The risk/return potential for this spread is also opposite to the long put
spread, at maximum loss divided by maximum profit, or 1.50/0.50. Here,
you risk 3.0 to make 1.00.
8
In tabular form the expiration profit/loss is shown in Table 8.5.
Table 8.5 Short SPY June 113–111 put spread
SPY
109 110 111 112 112.5 113 114 115
Spread
credit
0.50
Value of
spread at
expiration
–2 –2 –2 –1 –0.50 0 0 0
Profit/loss
–1.50 –1.50 –1.50 –0.50 0 0.50 0.50 0.50
The graph of the profit/loss position at expiration is shown in Figure 8.4.
Long versus short call and put spreads
So far we have seen that both a long call spread and a short put spread
profit from an upside move. Likewise both a long put spread and a short
8
I wouldn’t, but many do because supposedly ‘It’ll never happen’.
82 Part 2
Options spreads
call spread profit from a downside move. The question may arise as to
which one is preferable. The basic difference is that of buying or selling
premium, and the trade-offs are similar to straight long or short positions
in calls or puts.
If a long and a short spread are both out-of-the-money and equidistant
from the underlying, the maximum profit of the long spread is greater
than the maximum profit of the short spread, but the short spread has the
greater probability to profit.
The probability of either spread expiring in the money can be approxi-
mated by the delta of the strike that is nearest the underlying. In the above
examples, both the 117 call and the 113 put have a delta that is approxi-
mately 0.40. If the index has a 40 per cent probability of moving to a strike
in either direction, then the direction which is short has a 60 per cent
probability of collecting its premium. The maximum loss, however, is
greater with the short spread. The maximum profit, of course, favours the
long spread, and this is a fair return for an outcome that is less probable.
Premium sellers often short out-of-the-money spreads that are at a safe
distance from the underlying because these spreads have limited risk.
Premium buyers, however, can afford to place their position closer to the
underlying because the cost of the spread is less than the cost of a straight
call or put.
Which strikes?
Call spreads and put spreads can be created with any two strikes. Of
course, there are trade-offs. (They don’t call them ‘options’ for nothing.)
0.5
1
0
–0.5
–1
–1.5
–2
109
110 111 112 113 114 115
Figure 8.4
Expiration profit/loss relating to Table 8.5
8
Call spreads and put spreads, or one by one directional spreads 83
If you spread the strikes, then you get a greater profit range but you pay
more. You need to do technical analysis to determine which strikes to
spread. Also, call spreads and put spreads can be any distance from the
underlying. The trade-offs are similar to those between straight out-of-the-
money and at-the-money calls or puts. The further a spread is from the
underlying, the less cost or income it has, and the less probability it has of
becoming in-the-money.
1×1s and volatility skews
In the stock or bond markets, the out-of-the-money put spread often costs
less than the equidistant out-of-the-money call spread. This is because the
lower strike put is priced higher than the higher strike call, although they
are the same distance from the underlying. In the above example, the 111
put is 2.60 while the 119 call is 1.70. This is a function of what are known
as volatility skews, which are discussed in Part 3.
In commodities, however, the call spreads are often cheaper than the equi-
distant put spreads because there is a positive call skew.
But don’t be bewildered at this point. If you spread
1×1s then you minimise your exposure to the
skews. Long call spreads and long put spreads are
the safest way to trade options.
A final note
The difference between a spread and a straight call or put is that the
spread’s maximum profit/loss can be quantified at the outset. For the
longs, the cost of the spread is the maximum loss, and if the trader is good
with technicals, he can pick his levels. For the shorts, these spreads allow
for premium selling with a built-in stop-loss order. On a risk/return basis
they can be recommended to everyone, especially beginners.
Long call spreads
and long put spreads
are the safest way to
trade options
9
One by two directional spreads
There are other ways of financing the purchase of a directional position.
Those that we will discuss in this chapter are variations of the long call
and put spreads. Again, they involve buying an option to take advantage
of a chosen market direction. But instead of selling one, they sell two
options at the strike price that is more distant from the underlying.
The spreads in this chapter are suitable for slowly trending markets, and
they are unsuitable for markets that are trending rapidly higher or lower,
or volatile markets that are subject to sudden shifts in direction.
Long one by two call spread
Bullish strategy
The long one by two call spread is a long call spread with an additional
short call at the higher strike. If XYZ is at 100, you could buy one 105 call
and sell two 115 calls in the same transaction. This spread is also known as
the one by two ratio call spread or the one by two vertical call spread.
In order to trade this spread, your outlook should call for the underlying
to increase to a level that is near, but not substantially above, the higher
strike. This spread, like the long call spread, has its maximum profit if the
underlying is at the higher strike at expiration. It is less costly than the
long call spread because it is financed by an extra short call. But because of
the extra short call, this spread has the potential for unlimited loss if the
underlying rallies substantially. The extra short call includes added expo-
sure to the Greeks.
86 Part 2
Options spreads
With Coca-Cola at 52.67, examine the August options on offer
1
(60 days
until expiration):
Strike
40 42.50 45 47.50 50 52.50 55 57.50 60
August calls
4.04 2.52 1.45 0.79 0.34
August puts
0.34 0.47 0.82 1.30 2.05 2.90
Here, you could pay 1.45 for one August 55 call and sell two August 60 calls
at 0.34 for a net debit of 0.77. At expiration, the maximum profit occurs if
the stock closes at the higher strike; this is the same level as with a long call
spread at the same strike. This profit is calculated as the difference between
the strike prices less the cost of the spread, or 60 – 55 – 0.77 = 4.23.
Because of the extra short call there are two break-even levels. The lower
break-even level is, like the long call spread, the lower strike price plus the
cost of the spread, or 55 + 0.77 = 55.77.
The upper break-even level is the maximum profit plus the higher strike
price, or 60 + 4.23 = 64.23.
Above the upper break-even level this spread takes a loss equivalent to the
amount that the stock increases. A summary of the profit/loss at expira-
tion is as follows.
Debit from August 55 call: 1.45
Credit from two August 60 calls: 2 × 0.34 = –0.68
–––––
Total debit: –0.77
Maximum profit: (difference between strikes) minus cost of spread:
(60 – 55) – 0.77 = 4.23
Lower break-even level: lower strike plus cost of spread: 55 + 0.77 = 55.77
Upper break-even level: maximum profit plus higher strike:
60 + 4.23 = 64.23
Maximum loss: unlimited upside
In order to evaluate the risk/return potential of this spread, you must con-
sider the upside potential of the stock or underlying. Remember that the
maximum loss is potentially unlimited.
1
Data courtesy of the Chicago Board Options Exchange, CBOE.
9
One by two directional spreads 8 7
In tabular form, the expiration profit/loss is as shown in Table 9.1.
Table 9.1 Coca-Cola long August 55-60 one by two call spread
Coca-
Cola
50.00 52.50 55.00 55.77 60.00 64.23 67.50 70.00 72.50
Spread
debit
–0.77
Value
of one
by one
spread at
expiration
0.00 0.00 0.00 0.77 5.00 5.00 5.00 5.00 5.00
Value
of extra
short
call at
expiration
0.00 0.00 0.00 0.00 0.00 –4.23 –7.50 –10.00 –12.50
Profit/loss
–0.77 –0.77 –0.77 0 –4.23 0 –3.27 –5.77 –8.27
In graphic form, the expiration profit/loss of this spread is as shown in
Figure 9.1.
2
4
6
0
–2
–4
–6
–8
50
52.5 55
57.5 60 62.5
65
67.5 70
Figure 9.1
Expiration profit/loss relating to Table 9.1
88 Part 2
Options spreads
Long one by two call spread for a credit
Bearish to slightly bullish strategy
With adjacent strikes, or strikes that are close to each other, the long one
by two call spread can often be done for a credit. Effectively, then, there
is no lower break-even level, and the spread will profit from a downside
market move. The upper break-even level, however, becomes much closer
to the underlying. But there is a hidden danger in this spread.
For example, using the above strikes, you could pay 1.45 for one Auggie
55 call and sell two Auggie 57.50 calls at 0.79 for a net credit of 0.13 on
the spread.
The upper break-even level is calculated as the higher strike plus the maxi-
mum profit, or 57.50 + 0.13 = 57.63.
Remember that above the upper break-even level this spread has the
potential for unlimited loss.
This spread may look like easy money, but don’t be misled. If the one
by two call (or put) spread can be done for a credit, the market is prob-
ably telling you that the underlying is sufficiently volatile to be above
the upper break-even level at expiration. Perhaps for this reason the one
by two spread for a credit is not often traded. If, after considering these
factors, your outlook still calls for the stock to remain below the upper
break-even level through expiration, then the long one by two call spread
for a credit is a justifiable strategy. This is not recomended for beginners.
Long one by two put spread
Bearish strategy
The long one by two put spread is a long put spread with an extra short
put at the lower strike. It is also known as the one by two ratio put spread or
the one by two vertical put spread. If XYZ is at 100, you could by one 95 put
and sell two 85 puts in the same transaction
.
In order to trade this spread, your outlook should
call for the underlying to decline to a level that
is near, but not substantially below, the lower
strike. At expiration the maximum profit is earned
if the stock closes at the lower strike, but because
of the extra short put, the maximum downside
The long one by two
put spread is a long put
spread with an extra
short put at the
lower strike
9
One by two directional spreads 8 9
loss is potentially great. The extra short put includes added exposure to
the Greeks. This spread is less costly than the long put spread because it is
financed by the extra short put.
With Coca-Cola at 52.67, examine the August options on offer
2
(60 days
until expiration):
Strike
40 42.50 45 47.50 50 52.50 55 57.50 60
August
calls
4.04 2.52 1.45 0.79 0.34
August
puts
0.34 0.47 0.82 1.30 2.05 2.90
With Coca-Cola at 52.67, in the August options, you could pay 2.05 for
the 50.00 put and sell two 45.00 puts at 0.82 for a net debit of 0.41 ($41).
At expiration, the maximum profit occurs if the stock closes at 45.00. This
profit is calculated as the difference between strikes minus the cost of the
spread, or (50.00 – 45.0 ) – 0.41 = 4.59.
Like the long one by two call spread, there are two break-even levels. The
upper break-even level is calculated as the higher strike minus the cost of
the spread, or 50.00 – 0.41 = 49.59 The lower break-even level is calculated
as the lower strike minus the maximum profit, or 45.00 – 4.59 = 40.41.
Below the lower break-even level the spread loses point for point with the
decline of the stock.
A summary of the expiration profit/loss is as follows:
Debit from long August 50.00 put: –2.05
Credit from two short August 45.00 puts: 2 × 0.82 = 1.64
–––––
Total debit: –0.41
Maximum profit: (difference between strikes) minus cost of spread:
50.00 – 45.00 – 0.41 = 4.59
Upper break-even level: higher strike minus cost of spread:
50.00 – 0.41 = 49.59
Lower break-even level: lower strike minus maximum profit:
45.00 – 4.59 = 40.41
Maximum loss: amount of stock decline below lower break-even level
2
Data courtesy of the Chicago Board Options Exchange, CBOE.
90 Part 2
Options spreads
The risk/return potential of this spread must consider that the potential
loss is the full amount that the stock may decline below the lower break-
even level.
In tabular form, the expiration profit/loss is as shown in Table 9.2.
Table 9.2 Coca-Cola long August 50–45 one by two put spread:
Coca-Cola at 52.67, 100 days until expiration
Coca-Cola
(below) 35.00 37.50 40.41 42.50 45.00 47.50 49.59 50.00
Spread
debit
–0.41
Value
of one
by one
spread at
expiration
5.00 5.00 5.00 5.00 5.00 5.00 2.50 0.41 0.00
Value
of extra
short
put at
expiration
– full amt –10.00 –7.50 –4.59 –2.50 0.00 0.00 0.00 0.00
Profit/loss
– full amt –5.41 –2.91 0.00 2.09 4.59 2.09 0.00 –0.41
In graphic form, the expiration profit/loss of this spread is shown in
Figure 9.2.
2
4
6
0
–2
–4
–6
–8
–10
32.5
35 37.5 40 42.5 45 47.5 50 52.5 55
Figure 9.2
Expiration profit/loss relating to Table 9.2
9
One by two directional spreads 9 1
How to manage the risk of the long one by
two spreads
The return scenario for these spreads is a gradual underlying move from the
long towards the short strike. If, however, the underlying makes a sudden
move to the short strike, with no sign of a retracement, the spread becomes
subject to the delta and vega risk of the extra short option. It is then advis-
able to cover the risk of this option. There are two practical solutions:
O
The first is simply to buy back the extra short. This cuts the loss on the
position and leaves a net long call or put spread with limited risk.
O
The second solution is less costly, and it is to buy an out-of-the-money
option that is the same distance from the two short options as they are
from the long option. For example, if the spread is long one 105 call and
short two 115 calls, and if XYZ rallies to 115, then the solution is to buy
one 125 call. Likewise, if the spread is long one 95 put and short two
85 puts, and if XYZ breaks to 85, then the solution is to buy one 75 put
.
In the first case, the resulting position is a long call butterfly, and in the
second case, the resulting position is a long put butterfly. Both positions
have limited risk because they have covered the naked short option. They
also have the potential to recoup some of the loss through time decay. The
butterfly spread is discussed in a separate chapter.
Before you trade any spread that is net short an option, you should have
a contingency plan as part of your risk scenario. At the same time as you
place your spread order, you should also place a buy-stop, market
order for a covering option that is activated at a predetermined level of
the underlying.
Long call ladder (UK), or long call Christmas
tree (US)
Bullish strategy
A variation of the long one by two is a spread
that places the two short options at different
strikes. The long call ladder is a long call spread
with an extra short call at a third strike that is
above the lower two strikes. If XYZ is at 100,
then you can buy one 105 call, sell one 110 call,
Long call ladder is a
long call spread with an
extra short call at a third
strike that is above the
lower two strikes
92 Part 2
Options spreads
and sell one 115 call in the same transaction. This spread is also known
as the long Christmas tree, or simply, the ‘tree’.
3
In practice, it is placed
out-of-the-money.
In August, with the Coca-Cola stock at 52.67, you could pay 1.45 for one
55.00 call, sell one 57.50 call at 0.79, and sell one 60.00 call at 0.34 for a
net debit of 0.32.
At expiration, the maximum profit for the ladder is earned when the stock
closes at the two upper strikes, 57.50 and 60. This profit is calculated as
the difference between the two lower strikes minus the debit, or 57.50 –
55.00 – 0.32 = 2.18. The lower break-even level is calculated as the lowest
strike plus the spread debit, or 55.00 + 0.32 = 55.32.
The upper break-even level is the highest strike plus the maximum profit.
In this case, the calculation is 60.00 + 2.18 = 62.18. Above the upper break-
even level the spread loses point for point with the stock, and faces the
possibility of unlimited loss. The expiration profit/loss is as follows:
Debit from long August 55.00 call: –1.45
Credit from short August 57.50 call: 0.79
Credit from short August 60.00 call: 0.34
–––––
Total debit: –0.32
Maximum profit: (middle strike minus lower strike) minus debit from
spread: here, (57.50 – 55.00) – 0.32 = 2.18
Lower break-even level: lowest strike plus spread debit:
55.00 + 0.32 = 55.32
Upper break-even level: highest strike plus maximum profit:
60.00 + 2.18 = 62.18
Maximum loss: potentially unlimited
Note again the potential for unlimited loss compared to a maximum profit
of 2.18. The expiration profit/loss of this spread is shown in Table 9.3.
3
This term probably signifies that the options are placed at higher and higher levels, like
ornaments on a Christmas tree. Remember that this spread is net short an option, so
you will want to put out the fire before it reaches the top.
9
One by two directional spreads 9 3
Table 9.3 Coca-Cola long August 55.00–57.50–60.00 call ladder
Coca-
Cola
52.50 55.00 55.32 57.50 60.00 62.18 65.00 (above)
Spread
debit
–0.32
Value
of one
by one
spread at
expiration
0.00 0.00 0.32 2.50 2.50 2.50 2.50 2.50
Value
of extra
short
call at
expiration
0.00 0.00 0.00 0.00 0.00 –2.18 –5.00 (– unlimited)
Profit/loss
–0.32 –0.32 0.00 2.18 2.18 0.00 –2.82 (– unlimited)
Figure 9.3 is a graph of this spread at expiration.
0
1
2
3
–1
–2
–3
–4
–5
–6
52.5
55
57.5 60 62.5 65 67.5
Figure 9.3
Expiration profit/loss relating to Table 9.3
94 Part 2
Options spreads
You can compare this ladder to the 55–60 one by two. It would cost 0.75,
and the break-even levels are 55.75 and 64.25. The maximum profit of the
1 × 2 is 4.25, but this profit level is 60.00. This ladder is a fair alternative in
terms of risk/return.
Long put ladder (UK), or long put Christmas
tree (US)
Bearish strategy
The long put ladder is a long put spread with
an extra short put at a third strike below the put
spread. If XYZ is at 100, then you could buy one
95 put, sell one 90 put and sell one 85 put in the
same transaction. This spread is also known as the
long put Christmas tree.
With Coca-Cola at 52.67 you could pay 2.05 for one August 50 put, sell
one August 45 put at 0.82 and sell one August 40 put at 0.34. Here, the
spread trades for a net debit of –0.89.
At expiration, the maximum profit is earned when the stock closes
between the lower two strikes, 45–40. In this case, because of the small
spread debit, this profit is calculated as the difference between the higher
two strikes minus the cost of the spread, or (50 – 45) – 0.89 = 4.11.
The upper break-even level is the highest strike minus the cost of the
spread, or 50 – 0.89 = 49.11. The lower break-even level is the lowest strike
minus the maximum profit, or 40 – 4.11 = 35.89.
The maximum loss can be significant; it is the full amount that the stock
declines below the lower break-even level. The expiration profit/loss for
this spread is as follows:
Debit from long August 50 put: –2.05
Credit from short August 45 put: 0.82
Credit from short August 40 put: 0.34
–––––
Total debit: –0.89
Maximum profit/loss: (highest strike minus middle strike) minus cost
of spread: (50 – 45) – 0.89 = 4.11
Upper break-even level: highest strike – cost of spread: 50 – 0.89 = 49.11
Lower break-even level: lowest strike minus maximum profit:
40 – 4.11 = 35.89
Maximum loss: amount of stock decline below lower break-even level
The long put ladder is a
long put spread with an
extra short put at a
third strike below
the put spread
9
One by two directional spreads 9 5
The risk/return potential of this spread should account for a decline in the
stock below the lower break-even level. The expiration profit/loss in tabu-
lar form is shown in Table 9.4.
Table 9.4 Coca-Cola long August 50–45–40 put ladder
Coca-
Cola
30.00 35.00 35.89 40.00 45.00 49.11 50.00 55.00
Spread
debit
–0.89
Value
of one
by one
spread at
expiration
5.00 5.00 5.00 5.00 5.00 0.89 0.00 0.00
Value
of extra
short
call at
expiration
–10.00 –5.00 –4.11 0.00 0.00 0.00 0.00 0.00
Profit/loss
–5.89 –0.89 0.00 4.11 4.11 0.00 –0.89 –0.89
Figure 9.4 is a graph of the expiration profit/loss.
4
6
2
0
–2
–4
–6
–8
30
32.5
35
37.5 40 42.5 45 47.5
50 52.5
Figure 9.4
Expiration profit/loss relating to Table 9.4
96 Part 2
Options spreads
You might compare this put ladder to the Coca-Cola call ladder. Here, we
have split strikes, while the call ladder has adjacent strikes. For the put
ladder we paid 0.82, while for the call ladder we paid 0.30. With the put
ladder, however, we have doubled our profit range from 2.50 points to
5.00 points. We have also placed our break-even point further from the
underlying.
How to manage the risk of the long ladder
The risk of the long ladder is managed similarly to that of the long one by
two. If the underlying suddenly moves to the short strike that was formerly
furthest out-of-the-money, the first solution is to buy back that strike.
The second solution is to buy the out-of-the-money option that is as far
from the ladder as the three options in the ladder are from each other.
For example, if the ladder is long one 105 call, short one 110 call and
short one 115 call, and if XYZ quickly rallies to 115, then the solution is
to buy one 120 call. Likewise, if the ladder is long one 95 put, short one
90 put and short one 85 put, and if XYZ suddenly breaks to 85, then the
solution is to buy one 80 put. In the first case, the resulting position is a
long call condor, and in the second case, the resulting position is a long
put condor. Both of these spreads have limited risk; they are discussed in
Chapter 13.
Ladders at different strike prices
With the ladder the consecutive strike prices are usually equidistant from
each other. The equidistance
4
may vary, however, from adjacent to any
number of non-adjacent strikes. For example, if XYZ is at 100, a call ladder
may have strike prices at 105, 110 and 115, or it may have strike prices at
105, 115 and 125. The second ladder costs more because the sum of the
options sold is less. Its profit potential, however, is 10 points instead of 5,
less cost. Its upper break-even level, or point of potential unlimited risk, is
further from the underlying. With ladders, the major risk consideration is
that the strike furthest out-of-the-money should be at a safe distance from
the underlying.
4
i.e., the distance that is equal. This word, found in the Lenny Jordan Dictionary, will
come in handy when we discuss spreads with four components.
9
One by two directional spreads 9 7
Asymmetric or broken ladder
Finally, there is no reason why the strikes of a ladder need to be equidis-
tant from each other. Asymmetric ladders are occasionally traded, and
they have different risk/return profiles. For example, you may wish to
place the second short strike further from the underlying. If XYZ is at 100,
instead of placing your call ladder at 105, 110 and 115, you may place it
at 105, 110 and 120. The second spread costs more and therefore has less
profit potential, but it has less risk because its upper break-even level is fur-
ther from the underlying.
Alternatively, you may place your ladder at 105, 115 and 120. This spread
costs more than the two above because the two options sold are the least
expensive, but it has the greatest profit potential. It also has the least
potential risk because its upper break-even level is the furthest from the
underlying. Just remember that the major risk of the ladder lies with the
extra short option.
Comparing call spreads, 1×2s and ladders
At this point, it will be constructive to compare the data from the spreads
already discussed. We want to examine costs, profit potentials, risks and
break-even levels. If we examine the call spreads, then we can apply the con-
clusions to the put spreads. Refer to the table of Coca-Cola options above.
Coca-Cola at 52.67
August options, 100 days until expiration
Try to develop your options awareness by taking a few minutes to analyse
the data in Table 9.5. Compare the costs or incomes to the potential prof-
its, and compare the potential profits to the upper break-even levels, etc.
The most risk averse spreads are obviously the two one by one call spreads.
Concerning the others, if the market moves in the direction of your short
strike you may have to cover simply out of worry. It is much easier to
make trading decisions when your judgement is not impaired by proxi-
mate risk.
An analysis procedure such as the above should always be used when
deciding which spread to trade.
98 Part 2
Options spreads
Table 9.5 Comparing call spreads, 1×2s and ladders
Coca-
Cola call
spreads
Cost/
income
Max.
profit
Max.
loss
Lower
break-even
Upper
break-even
(point of
unlim. loss
potential)
55–57.50
call spread
0.66 debit 1.84 0.66 55.66 none
55–60 call
spread
1.11 debit 3.89 1.11 56.11 none
55–60, one
by two
0.77 debit 4.23 unlim. 55.77 64.23
55–57.50–
60 ladder
0.32 debit 2.18 unlim. 55.32 62.18
A story about 1×2s and ladders
Several years ago I was a client strategist for a boutique London brokerage
firm. I would give lectures to clients about the same strategies that you are
learning. My job was to get the clients up to speed with options so that
when our brokers phoned them they would know what our brokers were
talking about.
We covered the fundamental spreads, the risk/return trade-offs, the use of
technical analysis, etc: in other words, the basics of options.
I also increased our brokers’ knowledge, but mostly in terms of applica-
tions. (Brokers seldom want to know about theory.) Then together we
devised trade recommendations which the brokers passed on to their
clients.
The clients did well. One of them took one of our recommendations and
bought a Bund put ladder at just the right time. The Greeks and the levels
worked in her favour. Another did well in the Euribor for the same reasons.
But later, one of the brokers falsely assumed that he had mastered what I
had taught him, and he began to recommend 1×2s and ladders without
consulting me. It led to disaster.