The Financial Times Guide to Options: The Plain and Simple Guide to Successful Strategies (2nd Edition) (Financial Times Guides)_7 doc
Bạn đang xem bản rút gọn của tài liệu. Xem và tải ngay bản đầy đủ của tài liệu tại đây (395.34 KB, 23 trang )
122 Part 2
Options spreads
Using the previous set of Marks and Spencer April options:
M&S at 350.60
30 days until April expiry
Strike
310.00 320.00 330.00 340.00 350.00 360.00 370.00 380.00
April calls
17.00 11.25 6.75 3.75 2.00
April puts
1.00 2.00 3.75 6.25 10.25 16.25
Here, you could pay 21.50 for the 350 straddle, and sell the 330–370
strangle at 7.50, for a net debit of 14. This is similar to paying 7.5 for the
350–370 call spread plus paying 6.5 for the 350-330 put spread.
Like the long call spread and the long put spread, the distance between
strikes of the long iron butterfly can be varied in order to adjust the risk/
return potential. Practically speaking, underlyings do not move to zero or
infinity within the life of an options contract; there are always levels of sup-
port and resistance. It is realistic to place the short wings of this spread at
these levels. The above choice of strikes views support/resistance at approxi-
mately 6 per cent below or above the current price. This is a large but very
possible move for Marks and Spencer. If you choose this strategy in the first
place, then you are expecting something out of the ordinary to happen.
Note that the above strikes are widely separated, and as a result the strad-
dle component has a large exposure to the Greeks. This spread has a better
return potential when the implied is increasing. A profit/loss summary at
expiry is as follows:
Debit from April 350 straddle: –21.50
Credit from April 330–370 strangle: 7.50
––––––
Total debit: 14.00
Upside break-even level: straddle strike plus spread debit:
350 + 14 = 364
Downside break-even level: straddle strike minus spread debit:
350 – 14 = 336
Maximum upside profit: highest strike minus middle strike minus
spread debit: 370 – 350 – 14 = 6
Maximum downside profit: middle strike minus lowest strike minus
spread debit: 350 – 330 – 14 = 6
Maximum loss: cost of spread: 14
12
Iron butterflies and iron condors: combining straddles and strangles 123
The risk/return ratio of this spread is 14/6, or 2.3/1, or £2.30 potential risk
for each potential return of £1. Admittedly, this is not an optimum risk/
return ratio, but it is better than that of the long 350 straddle if you expect
the stock to range at a maximum of 6 per cent.
And when a risk/return ratio looks this unfavourable, then you need to
consider doing the opposite side of the trade (see below).
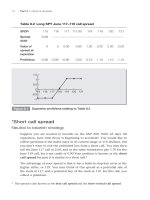
The expiry profit/loss for this spread is shown in Table 12.1.
Table 12.1 Marks and Spencer long April 330–350–370 iron
butterfly
M&S
310 320 326 340 350 360 364 370 380
Spread debit
–14
Value of spread
at expiry
20 20 14 1 0 0 10 14 20 20
Profit/loss
6 6 0 -4 –14 –4 0 6 6
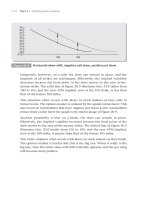
In graphic form, the profit/loss at expiry is as shown in Figure 12.1.
Suppose you think that the upside potential for the stock is greater than its
downside potential. You might create a long broken iron butterfly by sub-
stituting a short April 380 call at 2 for the short April 370 call at 3.75. Your
spread debit increases to 15.75, but your profit potential is now 8.25 greater.
Alternatively, you might create a three-way spread by paying 21.5 for the
April 350 straddle, and selling only the April 340 put at 6.25 for a total
debit of 15.25. Here, your upside profit potential is unlimited.
330
5
10
0
–5
–10
–15
310
320 340 350 360 370 380 390
Figure 12.1
Expiration profit/loss relating to Table 12.1
124 Part 2
Options spreads
*Short iron butterfly
For stationary markets
Suppose premium levels are high and trending downward. You would like
to sell a straddle but you don’t want the risk of unlimited loss. Instead,
you could sell the above iron butterfly. You are then short the April 350
straddle and go long the April 330–370 strangle, which acts as two stop-
loss orders at guaranteed levels. You are effectively short the 350–370 call
spread and short the 350–330 put spread. The profit/loss summary and
table at expiry for this spread are exactly opposite to those of the above,
while the expiry graph is the inverse.
Credit from April 350 straddle: 21.50
Debit from April 330–370 strangle: 7.50
–––––
Total credit: 14.00
Upside break-even level: straddle strike plus spread credit:
350 + 14 = 364
Downside break-even level: straddle strike minus spread credit:
350 – 14 = 336
Maximum profit: credit from spread: 14
Maximum upside loss: (highest strike minus middle strike) minus
spread credit: (370 – 350) – 14 = 6
Maximum downside loss: (middle strike minus lowest strike)
minus spread credit: (350 – 330) – 14 = 6
Note that the risk/return ratio is also opposite to the former spread, at
1/2.3. This is a preferred ratio, provided volatility is declining. The profit/
loss table at expiry is shown in Table 12.2.
Table 12.2 Marks and Spencer short April 330–350–37 iron
butterfly
M&S
320 330 336 340 350 360 364 370 380
Spread credit
14
Value of spread
at expiration
–20 –20 –14 –10 0 –10 –14 –20 –20
Profit/loss
–6 –6 0 4 14 4 0 –6 –6
The profit/loss at expiry is shown in Figure 12.2.
12
Iron butterflies and iron condors: combining straddles and strangles 125
Looking ahead (for those who already know the fundamentals) we will
learn that the profit/loss characteristics of this spread are identical to the
long April 330–350–370 call or put butterfly. Personally, I would rather
trade the above spread because the out-of-the-money call and put are
usually more liquid than either the corresponding in-the-money put and
call of the straight butterfly. In other words the April 370 call is probably
more liquid than the April 370 put. This usually results in a tighter bid–ask
market for the spread as a whole.
Lastly, there is every reason to vary the wings of the short or long iron
butterfly depending on your outlook. For example, you may sell the April
350 straddle at 21.50 and instead pay 13 for the April 340–360 strangle,
resulting in a net credit and maximum profit of only 8.5. Your break-even
levels are then 358.5 and 341.5. Your maximum loss is only 1.5, bringing
your risk/return ratio down to 1/5.6. The trade-off is that your profit range
is reduced from 28 points (twice the credit from the spread) to 17 points.
*Short iron condor
For stationary markets
The risks of the short strangle can be limited by
buying a long strangle at strikes that are further
out-of-the-money. If XYZ is at 100, you could sell
the 90–110 strangle, and buy the 85–115 strangle
in the same transaction. You might think of this
four-way spread as a short out-of-the-money call
spread at 110–115, plus a short out-of-the-money
put spread at 90–85. This spread is known as the short iron condor.
330
5
10
10
0
–5
–10
310
320 340 350 360 370 380 390
Figure 12.2
Expiration profit/loss relating to Table 12.2
The risks of the short
strangle can be limited
by buying a long
strangle at strikes
that are further out-of-
the-money
126 Part 2
Options spreads
The maximum profit here is the combined credit from the short call and
put spreads. Like the short call and put spread, the maximum loss here
is quantifiable and limited at the outset. Like all premium selling strate-
gies, this spread is most profitable when used with accelerated time decay.
Declining implied and historical volatilities are also profitable scenarios
for this spread. If your outlook calls for lower market volatility, this spread
is one of the best choices.
Using the previous set of Marks and Spencer options, you could sell the
April 340–360 strangle at 13, and pay 7.5 for the April 330–370 strangle,
for a net credit of 5.5.
On the upside, this spread behaves like a short 360–370 call spread for
which you have collected 5.5. At expiry, the upside break-even level is
the strike price of the lower call plus the total income from the spread, or
360 + 5.5 = 365.5. The maximum upside loss is the difference between call
strikes minus the income from the spread, or (370 – 360) – 5.5 = 4.5.
On the downside, this spread behaves like a short 340–330 put spread
for which you have collected 5.5. At expiry, the downside break-even
level is the strike price of the higher put minus the total income from the
spread, or 340 – 5.5 = 334.5. The maximum downside loss is the difference
between put strikes minus the income from the spread, or (340 – 330) –
5.5 = 4.5. The profit/loss at expiration is summarised as follows:
Credit from short April 340 put: 6.25
Credit from short April 360 call: 6.75
Debit from long April 330 put: –3.75
Debit from long April 370 call: –3.75
–––––
Total credit: 5.50
Maximum profit: income from spread: 5.5
Upside break-even level: lower call strike plus spread credit:
360 + 5.5 = 365.5
Downside break-even level: higher put strike minus spread credit:
340 – 5.5 = 334.5
Maximum upside loss: difference between call strikes minus spread
credit: (370 – 360) – 5.5 = 4.5
Maximum downside loss: difference between put strikes minus spread
credit: (340 – 330) – 5.5 = 4.5
12
Iron butterflies and iron condors: combining straddles and strangles 127
The risk/return ratio for this spread is maximum loss divided by maxi-
mum profit, or 4.5/5.5 = 0.82 or 0.82 at risk for each potential return of
1.
1
Although the profit potential of this spread is not spectacular, neither
is the maximum loss. Also consider that the profit range is 365.5 – 334.5
= 31 points. The stock would need to settle more than +/– 4.4 per cent at
expiry before a loss would result. Remember, you are trading this spread
because you expect the stock to range, and for volatility to come down.
The expiry profit/loss is shown in Table 12.3.
Table 12.3 Marks and Spencer short April 330–340–360–370 iron
condor
M&S
320.0 330.0 334.5 340.0 360.0 365.5 370.0 380.0
Spread
credit
5.5
Value of
spread at
expiration
–10.0 –10.0 –5.5 0.0 0.0 –5.5 –10.0 –10.0
Profit/loss
–4.5 –4.5 0.0 5.5 5.5 0.0 –4.5 –4.5
The expiration profit/loss is graphed as in Figure 12.3.
1
It can be easier to think in terms of the risk as the number 1. Here, you could calculate
the R/R ratio as 5.5/4.5 = 1.22, or risking 1 to make 1.22.
330
0
2
4
6
–2
–4
–6
310
320 340 350 360 370 380 390
Figure 12.3
Expiration profit/loss relating to Table 12.3
128 Part 2
Options spreads
Again, there are asymmetric possibilities. If you are range-bullish, you
might sell the 350–340 put spread at 4 and sell the 360–380 call spread
at 4.75 for a total credit of 8.75. Here, your maximum loss is 1.25 on the
downside and 11.25 on the upside. Your break-even levels are 341.25 and
368.75, with a profit range of 27.5 points.
*Long iron condor
For volatile markets
The opposite form of the above four-way spread is occasionally used as a
way of financing the long strangle. If XYZ is at 100, you could buy the
95–105 strangle and sell the 90–110 strangle in one transaction. You
might think of this as a long out-of-the-money call spread at 105–110,
plus a long out-of-the-money put spread at 100–95. This spread is known
as the long iron condor. As with long call and put spreads, the long
options here can be placed closer to the underlying because they are
financed by short options that are further out-of-the-money. There is less
potential return than with the long strangle, but there is also less cost and
less premium risk.
With the previous set of Marks and Spencer options, you could trade this
spread with non-adjacent strikes on both the call and put sides in order to
extend the profit range. You could pay 13 for the April 340–360 strangle,
and sell the April 330–370 strangle at 7.5, for a net debit of 5.5.
On the upside, this spread behaves like a long April 360–370 call spread
for which you have paid 5.5. At expiration, the upside break-even level is
the lower call strike plus the cost of the spread, or 360 + 5.5 = 365.5. The
maximum upside profit is the difference between call strikes minus the
cost of the spread, or (370 – 360 ) – 5.5 = 4.5. The maximum risk is the
cost of the spread, or 5.5.
On the downside, this spread behaves like a long April 340–330 put spread
for which you have paid 5.5. At expiration, the downside break-even level
is the higher put strike minus the cost of the spread, or 340 – 5.5 = 334.5.
The maximum downside profit is the difference between put strikes minus
the cost of the spread, or (340 – 330) – 5.5 = 4.5. The maximum risk is
again the cost of the spread, or 5.5. The expiration profit/loss is summa-
rised as follows:
12
Iron butterflies and iron condors: combining straddles and strangles 129
Debit from long April 360 call: –6.75
Debit from long April 340 put:
–6.25
Credit from short April 370 call: 3.75
Credit from short April 330 put: 3.75
–––––
Total debit: –5.50
Upside break-even level: lower call strike plus spread debit:
360 + 5.5 = 365.5
Downside break-even level: higher put strike minus spread debit:
340 – 5.5 = 334.5
Maximum upside profit: difference between call strikes minus spread
debit: (370 – 360) – 5.5 = 4.5
Maximum downside profit: difference between put strikes minus
spread debit: (340 – 330) – 5.5 = 4.5
Maximum loss: cost of spread: 5.5
The risk/return potential is maximum loss/maximum profit: 5.5/4.5 =
1.2 at risk for each potential profit of 1.
2
Table 12.4 shows the expiration
profit/loss.
Table 12.4 Marks and Spencer long April 330–340–360–370 iron
condor
M&S
320.0 330.0 334.5 340.0 360.0 365.5 370.0 380.0
Spread debit
–5.5
Value of
spread at
expiration
10.0 10.0 5.5 0.0 0.0 5.5 10.0 10.0
Profit/loss
4.5 4.5 0.0 –5.5 –5.5 0.0 4.5 4.5
A graph of the expiration profit/loss is shown in Figure 12.4.
2
The opposite side of this trade is preferable.
130 Part 2
Options spreads
330
0
2
4
6
–2
–4
–6
310
320 340 350 360 370 380 390
Figure 12.4
Expiration profit/loss relating to Table 12.4
13
Butterflies and condors:
combining call spreads and
put spreads
The spreads in this chapter are used most often to profit from stationary or
range-bound markets. All combine a long one by one spread with a short
one by one spread that is further out-of-the-money. For one example, if
XYZ is at 100, you could buy the 95–100 call spread and sell the 100–105
call spread to create a long call butterfly.
All these spreads have four components. They are most commonly
bought, and they are used to profit from declining volatility and/or pre-
mium erosion. There are directional uses as well, which we will discuss.
All these spreads are able to be traded in one transaction on most, if not
all, exchanges. Their bid–ask markets are only marginally greater than
those of single options. When purchased, they have minimal risk, and are
therefore recommended for new traders.
*Long at-the-money call butterfly
For stationary markets
The long at-the-money call butterfly is most easy to understand as the
combination of a long call spread whose higher strike is at the money,
plus a short call spread whose lower strike is also at the money. For exam-
ple, if XYZ is at 100, the long at-the-money call butterfly would be a long
95–100 call spread plus a short 100–105 call spread. The combined spread
is long one 95 call, short two 100 calls, and long one 105 call.
The spread is done for a debit, usually small, and the debit is the maxi-
mum potential loss. The profit/loss graph at expiration resembles a
butterfly. If the following discussion seems complicated, keep in mind that
this spread is basically two call spreads combined.
132 Part 2
Options spreads
The return scenario is for the underlying to close at the middle strike at
expiration. There, the long, lower call spread is worth its maximum, or the
difference between the lower two strikes, and the short, upper call spread
expires worthless. Taking the example above, if XYZ closes at 100, then the
95–100 call spread is worth 5, and the 100–105 call spread is worth zero.
The cost of the butterfly is then subtracted from 5 to calculate the profit.
There are two common risk scenarios.
O
The first is that at expiration the underlying closes at or below the
lowest strike, leaving all options out-of-the-money and worthless. If
XYZ closes at 93, then all the above options will settle at zero. The cost
of the butterfly is then taken as a loss.
O
The second risk scenario is that at expiration the underlying closes
at or above the highest strike. There, both call spreads expire at full
and equal value, making their sum zero. For example, with the long
95–100–105 call butterfly above, if XYZ closes at 108, both call spreads
are worth 5. The profit on the long 95–100 call spread pairs off against
the loss on the short 100–105 call spread. The butterfly is then worth-
less, and the cost of the butterfly is taken as a loss.
There are other, less common risks, and they are discussed at the end of
the section on butterflies.
A long at-the-money butterfly increases in value as it approaches expira-
tion and when the underlying remains between the outermost strikes.
Because it is a premium selling strategy, it is best
opened when the options contract has 60 days or
less till expiration. Because there is minimum risk
to the butterfly, it can be opened close to expira-
tion, for example, under 30 days, and it can be
held until several days before an options contract
expires. The risk remains mimimal provided the
spread remains at the money, i.e. with no short
strike deeply in the money and therefore subject to early assignment.
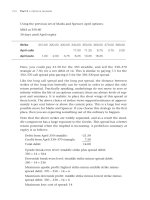
Taking again the set of Marks and Spencer options:
M&S at 350.60
40 days until April expiry
Strike
310.00 320.00 330.00 340.00 350.00 360.00 370.00 380.00
April calls
17.00 11.25 6.75 3.75 2.00
April puts
1.00 2.00 3.75 6.25 10.25 16.25
A long [ATM] butterfly
increases in value as it
pproaches expiration
and when the underlying
remains between the
outermost strikes.
13
Butterflies and condors: combining call spreads and put spreads 133
Here, you could pay 17 for one April 340 call, sell two April 350 calls at
11.25 and pay 6.75 for the April 360 call for a net debit of 1.25 You are
then long the April 340–350–360 call butterfly. The premium outlay is
small, but so is the possibility of the shares closing at 350, 30 days from
now. On the other hand, the potential profit is 8.75, and the profit
range is 8.75 × 2 = 17.5 points. The value of the spread grows as expiry
approaches and as the shares remain centred at approximately 350.
At expiration, the maximum profit occurs if the shares close at 350. There,
the lower call spread is worth its maximum, 10, and the upper call spread
is worth its minimum, 0. The profit is calculated as the difference between
the lower two strikes minus the cost of the butterfly, or (350 – 340) –1.25 =
8.75. The maximum loss is the cost of the butterfly, or 1.25.
At expiry, there are two break-even levels with the call butterfly. The lower
level is where the value of the long call spread pays for the cost of the but-
terfly. This is calculated as the lowest strike price plus the spread debit, or
340 + 1.25 = 341.25.
The higher break-even level is where the profit on the long call spread
equals the loss on the short call spread. This could be calculated as the dif-
ference between the lower two strikes, minus the butterfly debit, plus the
middle strike, or (350 – 340) – 1.25 + 350 = 358.75. However, it is more
easily calculated as the highest strike minus the butterfly debit, or 360 – 1.25
= 358.75. At this level, the value of the 340–350 call spread at 10, less the
butterfly debit of 1.25, equals the value of the 350–360 call spread at 8.75.
The profit range of this butterfly is then 358.75 – 341.25 = 17.50. It is
important to think about profit ranges when trading volatility because, in
essence, we are trading a range of probable outcomes for the underlying
at expiry.
The expiry profit/loss is summarised as follows:
Debit from one long April 340 call: –17.00
Debit from one long April 360 call: –6.75
Credit from two short April 350 calls: 2 × 11.25 = 22.50
––––––
Total debit: –1.25
Downside break-even level: lowest strike plus cost of butterfly:
340 + 1.25 = 341.25
Upside break-even level: highest strike minus cost of butterfly:
360 – 1.25 = 358.75
Maximum profit: difference between lower two strikes minus cost of
butterfly: (350 – 340) – 1.25 = 8.75
134 Part 2
Options spreads
Level of maximum profit: middle strike: 350
Maximum loss: cost of butterfly: 1.25
The risk/return ratio for this spread, at expiry, is 1.25/8.75, or 0.14 at risk
for each potential profit of 1, or 1 at risk for a return of 7.
1
This low ratio is
the particular advantage of the long butterfly.
You don’t want to hold this spread until expiry, however. Instead you
want to take your profit after a reasonable amount of time decay. Be glad
if you double your money.
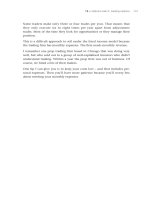
The expiry profit/loss is shown in Table 13.1
Table 13.1 Marks and Spencer long April 340–350–360 call
butterfly
M&S
330.00 340.00 341.25 350.00 358.75 360.00 370.00
Spread debit
–1.25
Value of long
340–350 call
spread at expiry
0.00 0.00 1.25 10.00 10.00 10.00 10.00
Value of short
350–360 call
spread at expiry
0.00 0.00 0.00 0.00 –8.75 –10.00 –10.00
Profit/loss
–1.25 –1.25 0 8.75 0 –1.25 – 1.25
The graph of the expiry profit/loss is as shown in Figure 13.1.
1
8.75/1.25 = 7/1, and flip it over.
350
0
5
10
–5
330
340 360 370
Figure 13.1
Expiration profit/loss relating to Table 13.1
13
Butterflies and condors: combining call spreads and put spreads 135
*Long at-the-money put butterfly
For stationary markets
The long at-the-money put butterfly has the identical profit/loss charac-
terisitics of a long at-the-money call butterfly. (This fortunate occurrence
has brought relief to many options trainers.) If both spreads are at-the-
money, their cost is nearly the same. The same strikes are used, but with
puts instead of calls. For example, if XYZ is at 100, you could buy one 105
put, sell two 100 puts, and buy one 95 put to create the butterfly. You can
think of this spread as a long in-the-money put spread at the 105 and 100
strikes, plus a short at-the-money put spread at the 100 and 95 strikes.
At expiration the maximum profit occurs if the underlying closes at the
middle strike. The maximum loss is the cost of the spread.
With the above Marks and Spencer options, you could pay 16.25 for the
April 360 put, sell two April 350 puts at 10.75, and pay 6.25 for the April
340 put order to go long the April 340–350–360 put butterfly. Your total
debit is 1.00,
2
and this is your maximum potential loss.
At expiration, the upside break-even level is the highest strike minus the
cost of the butterfly, or 360 – 1 = 359. The downside break-even level is
the lowest strike plus the cost of the butterfly, or 340 + 1 = 341. Note that
the profit range is 359 – 341 = 18.
The maximum profit is the difference between the two higher strikes
minus the cost of the spread, or (360 – 350) – 1 = 9 The expiration profit/
loss is summarised as follows:
Debit from one long April 360 put: –16.25
Debit from one long April 340 put: –6.25
Credit from two short April 350 puts: 2 × 10.75 = 21.50
–––––
Total debit: –1.00
Maximum profit: difference between two higher strikes minus spread
debit: (360 – 350) – 1 = 9
Level of maximum profit: middle strike: 350
Upside break-even level: highest strike minus cost of spread: 360 – 1 = 359
Downside break-even level: lowest strike plus cost of spread: 340 + 1 = 341
Maximum loss: cost of spread: 1
2
Bear in mind that the prices in Table 13.1 above are settlements, and settlement prices
can occur on or between the bid and the offer. You would expect to pay less for an ATM
put fly that is further from the money than the ATM call fly.
136 Part 2
Options spreads
The risk/return ratio of this spread is maximum loss ÷ maximum profit, or
1/9. In tabular form the expiry profit/loss is summarised in Table 13.2.
Table 13.2 Marks and Spencer 340–350–360 long put butterfly
M&S
330 340 341 350 359 360 370
Spread debit
–1
Value of long
360–350 put
spread at expiry
10 10 10 10 1 0 0
Value of short
350–340 put
spread at expiry
–10 –10 –9 0 0 0 0
Profit/loss
–1 –1 0 9 0 –1 –1
The graph of the expiration profit/loss (see Figure 13.2) is almost identical
to the one shown in Figure 13.1 for the call butterfly.
Short at-the-money call and put butterflies
For volatile markets
For each spread traded there are two opposing outlooks. Intsead of buying
an at-the-money butterfly in order to profit from a stationary market, a
trader may sell the same butterfly because his outlook calls for the under-
lying to be outside the spread’s range at expiration. This is usually not
done by investors because the risk/return ratios are unfavourable.
350
4
6
8
10
2
0
–2
330 340 360 370
Figure 13.2
Expiration profit/loss relating to Table 13.2
13
Butterflies and condors: combining call spreads and put spreads 137
For example, instead of buying, you could sell the above put butterfly at 1.
This is your maximum profit at expiry if the stock closes at or below 340,
or at or above 360. Practically spreaking, this 1p income is small, but in
a volatile market so is the risk of the stock expiring within the butterfly’s
range. Your position would be short one April 340 call, long two April 350
calls, and short one April 360 call. Your risk is 9p, however, if the shares
settle at 350 at the options’ expiry.
Figure 13.3 below illustrates the risk/return profile.
You can see why only a market-maker will sell you this butterfly, so don’t
begrudge him one tick while he risks nine.
*Long out-of-the-money call butterfly
For upside direction followed by stationary market
A butterfly can be used with a directional outlook. Suppose you think that
a stock has recently become oversold because of an unfavourable analyst’s
report, or because of less than expected earnings.
You know, however, the stock is fundamentally
sound, and it will most likely rally back to its
former level. In order to profit from your outlook,
you could buy an out-of-the-money call butterfly. This spread costs less
than an at-the-money butterfly, and its price will increase as the stock
enters its range. All the better if the rally is slow and time consuming,
because the butterfly, when it finally becomes at-the-money, will be worth
more through time decay.
350
–4
–2
0
2
–6
–8
–10
330
340 360 370
Figure 13.3
The risk/return profile
A butterfly can be
used with a directional
outlook
138 Part 2
Options spreads
For example, if you expect Marks and Spencer to increase from its current
price of 350.60 into the 360 range, you could pay 1 for the April 350–360–
370 call butterfly. You do this by paying 11.25 for one 350 call, selling
two 360 calls at 7, and paying 3.75 for one 370 call.
3
If the shares increase
to 360 in 40 days’ time your butterfly will be worth 3.25. You know this
because the current March at-the-money butterfly, the 340–350–360, with
10 days to go, is worth 3.25. If the shares then settle into a range cen-
tred on 360, you have a profitable and low-risk options position. You may
decide to take your profit at this point.
The expiration profit/loss for this butterfly is as follows.
Debit from one long April 350 call: –11.25
Debit from one April 370 call: –3.75
Credit from two short April 360 calls: 2 × 7 = 14.00
–––––
Total debit: –1.00
Maximum profit: difference between two lower strikes minus spread
debit: (360–350) –1 = 9
Level of maximum profit: middle strike of spread: 360
Lower break-even level: lowest strike price plus spread debit: 350 + 1 = 351
Upper break-even level: highest strike price minus spread debit:
370 – 1 = 369
Profit range: 369 – 351 = 18
Maximum loss: cost of spread: 1
The risk/return ratio is 1/9.
Through knowing the basics of butterflies, the table and graph of the
profit/loss at expiration can be constructed.
*Long out-of-the-money put butterfly
For downside direction followed by stationary market
Just as the long out-of-the-money call butterfly can profit from oversold
conditions, the long out-of-the-money put butterfly can profit from over-
bought conditions. This situation often occurs in commodities, but it is
common to all markets, especially bear markets.
3
These prices are realistic.
13
Butterflies and condors: combining call spreads and put spreads 139
For example, if you expect Marks and Spencer to retrace to 330, you could
pay 0.75 for the April 320–330–340 put butterfly. You do this by paying
6.25 for the 340 put, selling two 30 puts at 3.75, and paying 2.00 for one
320 put. If the shares eventually settle into a range centred at 330, then
you have a low-risk profit opportunity. The expiry profit/loss is summa-
rised as follows.
Debit from one April 340 put: –6.25
Debit from one April 320 put: –2.00
Credit from two April 330 puts: 2 × 3.75 = 7.50
–––––
Total debit: –0.75
Maximum profit: difference between two higher strikes minus spread
debit: (340 – 330) – 0.75 = 9.25
Level of maximum profit: middle strike: 330
Upper break-even level: highest strike minus spread debit:
340 – 0.75 = 339.25
Lower break-even level: lowest strike plus spread debit:
320 + 0.75 = 320.75
Profit range: 339.25 – 320.75 = 18.5
Maximum loss: cost of spread: 0.75
The risk/return ratio of this butterfly is 0.75/9.25 = 0.08 at risk for each
potential profit of 1. (1/0.08 = 12.5, or 1 at risk for a return of 12.5). Again,
note the excellent risk/return ratios for this group of spreads.
A story about OTM flies
One of out clients was head of fixed income at a London major. He was a
very astute trader, having traded successfully over the years.
On this occasion, he thought that the Euribor was due for a rally during
the next few weeks, and then to range at a higher level. He bought an
OTM call fly before travelling to a meeting in Tokyo.
While he was on the plane, the market suddenly rallied, and he doubled
his money. As usual, he was right.
But when he arrived in Tokyo he unfortunately decided to hold his fly in
the hope of getting time decay through a stationary market. After all, his
view called for the Euribor to range. To be fair, his trading sense was prob-
ably distracted by his admin duties.
140 Part 2
Options spreads
The question for the trader was, had the market made its move to a new
level earlier than expected, or had the market simply made a temporary
upward spike? Either way, he knew that with the butterfly his maximum
risk was his outlay.
When back in London, he found that new information had hit the
market, and it retraced to its former level. He was back to break-even.
Wisely, he sold his fly without a loss.
I have made this mistake many times in my career, and the lesson is: take
a gift.
Additional risks with the butterfly
There are other risks with the butterfly. The first is pin risk, which is
unlikely, but possible. The two short strikes may expire at-the-money. It is
best to close the butterfly several days before expiration. You may refer to
the section on pin risk in Part 1.
Another risk is that of early exercise with American-style options such
as the OEX, and most options on individual stocks in the US and UK. If
your short strike becomes deep in-the-money close to expiration, you may
be assigned to cash in the indexes, therefore leaving your long options
unhedged. With a long call butterfly in stocks, you may be assigned an
unwanted short stock position, and with a long put butterfly in stocks,
you may be assigned an unwanted long stock position. In all these cases, if
your butterfly becomes deep in-the-money close to expiration, it will have
lost its value, and you should close the position.
If you hold the long butterfly until expiration there are two additional risks.
For a call butterfly, if the underlying settles between the two higher strikes,
then you will be assigned one more short underlying contract than the one
to which you will exercise. Most likely you will not want this position.
Second, if the underlying settles between the two lower strikes, then you
or your clearing firm will exercise to one long underlying contract, which
you may not want.
For the long put butterfly, if the underlying settles between the two lower
strikes, then you will be assigned one more long underlying contract than
the one to which you will exercise. If the underlying settles between the
two higher strikes, then you or your clearing firm will exercise one short
underlying contract.
13
Butterflies and condors: combining call spreads and put spreads 141
There is an additional risk in that the deep in-the-money puts on stocks
and American-style stock indexes generally have more early exercise pre-
miums, and are more frequently subject to early exercise and assignment.
Perhaps for this reason the at-the-money call butterfly is more often traded
than the put butterfly, especially in stocks.
The most prudent way to avoid these risks is to close your butterfly posi-
tion if it becomes deeply in-the-money, or close it several days before
expiration.
*Long out-of-the money call condor
For upside direction followed by stationary market
If the expected upside range of an underlying is too difficult to assess for
the use of an out-of-the-money call butterfly, then you can increase the
range of the spread by shifting the short call spread to the next two higher
strikes that are out of the money. This creates a long out-of-the-money
call condor. For example, if XYZ is at 100 you could buy one 105 call, sell
one 110 call, sell one 115 call, and buy one 120 call. While the maximum
profit is the same as with the butterfly, the profit range is extended by five
points. This spread costs more, but it has an increased probability of profit.
It is similar to the long call ladder or Christmas tree, but it has the protec-
tion of the extra long call at the highest strike.
For example, in Marks and Spencer options you could pay 11.25 for one
350 call, sell one 360 call at 6.75, sell one 370 call at 3.75, and pay 2.00 for
one 380 call. Your debit is 2.75. Here, the maximum profit is taken if the
shares are between 360 and 370 at expiry. The break-even levels are 352.75
and 377.25. The profit/loss calculations are practically the same as with
the call butterfly. The expiration profit/loss for this condor is summarised
as follows:
Debit from one long April 350 call: –11.25
Debit from one long April 380 call: –2.00
Credit from one short April 360 call: 6.75
Credit from one short April 370 call: 3.75
–––––
Total debit: 2.75
Maximum profit: difference between lowest two strikes minus spread
debit: (360 – 350) – 2.75 = 7.25
Lower break-even level: lowest strike plus spread debit:
350 + 2.75 = 352.75
142 Part 2
Options spreads
Upper break-even level: highest strike minus spread debit:
380 – 2.75 = 377.25
Profit range: 377.25 – 352.75 = 24.50
Maximum loss: cost of spread: 2.75
The risk/return ratio of this long call iron butterfly is 2.75/7.25 = 0.38 at
risk for each potential profit of 1. A table of the profit/loss at expiration is
shown in Table 13.4.
Table 13.4 Marks and Spencer long April 350–360–370–380 call
condor
M&S
340.00 350.00 352.75 360.00 370.00 377.25 380.00 390.00
Spread debit
–2.75
Value of long
350–360 call
spread at
expiry
0.00 0.00 2.75 10.00 10.00 10.00 10.00 10.00
Value
of short
370–380 call
spread at
expiry
0.00 0.00 0.00 0.00 –0.00 –7.25 –10.00 –10.00
Profit/loss
–2.75 –2.75 0.00 7.25 7.25 –0.00 –2.75 –2.75
A profit/loss graph of this condor at expiration appears in Figure 13.4.
360
2
4
6
8
0
–2
–4
340
350 370 380 390
Figure 13.4
Expiration profit/loss relating to Table 13.4
13
Butterflies and condors: combining call spreads and put spreads 143
*Long at-the-money call condor
For stationary markets
Like the butterfly, the call condor can be placed at
many different strikes, depending on your outlook
for the price range of the underlying. If you think
that the underlying has made its move for the near
future, then you might trade the at-the-money call
condor. For example, if XYZ is at 100, you could
buy one 95 call, sell one 100 call, sell one 105 call,
and buy one 110 call. This spread costs more than the at-the-money but-
terfly, and consequently its maximum profit is less than the at-the-money
butterfly, but its profit range is greater.
Using our now familiar set of Marks and Spencer April options, you could
pay 17 for one 340 call, sell one 350 call at 11.25, sell one 360 call at 6.75,
and pay 4.00 for one 370 call. Your net debit is 3.00. The expiration profit/
loss is summarised as follows:
Debit from one April 340 call: –17.00
Debit from one April 370 call: –4.00
Credit from one April 350 call: 11.25
Credit from one April 360 call: 6.75
–––––
Total debit: –3.00
Maximum profit: difference between two lowest strikes minus spread
debit: (350 – 340) – 3.00 = 7.00
Range of maximum profit: 350 – 360
Lower break-even level: lowest strike plus spread debit:
340 + 3.00 = 343.00
Upper break-even level: highest strike minus spread debit:
370 – 3.00 = 367.00
Profit range: 367.00 – 343.00
Maximum loss: cost of spread: 3.00
The risk/return ratio for this spread is 3/7 = 0.43 for 1, or 1/2.64. By know-
ing how the condor works, you can devise a table and a graph of the
profit/loss at expiry.
The call condor can be
placed at many different
strikes, depending on
your outlook for the
price range of
the underlying
144 Part 2
Options spreads
*Long out-of-the-money put condor
For downside direction followed by stationary market
If the profit range of an out-of-the-money put butterfly is too limited, it
can be extended by shifting the short put spread to the next two lower
strikes. If XYZ is at 100, you could buy one 100 put, sell one 95 put, sell
one 90 put, and buy one 85 put. The resulting spread is the long out-of-
the-money put condor. This spread costs more than the butterfly and its
maximum profit is consequently less, but its profit range is greater. It is
similar to the long put ladder or long put Christmas tree, but it has the
protection of the long put at the lowest strike.
For example, in Marks and Spencer April options you could pay 10.25 for
one 350 put, sell one 340 put at 6.25, sell one 330 put at 3.75, and pay
2.00 for one 320 put. Your total debit is 2.25.
The expiration profit/loss for this put condor is summarised as follows.
Debit from long April 350 put: –10.25
Debit from long April 320 put: –2.00
Credit from short April 340 put: 6.25
Credit from short April 330 put: 3.75
–––––
Total debit: –2.25
Maximum profit: difference between highest two strikes minus spread
debit: (350 – 340) – 2.25 = 7.75
Range of maximum profit: 340 – 330
Upper break-even level: highest strike minus spread debit:
350 – 2.25 = 347.75
Lower break-even level: lowest strike plus spread debit:
320 + 2.25 = 322.25
Profit range: 347.75 – 322.25 = 25.50
Maximum loss: cost of spread: 2.25
The risk/return ratio is again favourable at 2.25/7.75 = 0.29 for 1, or
1/3.44. The profit/loss at expiration is shown in Table 13.5.
The graph of the profit/loss at expiration is shown in Figure 13.5.