Báo cáo toán học: " Two-stage source tracking method using a multiple linear regression model in the expanded phase domain" pdf
Bạn đang xem bản rút gọn của tài liệu. Xem và tải ngay bản đầy đủ của tài liệu tại đây (1.01 MB, 19 trang )
RESEARCH Open Access
Two-stage source tracking method using a
multiple linear regression model in the expanded
phase domain
Jae-Mo Yang
*
and Hong-Goo Kang
Abstract
This article proposes an efficient two-channel time delay estimation method for tracking a moving speaker in noisy
and re-verberant environment. Unlike conventional linear regression model-based methods, the proposed multiple
linear regression model designed in the expanded phase domain shows high estimation accuracy in adverse
condition because its the Gaussian assumption on phase distribution is valid. Therefore, the least-square-based
time delay estimator using the proposed multiple linear regression model becomes an ideal estimator that does
not require a complicated phase unwrapping process. In addition, the proposed method is extended to the two-
stage recursive estimation approach, which can be used for a moving source tracking scenario. The performance of
the proposed method is compared with that of conven tional cross-correlation and linear regression-based
methods in noisy and reverberant environment. Experimental results verify that the proposed algorithm
significantly decreases estimatio n anomalies and improves the accuracy of time delay estimation. Finally, the
tracking performance of the proposed method to both slow and fast moving speakers is confirmed in adverse
environment.
Keywords: source tracking, time delay estimation, inter-channel phase difference, multiple linear regression, phase
expansion
1. Introduction
Time delay estimation (TDE) plays key role in determin-
ing the steering capability of microphone array system
which produces a direction of the target sound source
required for performing spatial processing. Typical
applications of microphone array system include tele-
conferencing, automatic speech recognition, speech
enhancement, source separati on and automatic auditory
system for robots [1-6].
The problem of estimating relative time delay asso-
ciated with a signal source and a pair of spatially sepa-
rated microphones has been extensively studied [7-15].
Among TDE methods, the generalized cross-correlation
(GCC) method is one of the most widely used because
of its simplicity and acceptable performance [7-9]. In
the GCC-based method, the time delay is calculated by
find ing a lag that maximizes the GCC function between
acquired signals. The method has been enhanced by
introducing a pre-filter or a weighting function such as
maximum-likelihood (ML), phase transform (PHAT)
andsoon.TheGCC-MLmethodderivedfromthe
assumption of the ideal single propagation situation is
optimal in a statistical point of view in case the observed
sample space is large enough. The GCC-PHAT is recog-
nized as reasonably robust to reverberation though it is
heuristically designed. Zhang et al. [16] verified that the
GCC-PHAT could actually be derived from the ML-
based algorithm in reverberant environment if noise
level is low. Another technique relied on the identifica-
tion of the minimum of the average magnitude differ-
ence function (AMDF) between two signals, which was
recently modified b y joint consideration of the AMDF
and the average magnitude sum function (AMSF) to
improve the performance in reverberant environment
[13].
An adaptive filter-based algorithm utilizes the criterion
of minimizing the mean-square error b etween the first
* Correspondence:
DSP Laboratory, Department of Electrical and Electronic Engineering, Yonsei
University, Korea
Yang and Kang EURASIP Journal on Advances in Signal Processing 2012, 2012:5
/>© 2012 Yang and Kang; licensee Spr inger. This is an Open Access article distributed under the te rms of the Creative Comm ons
Attribution License ( which permits unrestricted use, distribution, and reproduction in
any medium, provided the original work is properly cited.
channel signal and the filtered second channel signal to
estimate relative time delay [17]. In [18], an adaptive
eigenvalue decomposition algorithm was proposed to
improve TDE performance in reverberant environment.
It first identified the room impulse response (RIR) of
each channel, and then the delay was determined by
find ing the direct paths from the two measured RIRs. A
systematic overview of the stat-of-the-art of TDE techni-
ques was summarized in the recent literature [14].
The TDE method using the inter-channel phase differ-
ence (IPD) has been attracted a lot since 1980s, thanks
to its advantage on obtaining the result instantaneously
[19-23]. Chan et al. [19] verified that a least-square (LS)
estimator to the phase slope of cross power spectrum
was equivalent to the ML estimator. They also proved
that the distribution of IPD error followed Gaussian
probability density function (pdf) if the signal and noise
were zero mean Gaussian processes and uncorrelated
each other. By raising the coherence issue between dual-
microphone noises, Piersol provided the relationship
between spatial coherence function and phase bias at
specific frequency. Brandstein et al. [20] proposed a gen-
eralized cost function of the linear regression model of
IPD by adopting a bi-weight function [23]. The method
is particularly advantageous in reverberant environment,
but there is no benefit in noisy environment. The per-
formance of these approaches commonly degrades when
phase wrapping occurs or the phase is corrupted by
adverse environmental effects because the phase statis-
tics cannot be modeled by a simple pdf. Since it i s hard
to find a n ideal estimator for a non-Gaussian data set
such as wrapped discrete phases, a phase unwrapping
process needs to be included in the TDE method
[22,24,25]. Tribolet [24] proposed an iterative phase
unwrapping algorithm that adaptively integrated the
derivative of the phase. Brandstein et al. [22] practically
implemented a linear regression slope forced unwrap-
ping method which recursively adjusted the estimated
wrapping frequency using lower band phase observa-
tions. Since these methods commonly include heuristic
parts, their performance vary depending on how they
are impleme nted. Recently, recursi ve unwrapping meth-
ods such as maximizing a posteriori probability or
adopting the expectation-maximizatio n (EM) using the
probability model of the observed phase data set are
introduced [26,27]. In those methods, a reliable phase
unwrapping can be achieved at the expense of heavy
computational burden.
This articl e proposes a multiple linear regression
model-based instantaneous TDE method that uses the
expanded IPD of two channel signals. An estimator
designed for operating in the original phase domain, [-π
~+π), can hardly be optimal because a phase can be
wrapped corresponding to the inter-channel distance
and the direct ion of arrival (DOA) angle. To solve the
problem, a reasonable statistical model for the distribu-
tion of IPD e rror and its Gaussian approximation are
presented. At first, a phase domain expansion method
using frequency interpolation and phase shifting metho-
dology is proposed. Conventional linear regression
model of IPD can be considered as a multiple linear
regression model in the proposed phase expansion fra-
mework. By applying the proposed method to TDE, an
ambiguous factor due to phase wrapping is dismissed
and the LS method results in an optimal estimator. This
article also verifies that the proposed estimation method
becomes a minimum variance estimator (MVE) in the
expanded phase domain. The p ropo sed TDE method is
comp osed of two stage s: an LS-based TDE method esti-
mates an initial delay at the first stage, and the esti-
mated delay is applied to the sequential recursive-LS
(RLS) estimator. The pro posed method is computation-
ally simple since it does not need a minimum or maxi-
mum search stage as well as the phase unwrapping
process. The proposed algorithm is fairly compared with
the optimal GCC methods, a generalized linear regres-
sion estimator, and an AMDF method in noisy and
reverberant environment. The performance of the candi-
date estimators is evaluated by detailed assessment items
including the percentage of anomalies, the estimation
bias for both low and high DOA angles, and the root-
mean-squared error (RMSE). Experimental results show
that the proposed method can be regarded as the most
robust estimator for the outliers and is closer to the
unbiased estimator than any other methods. Especially
in the RMSE assessment, the proposed RLS-TDE shows
the best performance in both noisy and reverberant
environment. Finally, the superiority of the tracking per-
formance of the proposed algorithm is verified to a
moving source in low SNR conditions.
The contents of the article are divided into four parts.
Conventional two-channel TDE is explained in Secti on
2. Section 3 describes the details o f the proposed phase
expansion method with a multiple linear regression
model. The proposed two-step T DE method for a mov-
ing speaker is described in Section 4. Finally, various
experimental results are given in Section 5.
2. Conventional TDE method
2.1. Input signal model
Assuming that signals radiatedbyasinglesource,s(t),
impinge on two channel microphones, each received sig-
nal can be represented by the following frequency
domain formula [16,23]:
X
i
(
ω
)
= S
(
ω
)
H
i
(
ω
)
+ N
i
(
ω
)
, i =1,2
,
(1)
Yang and Kang EURASIP Journal on Advances in Signal Processing 2012, 2012:5
/>Page 2 of 19
where N
i
(ω)isthenoisesensedbytheith micro-
phone, and H
i
(ω) is the transfer function between
source and ith microphone. H
i
(ω)canbemodeledas
[28,29]
H
1
(ω)=α
0
+
∞
k=1
α
k
e
−jωτ
a,k
,
H
2
(ω)=β
0
e
−jωτ
θ
+
∞
k
=1
β
k
e
−jωτ
β,k
,
(2)
where a
k
and b
k
are attenuation factors normally less
than one, τ
θ
is the time difference o f arrival (TDOA)
between two input signals, and τ
a,k
, τ
b,k
are time delays
caused by reverberation. The first term in each of Equa-
tion 2 is a direct component from source to microphone
while the second term is a reverberant component
related to RIR. In a far-field source scenario assumption,
the propagation time difference of two microphones
relating to the direction θ is defined as τ
θ
= d sin(θ)/c,
where d is a distance betw een two microphones and c is
the sound veloci ty in the air. This article initially
assumes the single path signal model that considers only
the direct path signal and the additive noise term in
Equation 1, and then it is extended to the multi-path
environment case later.
2.2. Linear regression model-based TDE
The IPD between two channel signals is computed by
subtracting phase terms, ∠X
1
(ω)-∠X
2
(ω), where ∠X
1
(ω)
and ∠X
2
(ω) are phases of input signals, respectively.
Practically, the IPD can be calculated by investigating
the phase of cross spectrum,
(X
1
(ω) X
∗
2
(ω)
)
, or the ima-
ginary part of log-spectral distance, Im {lnX
1
(ω)-lnX
2
(ω )}, between two channel signals. Then, the IPD, ξ(ω),
can be expressed as
ξ
(
ω
)
= ωτ
θ
+2πm + ν
(
ω
),
(3)
where m is an integer number and 2πm represents a
phase wrapping factor which constrains a phase range
[-π ~+π). ν(ω) denotes the IPD error caused by N
i
(ω),
H
i
(ω), and ignorable minor impact due to using a finite
length of DFT, etc. In Equation 3, the TDE is now refor-
mulated in terms of a linear regression problem in that
thetimedelayisfoundbyfittingalinetotheobserved
IPD. Without considering the wrapping factor, a
weighted LS method has been widely used as a regression
cost function. Thus, the final TDE is given as follows:
ˆτ = arg min
τ
k
ψ(ω
k
)|ω
k
τ − ξ(ω
k
)|
2
=
k
ψ(ω
k
)ω
2
k
−1
k
ψ(ω
k
)ξ(ω
k
)ω
k
,
(4)
where k =0,1, ,K - 1 is dis crete frequency indices,
ω
k
=
2πk
K
and ψ(ω
k
) is a weight to normalize the distur-
bances. Equation 4 becomes the best linear unbiased
estimator (BLUE) when ψ(ω
k
) equals to the reciprocal of
IPD error variance. Moreover, it becomes an MVU esti-
mator if the pdf of IPD error, ν(ω), follows Gaussian dis-
tribution [30]. The performance of the above LS-TDE
for an acoustic signal is statistically analyzed in previous
articles under the Gaussian assumption of IPD error dis-
tribution [19,20]. If phase wrapping is considered, how-
ever, the distribution of ν(ω) does not follow Gaussian
anymore unless an ideal phase unwrapping is performed
as a pre-processing step. Generally, it is not an easy task
to find wrapped frequencies and unwrapped phase
values in noisy environment. In addition, the unwrap-
ping process for the IPD requires time delay information
before perfo rming the TDE processing. In the next sec-
tion, a novel pdf model of IPD error distribution under
a noisy condition is introduced. A phase expansion
method with a multiple linear regression model i s also
proposed, which i s more efficient and gene rally applic-
able to IPD-based methodologies but does not require
any complicated phase wrapping process.
3. Multiple linear regression model in the
expanded phase domain
3.1. Generalized IPD distribution: sum of shifted gaussian
pdfs
Without loss of generality, the multi-path effect caused
by reverberation is ignored at fir st. Then, ν(ω)inEqua-
tion 3 can be considered as a random variable related to
the phase deviations caused by N
1
(ω)andN
2
(ω). If we
assume that S(ω)=0,andN
1
( ω)andN
2
( ω)areinde-
pendent zero mean Gaussian random variables, ν (ω)fol-
lows uniform distribution with
π
2
3
variance in [-π ~+
π) range [19]. On the other hand, when the signal
power is relatively larger than the noise one, the pdf of
ν(ω) can be approximated by zero mean Gaussian,
whose variance is represented by signal power and mag-
nitude coherenc e function (MSC) [19,26,31]. These
properties are useful to estimate a time delay that uses
the IPD of two channel signals.
In this article, we modify the approximated Gaussian
IPD error model u sing an SN R parameter. T hough the
idea was initially proposed by Said et al. [31], the y only
assumed a case when the signal was incident from the
zero direction, so that there was no need to consider
the phase wrapping effects. Figure 1a shows a complex
diagram of IPD error model to generalize the conven-
tional model to all possible DOA angle range. In the fig-
ure, e
jj
is regarded as a normalized cross spectrum of
two channel source signal with unit power and phase j,
Yang and Kang EURASIP Journal on Advances in Signal Processing 2012, 2012:5
/>Page 3 of 19
and N
j
(ω )isthatofnoise.Notethattherealandima-
ginary components of N
j
( ω) are assumed a s indepen-
dent Gaussian random variables. The inner circle in
Figure 1a represents the maximum range of erroneous
phase distribution caused by N
j
(ω).TheSNRofcross
spectrum becomes (2g
2
)
-1
if the variances of real and
imaginary parts of the noise are g
2
, respectively. There-
fore, the outer circle in the figure shows the maximum
phase distribution when signal power is same as noise
power. In this 0 dB SNR case, the absolute phase error
Im
SNR 0dB
Re
()
j
e
φ
ω
() ()
j
eN
φ
φ
ωω
+
r
1
φ
ζ
Re
0.07
0.08
2
π
shift Gaussians
sum of shifted Gaussians
IPD pdf -
π
~+
π
(a)
0.04
0.05
0.06
SNR 0dB
0
0.01
0.02
0.03
-2pi -pi 0 +pi +2pi
0
phase [rad]
φ
(
b
)
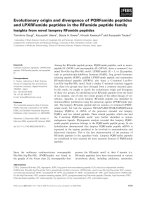
Figure 1 Gaussian assumption of IPD error model for DOA angle, j, caused by uncorrelated noises and the actual IPD distribution in
[-π ~+π): (a) complex diagram of IPD error model, (b) probability density function of IPD based on the sum of shifted Gaussian pdfs.
Yang and Kang EURASIP Journal on Advances in Signal Processing 2012, 2012:5
/>Page 4 of 19
is limited to a value of smaller than
π
4
and it is pre-
sented in Figure 1b. The limited phase interval in Figure
1b is larger than +π; however, it is not a problem in the
proposed expanded phase domain (it will be described
in next subsection).
From Figure 1a, the pdf of IPD error for the true
phase j with the phase error ζ (omitting ω for simpli-
city) can be computed by following integral function:
p
φ,ζ ,γ
=
∞
0
r
2π
γ
2
e
(r cos(φ + ζ ) −cos φ)
2
+(r sin(φ + ζ ) − sin φ)
2
−2γ
2
dr
,
(5)
which equals to (Appendix A)
p
φ,ζ ,γ
=
1
2π
e
−
1
2γ
2
+
⎛
⎜
⎜
⎝
1
2πγ
2
e
sin
2
ζ
−2γ
2
⎞
⎟
⎟
⎠
Q
cos ζ
−γ
cos ζ
,
(6)
where Q-function is defined as
Q(x)=(2π )
−1/2
∞
x
e
−t
2
/2
d
t
. Equation 6 is composed of
three components, additive positive constant, approxi-
mation of Gaussian pdf, and cosine multiplied Q-func-
tion terms. Finally, the IPD distribution for an arbitrary
phase j is expressed in the same way to the Said’ s
method which forms a symmetric distribution focusing
on j [31]. It is increasingly flattened for higher level
noise because the f irst term in Equation 6 becomes a
principle factor, i.e. reducing the del ay information con-
tained in the I PD. However, if we assume that the SNR
of cross spectrum is hi gh (g
2
≪ 1) then majority of IPD
error is c oncentrated on zero. In this assumption, the
first term of Equation 6 can be disregarded and the
approximations for sinusoidal function in the second
term, sin(x) ≈ x and cos(x) ≈ 1, would be valid. There-
fore, Equation 6 can be simplified as follows:
p
φ,ζ ,γ
≈
1
2πγ
2
exp
ζ
2
−2γ
2
, γ
2
1
.
(7)
Equation 7 denote s Gaussian pdf with a variance of g
2
which is related to the inverse of the SNR. Figure 2
depicts the comparison of the original pdf given in
Equation 6 and its Gaussian approximation in Equation
7 in relatively l ow and high SNR conditions. The
approximated IPD distribution depicted as the solid line
is flatter than original IPD distributi on due to the influ-
ence of the additive term and Q-function in -5 dB SNR.
It is clear that the approximated pdf given in Equation 7
is getting closer to the original IPD distribution as the
SNR increases. The actual IPD, however, is not normally
distri buted when there exists phase wrapping. As shown
in Figure 1b, as j closes to +π (or -π), it is likely that
phase wrapping occurs. The solid line in Figure 1b is
actual IPD distribution w hen phase wrapping occurs,
whichisobtainedbytheinfinitesumof2π shifted
Gaussian pdfs of Equation 7 (circle markers) in -π to +π
range. It is clear that the IPD distribution for the
wrapped phase is non-symmetric and dense at erro-
neous arbitrary phase. Consequently, the actual shape of
p
j,ζ,g
cannot be regarded as Gaussian and completely
depends on the actual phase at each frequency. In the
following subsection, we derive a linearly interpolated
phase expansion method to cope with the problem
caused by the non-Gaussian IPD distribution. The IPD
distribution in the expanded phase domain is shown as
the dash-dotted line in Figure 1b.
3.2. Multiple linear regression model in the expanded
phase domain
If phase wrapping occurs the Gaussian assumption
becomes invalid thus a delay estimator which does not
include a maximum searching process easily fails. Con-
ventional linear regression model basically assumes that
the phase is linear and always starts from zero at zero
frequency. However , phase wrapping results in disconti-
nuity due to the shifting phase term, ±2π given in Equa-
tion 3. The purpose of phase expansion proposed in this
article is recovering linear parallel lines by shifting origi-
nal phase terms and copying it to the interpolated fre-
quency domain which is defined as the multiple linear
regression model. Figure 3 depicts an example of phase
expansion under the assumption that there exists at
most one phase wrapping. It is a reas onable assumption
because the second wrapping is hardly occurred in the
tested speech signal band unless we use a very large
microphone array, e.g., the second wrapping can be
occurred at higher than 5.1 kHz when dual-microphone
space is 0.1 m.
Details of phase expansion stage are represented in
Figure 4, where k and/are original and interpolated fre-
quency indices and ξ
E
(ω
l
) is t he expanded discrete
phase after applying the proposed interpolation process.
First, the original phase is copied to 4-times of interpo-
lated frequency, ω
4k
. Then, it copies the +2π shifted
interpolated phase to ω
4k+1
and repeats it for -2π shift-
ing to ω
4k+2
. Therefore, a linear phase line starting from
zero is recovered though there may exist two lines
which lie on either zero to wrapping frequency or wrap-
pingfrequencytoend.Tomakethesetwolineslinear
from zero to end, +4π (or -4π) shifting and copying pro-
cess is needed only for the original phase which is smal-
ler (or larger) than zero. Finally, the system determines
a proper expanded domain which is shown as the widely
shaded area in Figure 3. As we can see in Figure 3, onl y
threepossiblemultiplelinearregressionmodelsare
needed to be considered in our phase expansion
method. The expanded phase is commonly distributed
in 6π range though the expanded domains, Ω
d
, d =-1,
Yang and Kang EURASIP Journal on Advances in Signal Processing 2012, 2012:5
/>Page 5 of 19
0, 1 are not identically distributed. Moreover, ther e
always exist ideal three linear parallel lines in Ω
d
that
make the LS-TDE derivation possible. The verification
process will be followed in next section.
4. A Framework of the proposed two-stage
method
The multiple linear regression model-based LS method
for IPD estimation is proposed in the expanded phase
domain, Ω
d
. The proposed metho d is composed of two
stages: the multiple linear regression model-based LS-
TDE at the first stage, and the RLS-based source track-
ing method using the delay information estimated at the
first stage. After constructing an LS cost function for
the TDE method based on the multiple linear regression
model, it is verified that the proposed LS metho d is an
ideal estimator which is unconstrained by phase wrap-
ping. In the second stage, the RLS-TDE m ethod is pro-
posed which works very well for both fixed and moving
source tracking. The proposed RLS method can be
impl ement ed by a simple equation, and it is also appro-
priate for conversational speech. Finally, a novel two-
channel weighting method for noisy and reverberant
environment is described.
4.1. First stage: multiple linear regression model-based
TDE
In Section 3.2, the multiple linear regression model
including three-linear lines in 6π interval is explained in
detail . The proposed LS criterion using the multiple lin-
ear regression model is given as
ˆτ
E,d
= arg min
τ
1
m=−1
l
|(ω
l
τ +2mπ − ξ
E,d
(ω
l
))|
2
,
(8)
where d = -1, 0, 1 is the expanded domain index, l =
0, 1, , 4K -1 is the interpolated frequency index, and
ξ
E,d
(ω
l
) Î Ω
d
is the expanded observation phase for
each case in Figure 3. Then, the LS solution is derived
by taking a derivative to the term τ as follows:
0=6
l
(ω
2
l
τ − ω
l
ξ
E,d
(ω
l
)) + 4π
1
m=−1
m
l
ω
l
.
(9)
The second term in Equation 9 corresponding to
phase shifting is equal to zero. There fore, the proposed
multiple linear regr ession model-based LS-TDE in the
expanded phase domain is equivalent to the conven-
tional LS equation given in Equation 4. Finally, the pro-
posed LS solution is easily calculated by adopting a
vector notation,
ˆτ
E,d
=
(
¯ω
H
¯ω
)
−1
¯ω
H
¯
ξ
E,
d
where
¯
ω
and
¯
ξ
E
,d
are L
d
× 1 vectors, L
d
is the number of discrete frequen-
cies sati sfying ξ
E,d
(ω
l
) Î Ω
d
. A weighted solution which
does not affect above derivation is given as
ˆτ
E,d
=
(
¯ω
H
¯ω
)
−1
¯ω
H
¯
ξ
E,d
,
(10)
where Ψ isadiagonalmatrixcomposedbyarecipro-
cal of IPD error vari ance related to the SNR of the
0.7
0.8
0.9
1
-5dB Eq.(6), original
-5dB Eq.(7), Gaussian
+5dB Eq.(6), original
+5dB Eq.(7), Gaussian
0.3
0.4
0.5
0.6
-pi -pi/2 0 +pi/2 +p
i
0
0.1
0.2
IPD error
[
rad
]
Figure 2 Comparison between original pdf (dotted-lines) and its Gaussian approximation (solid-lines) in high and low SNR conditions.
Yang and Kang EURASIP Journal on Advances in Signal Processing 2012, 2012:5
/>Page 6 of 19
input signal. The variance of IPD error at interpolated
frequencyissameasoriginalvariance.Theproposed
solution in the expanded phase domain, Equation 10, is
not only unconstrained by the phase wrapping but also
corresponding to the ideal LS solution of Equation 4.
Furthermore, Equation 10 becomes an MVU estimator
since the Gaussian assumption for the IPD error, Equa-
tion 7, is valid in the expanded phase domain. Finally,
the estimator determines the most accurate delay
among the estimated results in each expanded phase
domain by measuring Euclidean distance between the
estimated and the observed phases as follows:
ˆτ
LS
= arg min
d
l
(ω
l
ˆτ
E,d
− ξ
E,d
(ω
l
))
2
1/2
, d = −1, 0, 1
.
(11)
4.2. Second stage: RLS for moving speaker tracking
Generally, an LS-TDE in a single-frame-based process
easily confronts the lack of data problem because the
Figure 3 Three cases of the expanded phases: (a) no wrapping occurred case, (b) wrapped and positive slope case (c) wrapped and
negative slope case.
Yang and Kang EURASIP Journal on Advances in Signal Processing 2012, 2012:5
/>Page 7 of 19
frame length for analyzing speech signal is only 20-30
ms and the sampling frequency is limited to the capacity
of usual electronic devices. As the more data set is avail-
able, the performance of TDE becomes closer to the
ideal lower bound such as Cramer-Rao bound (CRB)
[30,32]. To use multiple frames for TDE, however, non-
stationarity of the speech signal and moving source case
should be considered. This article proposes an RLS-TDE
method which improves the performance of TDE by
considering an arbitrarily moving speaker. At first, the
LS-TDE result,
ˆτ
L
S
, of the first stage is used to select the
frequencies for the RLS processing as follows:
{ω
l
||ω
l
ˆτ
LS
− ξ
E
(
ω
l
)
| <π}, l =0,1, , L −1
.
(12)
Using the criterion given in Equation 12, the frequen-
cies whose phases within a 2π interval around a straight
line,
f
(
ω
l
)
= ω
l
ˆτ
L
S
, are selected as candidates for the sec-
ond stage. Three new vectors are defined to simplify the
equation such th at,
¯ω
r
(
n
)
is the frequency vector satisfy-
ing Equation 12 a t nth frame and
¯
ξ
r
(
n
)
,
r
(
n
)
are
related phase vector and diagonal matrix of weighting
vector, respectively. Then, the RLS criterion is given as
J
=
Q
q
=0
δ
q
1
m=−1
¯
A
T
(m, n − q)
r
(n − q)
¯
A(m, n − q)
,
(13)
where T means vector transpose, δ is a positive con-
stant less than one, Q is the maximum number of
observation frames. The criterion vector,
¯
A
(
m, n
)
,and
the arbitrary vector,
¯
I
, are defined as
¯
A
(
m, n
)
=
(
¯ω
r
(
n
)
+2πm
¯
I −
¯
ξ
r
(
n
))
,
¯
I =[1, ,1]
T
.
(14)
Finally, the RLS-TDE is represented by
ˆτ
RLS
(n)=
Q
q=0
δ
q
( ¯ω
T
r
(n −q)
r
(n −q)
¯
ξ
r
(n −q))
Q
q
=0
δ
q
( ¯ω
T
r
(n −q)
r
(n −q) ¯ω
r
(n −q))
.
(15)
Equation 15 is same as Equation 10 except the term δ
q
which exponentially decreases the contribution of the
past data set. In addition, a process is included such
that all of the RLS vectors are initialized when long
silence interval is included in the observation data.
Experimental results described in detail later confirm
• Original discrete phase
4
ilii li
2
( ) 0, , 1, .
kk
k
kK
K
π
ξω ω
=− =
•
4
-t
i
mes
li
near
i
nterpo
l
at
i
on :
for
4LK=
() ( ),
El k
ξ
ω
ξ
ω
=
4,lk=
() () 2,
El k
Kl
kL
ξ
ω
ξ
ωπ
=+
41,lk=+
() ( ) 2
Kl
ξω ξω
42
lk
0, , 1kK=−
if
else
d
() ( ) 2
,
El k
kL
ξω ξω
π
=−
42
,
lk
=+
()0
k
ξ
ω
>
() ( ) 4.
El k
Kl
kL
ξ
ω
ξ
ωπ
=−
43,lk=+
() ( ) 4.
El k
Kl
kL
ξ
ω
ξ
ωπ
=+
43,lk=+
en
d
end
Figure 4 Details of the proposed linearly interpolated phase expansion.
Yang and Kang EURASIP Journal on Advances in Signal Processing 2012, 2012:5
/>Page 8 of 19
that the performance of RLS-TDE is superior to conven-
tional methods even for the fast moving speech source.
4.3. Weighting for LS-TDE in noisy and reverberant
condition
In Section 3.1, it is shown that the IPD error distribu-
tion can be regarded as Gaussian with variance (2 ×
SNR)
-1
. Actually, this property is implied in the ML
TDE explained in the Knapp’s method [9] that the ML
weighting is derived from MSC. Note that MSC can be
regarded as an SNR of the input signal. In practice,
MSC must be estimated by the observed data set using
a temporal averaging method [33]. However, it is hard
to estimate accurate MSC for non-stationary data such
as speech signal. T he proposed method adopts an
approximated-ML weighting which is roughly equivalent
to the SNR evaluated from a single frame as follows
[12,22,23]:
ψ(ω
k
)=
|X
1
(ω
k
)||X
2
(ω
k
)|
|N
1
(
ω
k
)
|
2
|X
2
(
ω
k
)
|
2
+ |N
2
(
ω
k
)
|
2
|X
1
(
ω
k
)
|
2
.
(16)
The proposed LS-TDE in the expanded phase domain
given in Equation 10 with the weighting function above
satisfies all the ML estimation conditions, e.g., the Gaus-
sian assumption of IPD error and weighting of its var-
iance reciprocal. The weighting given in Equation 16 is
useful when the coherence between two noises of dual-
sensor and the target speech signal are ignor-able. How-
ever, it cannot distinguish values of speech from other
signals if we assume a reverberant environment. Piersol
[20] paid attention to the spatial coherence between
two-sensors and proved the effects to the TDE by lots
of experimental results, which are consistent with the
theoretical analysis. To design a practical two channel
system under the reverberant environment, a substituta-
ble method which can suppress the reverberation effect
by signal-to-reverberation (SRR)-based weighting is
introduced.
To estimate the power of the direct signal and re ver-
berant components, a two-channel generalized side-lobe
canceller (GSC) structure is adopted [34]. Figure 5
shows a simplified block diagram to estimate the direct
signal power. In this method, the power envelop of the
delay-and-sum beamformer (DSB) output, Q(ω,n), and
the delay-and-subtract output used for a reference sig-
nal, U(ω,n), are obta ined by using the first-orde r recur-
sive equations:
λ
q
(w, n)=ηλ
q
(ω, n −1) + (1 −η)|Q(ω, n)|
2
,
λ
u
(
ω, n
)
= ηλ
u
(
ω, n − 1
)
+
(
1 −η
)
|U
(
ω, n
)
|
2
,
(17)
where n is frame index and h is a forgetting factor set
close to, but less than, one. Then, the energy of
reverberant residual components,
ˆ
λ
r
(
ω, n
)
is obtained as
follows:
ˆ
λ
r
(
ω, n
)
= W
(
ω, n
)
λ
u
(
ω, n
),
(18)
where W(ω,n) is a frequency dependent gain that is
adaptively updated using a quadratic cost function, J
w
=
{l
e
(ω,n)}
2
,wheretheerror,l
e
(ω,n), is equal to
λ
q
(ω, n) −
ˆ
λ
r
(ω, n
)
. Finally, the direct signal power is
estimated using a spectral-subtraction method [35]:
|
ˆ
S
d
(
ω, n
)
|
2
= |Q
(
ω, n
)
|
2
−
ˆ
λ
r
(
ω, n
).
(19)
In Habets’s de-reverberation method [34], a post filter
is applied to the DSB output, Q(ω,d), however, the
spectral subtraction method, given in Equation 19, is
good enough in our application because only the power
envelop of the direct signal component is needed.
Finally, the SRR is represented as follows (omitting
frame index similar to Equation 16):
ψ(ω
k
)=
|
ˆ
S
d
(ω
k
)|
2
ˆ
λ
r
(
ω
k
)
.
(20)
The proposed method well suppresses the late rever-
beration but has no impact on the early reflected com-
ponent which is the princip le reason of bias for the IPD
dis tribution. The bias caused by early reflection entirely
depends on the physical conditions including the shape
of room, sensor and source position, etc. It is still a
challenging research area to deal with the early reflec-
tion blindly.
5. Experimental results
To verify the performance of the proposed algorithm,
the performance of the proposed algorithm (p1(LS), p2
(RLS)) is compared to th e widely attracted methods that
have reliab le performance in noi sy and reverberant
environment. First, GCC-based methods that are pre-
ferred in a p ractical system are considered. Generalized
GCC-TDE equation in frequency domain is as follows:
ˆτ
GCC
=argmax
τ
k
ψ
GCC
(ω
k
)G
X
1
X
2
(ω
k
)e
jω
k
τ
,
(21)
where
G
X
1
X
2
(ω
)
is the cross spectrum of two channel
signal,
X
1
(ω) X
∗
2
(ω
)
. The GCC-ML, ψ
ML
(ω
k
) given in
Equation 16, and the phase transform (PHAT),
ψ
PHAT
(ω
k
)=|X
1
(ω) X
∗
2
(ω) |
−
1
, are well-known estimators
used for noisy and reverberant environments,
respectively.
Second, tests include the bi-weight (BIWT) method
that are proposed to have robust performance especially
for the outliers caused by the reverberation [23].
Yang and Kang EURASIP Journal on Advances in Signal Processing 2012, 2012:5
/>Page 9 of 19
ˆτ
BIWT
= arg min
τ
k
ρ
ξ(ω
k
) −ω
k
τ
B(ω
k
)
,
(22)
where the bi-weighting function is given as
ρ(x)=
−(1 −x
2
)
3
/6, |x|≤1,
0, |x| > 1
.
(23)
The estimator given in Equation 22 can be regarded as
a linear regression type for the cr oss spectrum phase. In
fact, the weighted LS-TDE is a special case of the
method given in Equation 22 with r(x)=x
2
and B(ω
k
)=
ψ
-1/2
(ω
k
). This alternative regression cost function shows
the robust performance to the o utliers by assigning a
maximal error value to any scaled absolute residuals
having larger than one. For a large value of B (ω
k
), spur-
ious peaks in delay search range are diminished while
the resolution of the TDE result is decreased. In this
exp eriment, we set a con stant value, B(ω
k
)=π/3, based
on lots of simulations. Finally, a modified AMDF (m-
AMDF) method which is robust to reverberant environ-
ment is considered [13]. The performance of the AMDF
estimator is known as better than that o f the GCC
method in favorable noise conditions. The modified
AMDF method is implemented in the frequency domain
whose estimation equation is given as
ˆτ
AMDF
= arg min
τ
|X
1
(ω
k
) −X
2
(ω
k
)e
jω
k
τ
|
|X
1
(
ω
k
)
+ X
2
(
ω
k
)
e
jω
k
τ
| + ε
,
(24)
where ε is a fixed positive number to prevent division
overflow. The TDE of the modified AMDF, Equation 24,
is determined by jointly considering the AMDF and the
AMSF. The three reference TDE estimators commonly
include a maximum (or minimum) searching process
which requires a large amount of computation while the
proposed method instantly estimates the time delay with
an intra-sample precision.
In the experiment, four conversational speech signals
from four different speakers, two-males and two-females
are included into the test. An energy ratio-based voice
activity detection (VAD) is designed and same voice
active intervals are applied to different SNR conditions.
The noise PSD of cross spectrum signal gathered in
silence intervals is used to calculate the weighting term
giveninEquation10.ItisalsousedtoGCC-MLto
minimize weighting effect. The relative performance of
the TDE was evaluated through a number of trials in a
simulated rectangular room (12 × 10 × 3 m
3
). The
microphone array is located at (3,3,2) and the distance
from the source to the array is maintained 3 m for both
fixed and moving source scenarios. We tested eight
locations of the fixed source at intervals of 10° from 0°
to 70°. The room environment is artificially generated
by the modified frequency domain image source model
(ISM) with negative reflection coefficients [28,29]. The
reverberat ion tim e, T
60
,ismeasuredbyLehmann’ s
energy decay curve (EDC) [28]. The level of the additive
white Gaussian noise (WGN) varies from 5 to 25 dB as
the reverberation time is increased from 0 to 500 ms.
The sampling frequency is 8000 Hz, 64 ms Hamming
window is applied with 50% overlap and the space of
microphone is set to 8 cm.
5.1. Fixed source case in noisy and reverberant
environments
At first, it is verified whether the actual distribution of
the expanded phase follows Gaussian pdf. In Figure 6,
the dotted-line depicts a histogram of the expanded
phase and the dashed-line shows the IPD of observed
signals in the original phase domain at 1500 Hz in 5 dB
SNR condition when true IPD is +2π/3. The IPD distri-
bution in the original phase domain (dashed-line) is not
symmetric and also a number of phases is concentrated
in erroneous IPD near -π region. The solid-line is the
1
2
ˆ
(,)
d
Sn
ω
()
Qn
ω
()
X
ω
Power
1
2
Reverberant
energy
estimator
(,)
d
Sn
ω
(
,
)
Qn
ω
ˆ
(,)
r
n
λω
1
(
,
)
X
n
ω
+
+
–
+
–
2
Power
envelop
estimator
(,)Un
ω
1
2
2
(,)
X
n
ω
+
(,), (,)
qu
nn
λω λω
Figure 5 Block diagram of the GSC-based direct signal power estimation.
Yang and Kang EURASIP Journal on Advances in Signal Processing 2012, 2012:5
/>Page 10 of 19
approximated Gaussian pdf o f Equation 7 with +2π/3
mean and (2 × SNR)
-1
variance. It shows that the IPD of
real data is slightly biased to zero direction but we can
confirmthattheproposedGaussian assumption in the
expanded phase domain is quite reasonable. Figure 7
depicts the IPD distribution in the relatively high rever-
berant environment. The variance o f Gaussian pdf can-
not be evaluated from the proposed model in
reverberant condition, so we set an appropriate value. In
reverberant condition, the actual IPD is more biased to
zero than the noisy environmen t and this phenomenon
entirely depends on room environment.
Figures 8, 9, 10 show the delay estimation results in
various SNR conditions. The quantitative results by a
percentage of outliers, bias and RMSE are evaluated to
previously presented five techniques i ncluding the pro-
posed LS and RLS methods. The bias and the RMSE are
measured using the estimation result except for the out-
liers. In Figure 8, anomalies percentage is measured
when the estimated time delay exceeded 20% of the
overall delay range. The GCC-PHAT method shows the
worst result, which has a number of severely erroneous
estimation outliers in low SNR condition. The GCC -ML
and the bi-weight method show similar performance
while the bi-weight method shows slightly lower perfor-
mance in low SNR environment. The AMDF method
shows the best result among the comparing methods
while it shows certain amount of outliers in low SNR
conditions comparing to the proposed method. The pro-
posed LS and RLS have similar anomali es percentage in
the proposed algorithm structu re, and both have super-
ior performance to others such that the anomalies are
suppressed less than 5% even in low SNR condition.
The trend of estimation bias is represented in Figure 9
which shows the results in the low DOA angle and high
DOA angle cases separately. The phase of high DOA
angle cases are commonly wrapped because the wrap-
ping is occurred when the DOA angl e is lager than 32
°
in our simulation condition. All of the tested algorithms
are hardly biased when the source is located in front
direction of dual-sensor as depicted in Figure 9a because
the phase wrapping is less likely to occur for a low DOA
angle incident case. As shown in Figure 9b, however, the
estimation bias for a signal from the high DOA angle
generally increases. Since the bias problem becomes
more serious when the IPD is getting closer to +π (or
-π) as we described in Figures 6 and 7. The proposed
algorithm working in the expanded phase domain, how-
ever, does not suffer from the bias especially in noisy
environment.
The final estimation performance is presented in Fig-
ure 10 which depicts RMSE results of averaged whole
0.1
0.12
Histogram of expanded IPD
Histogram of original IPD
Approximated Gaussian pdf
0.04
0.06
0.08
-3pi -2pi -pi 0 pi 2pi 3p
i
0
0.02
p
hase
[
rad
]
Figure 6 Comparison of IPD distribution at 1500Hz in noisy environment, SNR = 5 dB.
Yang and Kang EURASIP Journal on Advances in Signal Processing 2012, 2012:5
/>Page 11 of 19
0.1
0.12
Histogram of expanded IPD
Histogram of original IPD
Approximated Gaussian pdf
0.04
0.06
0.08
-3pi -2pi -pi 0 pi 2pi 3p
i
0
0.02
p
hase
[
rad
]
Figure 7 Comparison of IPD distribution at 1500Hz in reverberant environment, SNR = 20 dB, T60 = 500 ms.
30
35
4
0
p1(LS)
p2(RLS)
GCC-ML
GCC-PHAT
Biweight
m-AMDF
15
20
25
Anomalies [%]
m-AMDF
5 10 15 20 25
0
5
10
SNR
[
dB
]
Figure 8 Anomalies percentage comparison in noisy environments.
Yang and Kang EURASIP Journal on Advances in Signal Processing 2012, 2012:5
/>Page 12 of 19
DOA angles. It is confirmed that the proposed method
has superior performance to conventional ones in over-
all SNR conditions. The proposed LS and the AMDF
methods show better performance than the GCC-ML
and the bi-weight method while the performance of the
bi-weight method and the AMDF method decrease in
low SNR condition. The GCC-PHAT shows the worst
performance in noisy environment.
Figures 11, 12, 13 show the performance of the test
algorithms in reverberant environments. The
0.06
0.07
0.08
0.09
0.1
p
le delay]
p1(LS)
p2(RLS)
GCC-ML
GCC-PHAT
Biweight
m-AMDF
0
0.01
0.02
0.03
0.04
0.05
Bias [sam
p
(a)
5 10 15 20 25
0
SNR [dB]
0.1
p1(LS)
0.05
0.06
0.07
0.08
0.09
[sample delay]
p2(RLS)
GCC-ML
GCC-PHAT
Biweight
m-AMDF
5 10 15 20 25
0
0.01
0.02
0.03
0.04
SNR [dB]
Bias
(
b
)
SNR [dB]
Figure 9 Bias comparison in noisy environments: (a) bias for low DOA angle (0-40
°
), (b) bias for high DOA angle (50-70
°
).
Yang and Kang EURASIP Journal on Advances in Signal Processing 2012, 2012:5
/>Page 13 of 19
reverberant signal is synthesized using the ISM model
including 20 dB WGN for all conditi ons. Figure 11
depicts the anomalies percentage in reverberant environ-
ments. The number of severe outlier is rapidly in creased
by increasing T60 for the GCC-ML method while the
GCC-PHAT, the AMDF and the bi-weight methods
show robust performance even to the long reverberation
time. Especially, the AMDF method shows the highest
outlier suppression performance that does not affect by
the reverberation. From Figures 8, 11, it is clear that the
performance of these methods is sensitively affected by
noise but robust to reverberation because it is originally
designed to targeting reverberant conditions. The outlier
suppression performance of the proposed method is
similartothebi-weightmethodthattheanomalyper-
centage is limited by 10% in reverberant environments.
The estimated bias represented in Figure 12 shows a
different trend comparing to the result in noisy envi ron-
ment such that the bias can occur regardless of the
DOA angle. The GCC-PHAT method shows the most
robust performance irrespective of the reverberation
level while its performance also slightly degrades in the
high DOA angle case. The other methods except for the
GCC-PHAT show that the estimation bias is larger than
the resu lt in n oisy envir onment and it is highly affected
by the RIR.
Finally, the estimation error except for anomalies is
depicted in Figure 13. The GCC-ML method has a rela-
tively small error in low reverberation condition but the
error dramatically increases as the reverberation increases.
Among the methods immune to reverberation, the AMDF
method shows the best performance in overall conditions.
As with the previous RMSE results in noisy environment,
theproposedtwo-stepmethodwiththeSRR-based
weighting shows the most accurate TDE results in rever-
berant environment comparing to the other methods.
Overall, it is verified that the proposed method shows
the highest performanc e especially in the noisy environ-
ments, i.e. it has minimum error and the estimation
anomalies is less than 5% even in low SNR condition. It
is also verified that unlikely to other methods, the pro-
posed multiple linear regression model-based TDE
method is not biased by phase wrapping. It also shows
the most accurate TDE results in reverberant environ-
ments. The proposed method shows similar results to
the AMDF method which shows the best performance
among the reverberation immune methods in the
anomalies percentage and the bias measurements.
5.2. Source tracking scenario for slow and fast moving
sources
The tracking performance of the proposed method is
verified when the target speech source moves around. A
conversational speech of 30 s length is tested in low
SNR condition (5 dB). The RLS parameters for slow and
fast moving sources are set δ =0.9,Q = 9 in 64 ms in
50% OLA frame work that the maximum length of
observation fr ames is 352 ms and the minimum
1
10
-
1
RM
S
E [sample delay]
p1(LS)
5 10 15 20 25
10
-2
SNR
[
dB
]
p1(LS)
p2(RLS)
GCC-ML
GCC-PHAT
Biweight
m-AMDF
[]
Figure 10 TDE performance comparison in noisy environments.
Yang and Kang EURASIP Journal on Advances in Signal Processing 2012, 2012:5
/>Page 14 of 19
weighting for last frame is 0.9
9
. The TDE results of the
proposed LS and RLS for slow moving speaker are
depicted in Figure 14. From the result, it is also con-
firmed that the RLS estimation tracks the true TDE
(solid-line) better than the first step of the proposed
estimation, LS. Note that the proposed RLS can find the
true TDE value even there exists a long silence interval.
Identical experiments are carried out for fast moving
source and the results are depicted in Figure 15. The
tracking performance for fast moving source is also
good though ther e are some failed estimations around
11 and 24 s when the source moves from the high DOA
angle directions. The proposed RLS, however, adapts the
true TDE very quickly and tracks the speaker again even
in these cases. The trends of tracking performance of
the proposed two-stage method and the conventional
methods are presented in Figure 16. For a fair compari-
son, a smoothing technique is applied to the result of
the conventional TDE using a exponentially decaying
sliding window that has a same fashion to the second
stage of the proposed method. The tracking perfor-
mance of the conventional methods shows a similar
trend to the previous result for a fixed speaker. The pro-
posed two-stage method (RLS) shows the best result in
accuracy and the performance does not be affected by
the velocity of a moving source.
6. Conclusion
A LS TDE method based o n the multiple linear regres-
sion model via the interpolated phase expansion has
been proposed. By the proposed phase expansion
method, the IPD distribution between two channel sig-
nals becomes more advantageous in terms of pdf. It the-
oretically verified that the approximated Gaussian
approaches to the actual IPD distribution for higher
SNR and also con firmed it by various experime ntal
results. The proposed TDE method which is composed
of two stages shows superior performance e specially in
the anomalies percentage and RMSE results in both
noisy and reverberant environments. It was also demon-
strated that the bias to zero problem for high DOA
angles could be mitigated in the proposed method.
Finally, the superiority of the proposed algorithm in
terms of tracking a moving source in low SNR condition
was verified. The proposed method provides the explicit
TDE solution that can be applied to a real time applica-
tion. Future work involvesimprovingthemethodin
reverberant environments based on detailed investiga-
tion about the IPD statistics for a multi-path effects.
Appendix A: Simplifying the IPD pdf
The numerator of the power term in Equation 5 is sim-
plified by the trigonometric identities as follows:
30
35
40
p1(LS)
p2(RLS)
GCC-ML
GCC-PHAT
Biweight
15
20
25
Anomalies [%]
m-AMDF
0 50 100 150 200 250 300 350 400 450 50
0
0
5
10
T60
[
msec
]
[]
Figure 11 Anomalies percentage comparison in reverberant environments.
Yang and Kang EURASIP Journal on Advances in Signal Processing 2012, 2012:5
/>Page 15 of 19
006
0.07
0.08
0.09
0.1
e delay]
p1(LS)
p2(RLS)
GCC-ML
GCC-PHAT
Biweight
m-AMDF
0.01
0.02
0.03
0.04
0.05
0
.
06
Bias [sampl
(a)
0 50 100 150 200 250 300 350 400 450 50
0
0
T60 [msec]
01
p
1
(
LS
)
0.05
0.06
0.07
0.08
0.09
0
.
1
s
ample delay]
p( )
p2(RLS)
GCC-ML
GCC-PHAT
Biweight
m-AMDF
0 50 100 150 200 250 300 350 400 450 50
0
0
0.01
0.02
0.03
0.04
T[ ]
Bias [
s
(
b
)
T
60
[
msec
]
Figure 12 Bias comparison in reverberant environments: (a) bias for low DOA angle (0-40
°
), (b) bias for high DOA angle (50-70
°
).
Yang and Kang EURASIP Journal on Advances in Signal Processing 2012, 2012:5
/>Page 16 of 19
1
10
-
1
RM
S
E [sample delay]
p
1
(
LS
)
0 50 100 150 200 250 300 350 400 450 50
0
10
-2
T60
[
msec
]
p( )
p2(RLS)
GCC-ML
GCC-PHAT
Biweight
m-AMDF
[]
Figure 13 TDE performance comparison in reverberant environments.
20
40
60
80
e
e]
LS result
RLS result
true TDE
-40
-20
0
20
D
O
A angle [degr
e
5 10 15 20 25
-80
-60
time
[
sec
]
Figure 14 Tracking performance of the proposed two-stage method for slow moving source: DOA estimation results of the first (LS)
and the second stage (RLS).
Yang and Kang EURASIP Journal on Advances in Signal Processing 2012, 2012:5
/>Page 17 of 19
20
40
60
80
e
e]
-40
-20
0
20
D
O
A angle [degr
e
5 10 15 20 25
-80
-60
time
[
sec
]
LS result
RLS result
true TDE
Figure 15 Tracking performance of the proposed two-stage method for fast moving source: DOA estimation results of the first (LS)
and the second stage (RLS).
03
0
.
3
5
very slow moving
slow moving
fast moving
0. 2
0. 25
0
.
3
m
ple delay]
fast moving
very fast moving
005
0. 1
0. 15
RMSE [ sa
m
GCC
-ML
GCC
-PHAT BIWT m- A MDF L
S
RL
S
0
0
.
05
Figure 16 Comparison of tracking performance between the proposed two-stage method (RLS) and the smoothed TDE of
conventional methods in 5dB SNR condition.
Yang and Kang EURASIP Journal on Advances in Signal Processing 2012, 2012:5
/>Page 18 of 19
(r cos(φ + ζ ) − cos(φ))
2
+(r sin(φ + ζ ) − sin(φ))
2
= r
2
− 2r(cos(φ + ζ )cos(φ)+sin(φ + ζ )sin(φ)) +
1
=
(
r −cos
(
ζ
))
2
+1− cos
2
(
ζ
)
.
(25)
Then, the pdf function becomes
p
φ,ζ ,γ
=
1
2πγ
2
⎛
⎜
⎝
e
cos
2
(ζ ) − 1
2γ
2
⎞
⎟
⎠
⎛
⎜
⎜
⎝
∞
0
re
(r − cos(ζ ))
2
−2γ
2
dr
⎞
⎟
⎟
⎠
.
(26)
By substituting t = r - cos(ζ) to solve the integral func-
tion, the pdf function can be simplified as follows:
p
φ,ζ ,γ
=
1
2πγ
2
⎛
⎜
⎝
e
cos
2
(ζ ) − 1
2γ
2
⎞
⎟
⎠
⎛
⎜
⎝
∞
−cos(ζ )
te
t
2
−2γ
2
dt +
∞
−cos(ζ )
cos(ζ )e
t
2
−2γ
2
dt
⎞
⎟
⎠
=
1
2πγ
2
⎛
⎜
⎝
e
cos
2
(ζ ) − 1
2γ
2
⎞
⎟
⎠
⎛
⎜
⎝
γ
2
e
−cos
2
(ζ )
2γ
2
+cos(ζ)
∞
−cos(ζ )/γ
γ e
t
2
−2
dt
⎞
⎟
⎠
=
1
2π
⎛
⎜
⎝
e
−1
2γ
2
⎞
⎟
⎠
+
1
2πγ
2
⎛
⎜
⎜
⎝
e
sin
2
(ζ )
−2γ
2
⎞
⎟
⎟
⎠
⎛
⎜
⎝
cos(ζ )
√
2π
∞
−cos(ζ )/γ
e
t
2
−2
dt
⎞
⎟
⎠
.
(27)
Competing interests
The authors declare that they have no competing interests.
Received: 31 May 2011 Accepted: 10 January 2012
Published: 10 January 2012
References
1. S Nakamura, K Hiyane, F Asano, Y Kaneda, T Yamada, TN Kobayashi, H
Saruwatari, Design and collection of acoustic sound data for hands-free
speech recognition and sound scene understanding, in Proceedings of the
ICME ‘02. 2, 161–164 (2002)
2. Z Yermeche, N Grbic, I Claesson, Beamforming for moving source speech
enhancement. in Applications of Signal Processing to Audio and Acoustics
25–28 (2005)
3. D Gatica-Perez, G Lathoud, JM Odobez, I McCowan, Audiovisual
probabilistic tracking of multiple speakers in meetings. IEEE Trans Audio
Speech Language Process. 15, 601–616 (2007)
4. K Wilson, Speech source separation by combining localization cues with
mixture models of speech spectra, in ICASSP-2007. 1,33–36 (2007)
5. F Talantzis, C Boukis, The robustness effect of acoustic source localization
on blind source separation and deconvolution systems. in Digital Signal
Processing, 15th International Conference 339–342 (2007)
6. VM Trifa, A Koene, J Moren, G Cheng, ETH Zurich, Real-time acoustic source
localization in noisy environments for human-robot multimodal interaction,
in. in The 16th IEEE International Symposium on Robot and Human Interative
Communication 393–398 (2007)
7. PR Roth, Effective measurements using digital signal analysis. IEEE
Spectrum. 8,62–70 (1973)
8. GC Carter, The smoothed coherence transform. Proc IEEE. 61, 1497–1498
(1973)
9. C Knapp, G Carter, The generalized correlation method for estimation of
time delay. IEEE Trans Acoust Speech Signal Process. 24, 320–327 (1976).
doi:10.1109/TASSP.1976.1162830
10. GC Carter, Time delay estimation for passive sonar signal processing. IEEE
Trans Acoust Speech Signal Process. 29, 463–470 (1981). doi:10.1109/
TASSP.1981.1163560
11. MS Brandstein, A framework for speech source localization using sensor
arrays, PhD thesis, Department of Electrical Engineering, Brown University,
(May 1995)
12. MS Brandstein, Time-delay estimation of reverberated speech exploiting
harmonic structure. J Acoust Soc Am. 105, 2914–2919 (1999). doi:10.1121/
1.426904
13. J Chen, J Benesty, Y (Arden) Huang, Performance of gcc- and amdf-based
time-delay estimation in practical reverberant environment. EURASIP J Appl
Signal Process. 2005,25–36 (2005)
14. J Chen, J Benesty, Y (Arden) Huang, Time delay estimation in room acoustic
environments:an overview. EURASIP J Appl Signal Process. 2006,1–19
(2006)
15. TG Dvorkind, S Gannot, Time difference of arrival estimation of speech
source in a noisy and reverberant environment. Signal Process. 85, 177–204
(2005). doi:10.1016/j.sigpro.2004.09.014
16. C Zhang, D Florencio, Z Zhang, Why does phat work well in low noise,
reverberative environments?, in. ICASSP-2008 2565–2568 (2008)
17. PL Feintuch, NJ Bershad, FA Reed, Time delay estimation using the lms
adaptive filter-dynamic behavior. IEEE Trans Acoust Speech Signal Process.
29, 571–576 (1981). doi:10.1109/TASSP.1981.1163608
18. Y (Arden) Huang, J Benesty, GW Elko, Adaptive eigen-value decomposition
algorithm for real time acoustic source localization system, in. ICASSP-1999.
43, 937–940 (1999)
19. YT Chan, RV Hattin, JB Plant, The least squares estimation of time delay and
its use in signal detection. IEEE Trans Acoust Speech Signal Process. 26,
217–222 (1978). doi:10.1109/TASSP.1978.1163078
20. AG Piersol, Time delay estimation using phase data. IEEE Trans Acoust
Speech Signal Process. 29, 471–477 (1981). doi:10.1109/TASSP.1981.1163555
21. BV Hamon, EJ Hannan, Spectral estimation of time delay for dispersive and
non-dispersive systems. J R Stat Soc (Appl Stat). 2, 134–142 (1974)
22. MS Brandstein, JE Adcock, HF Silverman, A practical time-delay estimator for
localizing speech sources with a microphone array. Comput Speech
Language. 9, 153–269 (1995). doi:10.1006/csla.1995.0009
23. MS Brandstein, HF Silverman, A robust method for speech signal time-delay
estimation in reverberant rooms, in ICASSP-1997. 1, 375–378 (April 1997)
24. JM Tribolet, A new phase unwrapping algorithm. IEEE Trans Acoust Speech
Signal Process. 25, 170–177 (1977). doi:10.1109/TASSP.1977.1162923
25. D Li, SE Levinson, A linear phase unwrapping method for binaural sound
source localization on a robot. in IEEE International Conference, Robotics,
Automation (2002)
26. P Smaragdis, P Boufounos, Position and trajectory learning for microphone
arrays. IEEE Trans Acoust Speech Signal Process. 15, 358–368 (2007)
27. W Zhang, BD Rao, A two microphone-based approach for source
localization of multiple speech sources. IEEE Trans Audio Speech Language
Process. 18, 1913–1928 (2010)
28. EA Lehmann, AM Johansson, Prediction of energy decay in room impulse
responses simulated with an image-source model. J Acoust Soc Am. 124,
269–277 (2008). doi:10.1121/1.2936367
29. JB Allen, DA Berkley, Image method for efficiently simulating small room
acoustics. J Acoust Soc Am. 65, 943–950 (1979). doi:10.1121/1.382599
30. SM Kay, in Fundamentals of Statistical Signal Processing: Estimation Theory,
vol. I. (Prentice Hall PTR, Upper Saddle River, 1993)
31. A Said, A Kalker, RW Schafer, Phase-domain statistical analysis for audio
source localization. in IEEE 9th Workshop, Multimedia Signal Processing 94–97
(2007)
32. S Haykin, in Adaptive Filter Theory, vol. 4. (Prentice Hall PTR, Upper Saddle
River, 2002)
33. GC Cater, CH Knapp, AH Nuttall, Estimation of the magnitude-squared
coherence function via overlapped fast Fourier transform processing. IEEE
Trans Audio Electroacoustics. 21, 337–344 (1973). doi:10.1109/
TAU.1973.1162496
34. EAP Habets, S Gannot, Dual-microphone speech dereverberation using a
reference signal, in ICASSP-2008. 4, 901–904 (April 2008)
35. S Boll, Suppression of acoustic noise in speech using spectral subtraction.
IEEE Trans Acoust Speech Signal Process. 27, 113–120 (1979). doi:10.1109/
TASSP.1979.1163209
doi:10.1186/1687-6180-2012-5
Cite this article as: Yang and Kang: Two-stage source tracking method
using a multiple linear regression model in the expanded phase
domain. EURASIP Journal on Advances in Signal Processing 2012 2012:5.
Yang and Kang EURASIP Journal on Advances in Signal Processing 2012, 2012:5
/>Page 19 of 19