Technical Analysis of the Financial Markets_4 doc
Bạn đang xem bản rút gọn của tài liệu. Xem và tải ngay bản đầy đủ của tài liệu tại đây (283.61 KB, 18 trang )
of computer programs to signal the ‘‘best’’ times to buy or sell—so-called
program trading. Improved transacting technology and the increased reliance
on mathematical models to trigger the buying and selling of huge blocks of
stock (and futures, of which more will be said shortly) proved to be a
combination that, like margin buys in the 1920s, pushed Wall Street into
ever more vigorous trading. This new trading style, reminiscent of the 1920s,
led to wider swings in stock prices and increased trading volume.
By late 1986 concerns about the impact of computerized trading systems
were being raised by, among others, John J. Phelan, chairman of the New
York Stock Exchange. Most firms and traders on the street ignored such
concerns. ‘‘In the remaining months of 1986 and through most of 1987,’’
writes Metz, ‘‘Wall Street firms will become more aggressive in their in-
dex arbitrage, and more and more of their clients will ask to get on the
bandwagon The trend will also be driven by another evolving program
trading strategy, ‘dynamic hedging,’ more widely known by the misnomer
‘portfolio insurance.’ ’’
16
Some argue that it was not program trading that
caused the October 1987 break but the failure of the actual trading mech-
anism. That is, because program trading involves movements of huge blocks
of stock, an atypically large volume could overwhelm the trading network.
Even with continual technological improvements to facilitate trading, by Oc-
tober 1987 the confluence of tremendous trading volume (stemming in part
to activity in the Chicago Mercantile Exchange) and the inability by floor
specialists to establish orderly markets led to one of the most dramatic breaks
in the stock market’s history.
When the DJIA reached its then record high of 2,722.4 in August 1987,
this marked a near-doubling of stock prices in only a few short years (see
Figure 2.3). Even though the DJIA stumbled a bit earlier in the year, stock
prices continued to rise even in the face of unfavorable economic news. The
U.S. trade deficit was soaring and the dollar’s exchange value with foreign
currencies was dropping. Under the leadership of its newly installed chairman
Alan Greenspan, the Fed was pushing interest rates higher in part to protect
the weak dollar. Just before Labor Day the Fed announced that it was raising
its key policy tool, the federal funds rate, by fifty basis points. This an-
nouncement sent a shock wave through the market. ‘‘With stocks already
looking too expensive relative to bonds,’’ Metz notes, ‘‘the Fed suddenly and
substantially enhanced the allure of bonds.’’
17
Following the Fed’s rate hike,
stock prices began to recede from their August highs.
Not only was the economic data unfavorable, but the federal government
publicly began taking a closer interest in the buyout activity that helped fuel
the market’s advance. On Tuesday, October 13, the House Ways and Means
Committee announced it was going to investigate the tax benefits associated
26 The Stock Market
with leveraged buyouts. The message was clear: Congress intended to close
some loopholes through which the corporations and Wall Street firms had
wiggled. Congress wanted to get its share of the taxes that it had missed. With
rising interest rates and the threatened loss of tax advantages for buyouts and
mergers, the drop in stock prices accelerated.
What makes this part of the story different from 1929 is how the market
dropped. For example, the day after the Ways and Means Committee an-
nouncement, the DJIA lost ninety-five points. This decline did not come from
ordinary investors selling their stock but from sell orders emanating from the
Chicago Mercantile Exchange (CME). Futures contracts for the S&P 500 were
sold by traders in Chicago and this translated into selling pressure in the stock
exchange back in New York. (This relation is detailed in Chapter Five.) Further
selling of futures contracts pushed the DJIA down farther on Thursday, Oc-
tober 15, when it closed at 2,355. In just a little more than six weeks the DJIA
lost about 13 percent from its peak value. The worst was yet to come, however.
Trading on Friday, October 16, opened with the news that an oil tanker
traveling under the U.S. flag was attacked by Iranian forces. Fears of increased
turmoil in the Middle East and the potential disruption of oil flows triggered
sell orders as investors sought safety in bonds and cash. In the late morning
a handful of index arbitrageurs executed sell programs in the NYSE that
amounted to over $180 million. This action created a large discount between
the S&P 500 futures contract and the S&P index value in New York, and this
deviation activated a number of program trades to sell. Metz estimates that
program trading accounted for 43 percent of the volume in the final half
hour.
18
By the close, the DJIA had lost another 108 points.
Modern technology made trading faster and more efficient. Even so,
trading on Monday, October 19, opened with a problem familiar to investors
in 1929: a slowdown of price information. In 1987, unlike 1929, the ticker
was not delayed, but trading was delayed because of order imbalances with the
specialists on the floor of the exchange. The specialists at the NYSE confronted
huge sell orders stemming from the actions at the CME. With sell orders
outnumbering buy orders, the NYSE imposed trading delays. These delays
meant that providing information about market clearing prices—the spe-
cialists’ job—slowed. This lack of information—the modern version of the
delayed ticker tape—further raised anxiety levels of traders at the CME. Try
as they might, specialists faced a losing battle that day, also known as Black
Monday. John J. Phelan later recalled it as ‘‘the nearest thing to a meltdown I
ever want to see.’’ On Monday, October 19, 1987, over 604 million shares
were traded, a bit less than the previous record set on the previous Friday.
When it was over, the DJIA lost 508 points or 22.6 percent, making it by far
the worst percentage decline day in the stock market’s history.
A Brief History of the U.S. Stock Market 27
On Monday night there was a scramble for liquidity. Because some spe-
cialists ended the day as net buyers of stock, they could not meet their pur-
chases with existing funds (transactions must be cleared within five days).
Normal providers of funding now stalled; banks denied loan commitments
and withheld credit from the market. The situation was so dire that one firm
merged overnight with another brokerage house to meet its financial respon-
sibilities. Not only did Monday reveal that the specialists could not handle
such market pressure, but it also exposed trouble in the existing technology of
trading. The breakdown in the system meant that stop-loss orders could not
be executed. Unable to get through to brokers, many traders lost huge sums
simply because they could not execute their sell orders.
Trading on Tuesday, October 20, was delayed and trading in many stocks,
when the market finally opened, was halted at times. One early event marks a
clear difference between the 1929 and 1987 crashes. Early Tuesday morning
the Federal Reserve released the following statement: ‘‘The Federal Reserve,
consistent with the responsibilities as the nation’s central bank, affirmed today
its readiness to serve as a source of liquidity to support the economic and
financial system.’’ The fact that the Fed immediately lowered the federal funds
rate from 7.50 percent to 6.75 percent helped turn market psychology
around. Behind the scenes arm twisting by Fed officials, most notably Chair-
man Greenspan and Gerald Corrigan, president of the Federal Reserve Bank
of New York, helped. Stocks closed higher on Tuesday than Monday and by
Wednesday, the DJIA posted a 10 percent gain. The Fed’s actions during the
rest of October were aimed at restoring confidence in the market. As illus-
trated in Figure 2.3, the DJIA regained its balance, closing the year without
further major losses.
The aftermath of the 1987 crash bears no resemblance to the events fol-
lowing 1929. Not only was there no economic depression, there was not even
a mild recession. This surprised many observers (and many professional econ-
omists) who predicted that such loss of wealth would reduce consumer
spending and lead to an overall economic downturn. This reaction, or lack of,
is partly explained by the rapid response of the Federal Reserve. As just
discussed, the Fed in 1987 moved quickly to fulfill its role as lender of last
resort: in times of financial crises injecting liquidity into the market, arm
twisting financial institutions, and standing ready to insure an orderly market.
Robert T. Parry, president of the Federal Reserve Bank of San Francisco,
summarized the Fed’s actions as doing ‘‘what it was supposed to do: it
transferred the systematic risk from the market to the banks and ultimately to
the Fed, which is the only financial institution with pockets deep enough to
bear this risk. This allowed the market intermediaries to perform their usual
functions and helped keep the market open.’’
19
The 1987 crash brought about
28 The Stock Market
a number of institutional reforms in the stock market. Most of these related to
stopping trading when certain volume barriers were breached. These ‘‘circuit
breakers’’ served to coordinate trading halts across the futures and equity
markets. It became widely believed that selling pressure emanating from the
equity futures market in Chicago and the inability of the trading mechanism
to handle the deluge of sell orders explained the crash. The objective of circuit
breakers was to halt trading so the second of these events could not occur.
When looking at the long history of stock prices, the Crash of 1987 looks
like a blip in the market rally that began in the early 1980s and ran until 2000.
Charles Schwab, the namesake of the brokerage house, said that ‘‘Black
Monday [1987] did to investors what Jaws did to swimmers. They do not want
to go in the water, but they still come to the beach.’’
20
Their fear of the water
was short-lived. By 1990, the DJIA passed through 2,800, surpassing the peak
reached in August 1987. As the 1990s wore on, investors forgot about Black
Monday and dove back into the financial waters with even greater enthusiasm.
T
HE CRASH OF 2000: NEW ECONOMY OR IRRATIONAL EXUBERANCE?
At the close of 1996 Alan Greenspan, chairman of the Federal Reserve’s
Board of Governors, delivered the Francis Boyer Lecture to an assembled din-
ner crowd at the American Enterprise Institute, a Washington, D.C. think-
tank. The title of the speech was typical for such gatherings: The Challenge of
Central Banking in a Democratic Society. In his wide-ranging talk about the
pitfalls and dilemmas facing central bankers like himself, the chairman ut-
tered two words that to many captured the essence of the ongoing run-up in
stock prices: ‘‘Irrational exuberance.’’ What he actually said was ‘‘But how do
we know when irrational exuberance has unduly escalated asset values, which
become subject to unexpected and prolonged contractions as they have in
Japan over the past decade?’’
Embedded within a speech of over 4,300 words, these two words caused
quite a stir and remain part of our vocabulary. Stock market participants now
believed that the chief U.S. monetary policymaker thought stocks were
overpriced. The thinly veiled hint was clear: If no correction occurred, there
would likely be a sustained bear market or even another stock market crash
like 1987. As Greenspan made clear only a few sentences later, a ‘‘collapsing
asset bubble’’ would have dire economic consequences, as the recent Japanese
experience had showed. Greenspan had thrown down the gauntlet to those
who believed that stock prices would only continue to rise.
History informs us that stock prices did in fact continue to rise for the rest
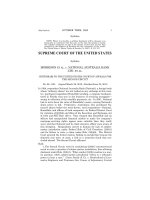
of the decade. Figure 2.4 shows this quite vividly. Within a few years of this
speech Greenspan began to explain the continued ascent of stock prices with
A Brief History of the U.S. Stock Market 29
reference to a ‘‘new economy.’’ What are some of the reasons for the market’s
unprecedented rise and some explanations for the decline that began in early
2000? Was the eventual crash the bursting of an asset bubble, or was it a
predictable correction from changes in the underlying fundamentals?
The majority of economists believe that individuals in financial markets
behave rationally. There may be times when stock prices appear to lose track
of the underlying fundamentals, such as corporate earnings and profits, that
explain stock prices, buttheyareisolated instances. If stock prices are explained
by investors’ perceptions of future or expected cash flows being generated by
companies, then the run-up in prices during the 1990s was tailor-made to fit
the ‘‘fundamentals’’ view.
Although many thought the Crash of 1987 would adversely affect the
economic expansion, the economy continued to grow throughout the 1990s.
Except for a relatively mild recession in 1990, the period from the early
1980s through the end of the 1990s is characterized by sustained economic
growth. One economist even dubbed the period ‘‘the long boom.’’ But what
separates this period of economic expansion from others was a suitable ex-
planation. For many the expansion occurred because the long-awaited revo-
lution in information technology (IT) had finally taken hold. Although
economists predicted that the improvements in computer technology and the
attendant increase in the use of computers would spur productivity and eco-
nomic activity, it never seemed to materialize. That is, until the mid-1990s.
FIGURE 2.4
Dow Jones Industrial Average: Close, 1990–2005
Source: Adapted from www.economagic.com.
30 The Stock Market
A recognized expert on the relation between capital formation and eco-
nomic growth observed in 2001 that ‘‘the resurgence of the American
economy since 1995 has outrun all by the most optimistic expectations
The development and deployment of information technology is the foun-
dation of the American growth resurgence.’’
21
This view reiterated what
many already suspected: computers and related technologies had achieved
something of a quantum leap. They were faster, more capable, and their use
to gather and process information reached new levels. As the IT revolution
took off, the economy (and stock prices) went along for the ride.
Not only did the economy grow and incomes rise, but inflation also re-
mained surprisingly subdued. Unlike past economic expansions that brought
higher rates of inflation, this time prices did not increase very rapidly. Some
explained this phenomenon by the fact that improved communications and
computerization lowered operating costs of firms, cost savings that got passed
along in the form of slower price increases. Large box stores like Wal-Mart
and Costco took advantage of the information technology to significantly
improve their handling of inventory and shipping, both of which allowed
them to realize significant cost savings. Another idea was that increased global
competition forced U.S. producers to hold down price increases.
If stock prices reflect investors’ expectations of firms’ future earnings,
a growing economy explains some of the upward march in stock prices. As
Figure 2.4 shows, however, the second half of the 1990s was distinctly dif-
ferent from the first half. Even though the market was rising at a reasonably
healthy pace following the 1987 crash, it exploded after 1995. In late De-
cember 1991 the DJIA broke through 3,100. It took until February 1995 for
it to surpass the 4,000 mark. Using the same time interval, the DJIA went
from 4,000 in 1995 to over 11,700 by 2000. Clearly something was different
in the second half of the 1990s.
The cost of computing plummeted in the 1990s. Computing was faster
and cheaper than ever before, and everyone projected that price declines
would continue into the foreseeable future. So how would a market popu-
lated by rational investors respond to such rosy forecasts? Investors flocked to
buy tech stocks. It made sense to do so. Stanford University economist
Robert Hall observed that ‘‘a rational stock market measures the value of the
property owned by corporations. Some types of corporate property, especially
the types held by high-tech companies, have values that are exquisitely sensi-
tive to the future growth of the cash they generate.’’
22
In other words, the high-
flying stock prices on firms that seemed to offer nothing more than possible
future success was explained not by invoking a ‘‘bubble’’ explanation, but by
investors willing to bet that the stock they just purchased was going to be the
next Microsoft or Dell.
A Brief History of the U.S. Stock Market 31
The bull market was not without some setbacks, however. The market was
impacted, albeit temporarily, by the onset of the Asian Crisis in 1997. (See
Figure 2.4.) The crisis was precipitated by speculative attacks on the currencies
of several East Asian countries. Beginning with a major devaluation of the
Thai baht, the crisis spread to the currencies of other countries, including
South Korea, Indonesia, Malaysia, and the Philippines. There are several
theories, but the most popular explanation is that the rapid expansion of these
economies was built on fraudulent behavior in the banking systems. As
the crisis unfolded, it became clear that loans were made not on the basis of
expected financial outcomes but often on the basis of a borrower’s relation
with the bank. As the fraud became apparent, foreign investors unloaded
financial assets in these countries and with changes in investment expecta-
tions, others followed suit. The speculative attacks began.
The U.S. stock market also was affected more dramatically by two related
events in 1998. One was the collapse of the Russian financial system in August
1998. This produced a sharp reaction in the U.S. stock market: On August
31, 1998, the DJIA dropped over 512 points, a 6.4 percent loss on one day.
In and of itself, the Russian collapse probably would not have affected stock
prices for long. However, the fact that this event caused the near-collapse of
a U.S. hedge firm, Long-Term Capital Management (LTCM), makes it
worthy of discussion.
The collapse of the Russian financial system—the Russian government
essentially declared bankruptcy—caused many investors to reassess the rela-
tive risk of corporate and government bonds. In a flight to quality, investors
shifted into safer government bonds. Unfortunately for the management of
LTCM, this response widened the spread between prices on the two bonds.
LTCM had bet on exactly the opposite to occur: Since the spread already was
at a higher than normal level, LTCM bet that it would shrink. When the
Russian crisis widened the spread even further, LTCM faced huge losses. By
mid-September the company was no longer able to meet creditors’ demands,
and LTCM, like the Russian government, was effectively insolvent. As seen
in Figure 2.4, stocks took a beating in mid-1998 as news of Russia and
LTCM spread. The DJIA, which had peaked at 9,328 in July, dropped to
7,539 by August 31, 1998.
To meet its obligations, LTCM could have sold off its assets at whatever
the market would pay. Such a ‘‘fire-sale’’ of LTCM’s assets—nearly $80 bil-
lion in securities and $1 trillion in financial derivatives—would negatively
impact a market that already was jittery from the problems in Asia and Russia.
So the Fed moved quickly and signaled the seriousness of the situation by
lowering the federal funds rate seventy-five basis points, a large change given
its usual twenty-five basis point changes. The Fed also engineered a very
32 The Stock Market
public rescue plan of LTCM by its creditors. This plan infused $3.6 billion
into LTCM in exchange for specified changes in management of the fund.
Whether this intervention was a wise policy is debatable, but it did calm
financial markets. Stock prices began to climb sharply as the crisis was averted.
From its low of 7,539 on August 31, the market once again began its upward
climb, with the DJIA pushing through 9,400 by the end of 1998.
As the DJIA pushed through 10,000 in early 1999—it stood at 3,600 only
five years earlier—there arose an increasing level of anxiety. As in each of the
previous crashes, the period preceding the decline often is characterized by
mixed signals from otherwise reputable sources. Recall Irving Fisher’s claim
on the eve of the 1929 crash that stock prices would only go higher? In
an eerily similar statement, financial reporter Gretchen Morgenson wrote in
the New York Times that ‘‘the market’s [upward] move is significant in what
it reflects: the unparalleled strength of the economy and the dominance of the
world economic stage by American Corporations.’’
23
Juxtapose this view to
that of Gail Dudack, the chief market strategist for Warburg, the U.S. unit of
UBS, a major investment bank: ‘‘Wall Street is moving from fact to fiction.’’
24
Her view was that the basis for stock valuation simply was not there. Investors
were not irrational in trying to find the next Microsoft or Wal-Mart, but the
reported earnings upon which they based their investment decisions simply
were not there to support the high-flying stock prices.
Attempts to explain the markets in the late 1990s did not account for the
magnitude of misreported earnings. If market crashes are associated with key
events, the massive and oftentimes fraudulent reporting of earnings exposed
in 2000 is a good candidate to explain the crash. Speaking before an audience
at the Center for Law and Business on the campus of New York University in
September 1998, Arthur Levitt, the commissioner of the Securities and Ex-
change Commission, suggested that ‘‘managing may be giving way to ma-
nipulation. Integrity may be losing to illusion.’’
25
Of course history indicates that misrepresentation of earnings occurred in
some of the largest firms traded on the street. While this misrepresentation
helped drive stock prices higher, even allowing the fifteen-year-old AOL to
swallow the larger and older Time Warner, it would not continue. As 1999
turned into 2000 the ‘‘millennium bug’’ failed to materialize and stock prices
began to soften. After a flat first half, stocks in late 1999 began to rise into
2000. The peak in the DJIA was reached on January 14, 2000, when it
topped out at 11,722.98. In March 2000 the effervescent NASDAQ index,
which had increased over 100 percent during the past year, also peaked.
From that point on it literally was downhill: The bull market of the 1990s
was over. By the end of 2000 the NASDQ index had declined over 50 per-
cent, investors losing about $3 trillion in paper wealth. Although not as
A Brief History of the U.S. Stock Market 33
sharp, Figure 2.4 shows that the DJIA began a downward slide that did not
end until 2003.
What ‘‘caused’’ the 2000 break? One candidate is monetary policy. As in
earlier episodes, the Federal Reserve pushed interest rates higher during 1999.
After dealing with the financial crises of 1998, the Federal Reserve embarked
on a policy to quash any resurgence of inflation. To do this, the Fed increased
the federal funds rate from about 4.5 percent in early 1999 to 6.5 percent by
spring 2000.
Another ‘‘cause’’ sometimes suggested is the increased amount of insider
selling that began in late 1999. Between September 1999 and July 2000, the
value of insider stock sales, usually done in large blocks, rose to slightly more
than $43 billion (Mahar, 2003). In fact, during the first six months of 2000
alone, insider block sales amounted to $39 billion, much more pronounced
than for all of 1997–98. Did those dumping their own company’s stocks
know that a break in the market would expose inflated earnings? The expo-
sure of corporate scandal and eventual collapse of companies like Enron and
Global Crossing to name a couple, gave investors, especially institutional
investors, reason enough to bail out. The market lost all the momentum of the
previous years and even as the market drifted lower in 2001, the tragic events
of September 11, 2001, pushed it down further: The DJIA, which was 11,722
in January 2000, was 8,920.7 when the market reopened on September 17,
2001. It took until 2006 for the DJIA to approach its pre-2000 level.
SUMMARY
The market’s development was transformed by several notable episodes of
boom and bust. Using the four major market breaks of the twentieth century
as a guide, the market survived each downfall, often gaining additional reg-
ulatory oversight. In 1907 this took the form of a central bank, the Federal
Reserve, established in part to stabilize financial markets. The famous Crash
of 1929 dramatically changed how the government regulates the securities
market with the installment of new market and trading regulations. These
changes were so significant that most form the foundation for current reg-
ulations. More recently, the 1987 crash led to regulators trying to figure out
how to keep ahead of the technology of trading. Their answer was to institute
circuit breakers that stop trading when the markets get too hectic. And after
the recent 2000 downturn, the focus has been on corporate fraud as com-
panies tried to artificially inflate earnings and, therefore, stock prices.
We barely scratched the surface of the stock market’s history. As you might
imagine, a detailed treatment would (and does) fill volumes. The foregoing
provides a glimpse into the development of the U.S. stock market, from its
34 The Stock Market
humble beginnings in the late 1700s to the key institution that it is today.
Not only has the market changed as new technologies came along, but it also
changed as regulators sought to protect investors and establish orderly
markets. In every case, the intention is to provide an avenue by which financial
capital is efficiently distributed. As we will see in Chapter Seven, this is crucial
to maintaining growth of the economy and the well-being of its citizens.
NOTES
1. Robert Sobel, The Big Board: A History of the New York Stock Market (New
York: Free Press, 1965), 20.
2. Ibid.
3. Richard J. Teweles and Edward S. Bradley, The Stock Market, 5th ed. (New
York: John Wiley, 1987), 85.
4. Ibid.
5. Sobel, The Big Board, 81.
6. John Kenneth Galbraith, The Great Crash: 1929 (Boston: Houghton Mifflin,
1955), 12.
7. Cited in Galbraith, The Great Crash, 20.
8. Ibid., 93.
9. Ibid., 43.
10. Ibid., 179.
11. Ibid., 365.
12. Ibid., 96.
13. Ibid., 115.
14. Maggie Mahar, Bull: A History of the Boom, 1982–1999 (New York:
HarperBusiness, 2003), 50.
15. Avner Arbel and Albert E. Kaff, Crash: Ten Days in October Will It Strike
Again? (New York: Longman, 1989), ix.
16. Tim Metz, Black Monday: The Catastrophe of October 19, 1987 and
Beyond (New York: William Morrow, 1988), 74.
17. Ibid., 88.
18. Ibid.
19. Robert T. Parry, ‘‘The October ’87 Crash Ten Years Later,’’ Federal Reserve
Bank of San Francisco Economic Letter 96–332 (1997).
20. Cited in Mahar, A History of the Boom, 72.
21. Dale W. Jorgenson, ‘‘Information Technology and the U.S. Economy,’’
American Economic Review 91, no. 1 (2001): 1–32, 1–2.
22. Robert Hall, ‘‘Struggling to Understand the Stock Market,’’ American
Economic Review 91, no. 2 (2001): 1–11, 1.
23. Cited in Mahar, A History of the Boom, 300.
24. Ibid.
25. Ibid., 272.
A Brief History of the U.S. Stock Market 35
Three
Stocks in Today’s Economy
Stocks are financial securities that represent claims of ownership. A stock-
holder is a partial owner of the firm: the stock represents the investor’s ‘‘pro
rata’’ or proportional ownership of the business. A share of stock gives the
shareholder a right to a pro rata share of the business’s profits or, in the case of
liquidation, the pro rata right to the value of the business’s assets in excess of
its liabilities. There are two ways to view ownership rights. One as a going
concern in which case the stockholder gets a pro rata share of profits and bears
a pro rata share of losses. The second case occurs when the business is liq-
uidating or selling itself off. In this case, the stockholder gets a pro rata share of
any excess in the value of the assets over the liabilities that have been paid off.
A share of common stock also gives the shareholder a right to vote in the
election of the board of directors. It is the board of directors who take an active
role in seeing that all shareholders’ rights are recognized and maximized.
Stocks therefore can be viewed as a contractual arrangement between two
parties, the party investing in the firm and the firm itself. The investor’s will-
ingness to give up money for the stock represents the expectation that they will
receive some future payment that exceeds what they have given up. This
expected gain cannot be exceeded elsewhere. On the other side, the firm
needed the new funds coming from the investor when the stock was issued. It
is willing to agree to turn over at least some of the ownership to the investor in
order to acquire these funds. As such, stock is really a security that represents
an ownership claim.
An important aspect of this claim to the investor is the protection offered
by the corporate structure. Shareholders have limited liabilities; that is, the
maximum that a stockholder can lose is his or her original investment. Should
the corporation fail or be found negligent in some legal manner, shareholders
cannot be called upon to put up more money than they originally invested in
the corporation.
Because a common stock can be viewed from two different perspectives,
that of the firm and that of the investor, it is useful to examine these more
carefully. From the perspective of the firm, why does a firm obligate itself by
issuing common stock? Also, what factors influence the size of the stock
issuance? From the perspective of the investor, why would an investor give up
funds for a pro rata claim on a business? We will examine the different means
by which investors can gain from owning stock.
STOCK AS A FUNDING SOURCE
Why would a business agree to give investors a claim against its future
earnings? The answer is simply that the firm trades partial ownership in order
to use the funds that it gets from the investor. When shares of stock are sold
for the first time, this activity is referred to as an initial public offering (IPO).
In such an offering newly created shares are being sold for the first time. As
economies are growing and opportunities are being presented to exploit new
technologies, businesses often need injections of funds in order to expand.
Issuing stock has been a great source of funds for business growth and
development.
T
HE INITIAL PUBLIC OFFERING (IPO)
An initial public offering is the first time that the general public is given
the opportunity to buy stock and invest in a firm. In addition to being a first
offering, an IPO is a public offering. This means that anyone willing to pay
the asked price for a share is given the right to buy a share of the stock. As a
public offering an IPO must meet and satisfy certain requirements established
by the Securities Exchange Commission (SEC). For example, possible share-
holders must be given a prospectus that defines how the monies invested
will be used and the risk that the investor is likely to face from their invest-
ment.
A firm that offers stock in an IPO usually uses the services of an investment
bank to make sure that the legal requirements are being met, and to make
sure that the stock is properly priced. This latter function ensures such that
there is sufficient investor demand for the offering so that all stock will be
sold. An investment bank is, therefore, simply an intermediary: that is, a go-
between for the firm issuing the stock and the investors buying the stock.
Investment banks frequently have their own investor clients that they initially
sell the IPO stock to. Since the firm is receiving the cash from the IPO, it is in
38 The Stock Market
the firm’s best interest to see that the price it gets for a share of stock is the
maximum possible. Interestingly, research about IPOs generally shows that
IPOs are under-priced when first sold. This is indicated by the fact that many
stocks generally appreciate a small amount on their first day of public trading.
This finding suggests that one could make significant returns by buying
stocks at their IPO and holding them.
S
ECONDARY MARKET TRANSACTIONS
Most investors do not buy stock at their IPO but buy stock from another
investor at some later date. These transactions are secondary market trans-
action. The key difference is that in the secondary market transaction, the firm
for which the stock represents an ownership obligation receives nothing from
the transaction. Unlike an IPO, a secondary market transaction simply rep-
resents an exchange between two investors. One investor is selling the stock
that the other investor is buying. The only significance that this exchange has
to the firm is that it is now notified that one of its shareholders has changed.
The vast majority of transactions involving stocks are secondary market
transactions and not IPOs. The investor makeup is changing on a day-to-day
basis in the U.S. financial system with more and more households owning
stocks. It is becoming rarer, however, that a business is getting a new injection
of funds. This means that as a source of funds for businesses in the United
States, IPOs are relatively less important than, say, business loans from finan-
cial institutions, such as banks, or other financial sources like the commercial
paper market.
When engaged in a secondary market transaction, investors use securities
brokers and dealers to assist in the buying and selling of existing stock. In
other words, an investor who wants to sell stock finds a broker or dealer to aid
in finding someone to buy the stock. Similarly, the buyer of a stock uses a
broker to help find the selling party. Sometimes a buyer uses a dealer who
already owns the stock in their own portfolios. Only IPOs use the services of
an investment bank. Buyers and sellers of existing securities use the service of
brokers and dealers.
S
ECONDARY OFFERINGS
Sometimes a business that already has raised funds through an IPO decides
that it wants to issue more stock and raise additional funds. Perhaps it wishes
to expand its product line or open new stores in other towns. In this case, the
stock offering is referred to as a secondary offering, indicating that the firm has
already offered stock once before. A secondary offering, therefore, is another
Stocks in Today’s Economy 39
source of new funds. However, because more stock is outstanding following
secondary offering, the ownership of the business is spread more widely. It is in
this sense that a secondary offering results in a ‘‘dilution of ownership.’’ If the
firm had ten shares outstanding and chose to issue an additional five shares in
a secondary offering, each shareholder now has a claim to one-fifteenth of the
firm compared with the original claim to one-tenth of the firm. Because of this
effect, the original shareholders (owners) of the firm must approve secondary
offerings. They would be willing to dilute their ownership if they believe the
addition of new funds will expand the business and raise profits. If issuing
more stock allows the firm to better succeed, the value of their one-fifteenth
ownership is expected to exceed the value of their original ownership share.
P
RIVATE PLACEMENT VERSUS PUBLIC STOCK
Common stock is offered either through a private sell or a public auction.
Private sells usually occur when the investors are known beforehand and are
familiar with the managers of the firm. In the case of private sell, the securities
do not have to adhere to as many of the SEC’s rules and regulations. Because
of this, it is generally less expensive to issue a private stock compared with a
public stock.
Privately placed securities, after they have been first issued to investors, are
more difficult to sell in the secondary market than publicly traded stocks.
Because these securities are not publicly listed, the seller will not have the
assistance of an exchange like the New York Stock Exchange (NYSE) in
aiding the sale. Due to this feature, privately placed stocks are perceived as
being much harder to exchange—less liquid—than publicly traded stocks.
There is less certainty what the seller is willing to offer for the stock in the
secondary transaction.
Because of the potential liquidity problems with private stock, many firms
find it worthwhile to go through the process of listing their securities on a
public exchange and registering them with the SEC. Indeed, any corporation
that has more than 500 shareholders is required to register its securities with
the SEC. In this case, the stocks are public stocks and they generally trade on
formal exchanges. Prices of publicly traded stocks generally are widely avail-
able and the transaction costs of buying or selling public stocks are generally
lower than for private stocks.
In this day and age, investors generally focus on publicly traded stocks.
Given the size and importance of the major stock exchanges in the United
States—for instance, the NYSE or the AMEX—most discussion of the stock
market focuses on publicly traded stocks. For example, often-heard measures
40 The Stock Market
of the market value of stock (calculated as the market price of each share times
the number of shares outstanding and summed for all stocks in that partic-
ular market) are based on stocks traded on the major exchanges. Still, there
are many private stock securities in the U.S. financial system that provide
financial capital to smaller businesses. Moreover, even some large corpora-
tions in the United States choose to remain private. There are two advantages
commonly cited for remaining private as opposed to going public. First, as
long as a corporation has less than 500 shareholders it does not have to register
with the SEC. This means that the corporation can save on the large expenses
associated with such registration. In addition to saving registration fees, pri-
vate corporations today are not required to follow the new Sarbanes-Oxley
laws regarding public disclosure of financial information. Third, many private
corporations today laud the fact that their shareholders are not worried about
quarter to quarter changes in the firms’ financial performance. Rather, private
equity shareholders, since they have difficulty selling their investments, are
generally felt to have a longer-term perspective regarding the corporation.
C
OMMON STOCK VERSUS PREFERRED STOCK
Stock is a term used broadly to refer to a security that represents ownership
of a business. There are two different types of such securities. The most com-
mon type is called common stock. Common stock is a security that does not
promise any payments, which are called dividends. While common stocks
frequently pay dividends (many times on a quarterly basis or at least annually)
it is important to understand that the business is not obligated to make such
payments. Indeed, the business can only make dividend payments if all other
obligations are paid first. Preferred stock is different than common stock,
because the firm states a dividend payout rate as an obligation. Owners of pre-
ferred stock generally expect fixed payments coming from the business (div-
idends). These owners also must be paid prior to any common stock dividend
payments.
Individual investors in the United States generally do not own much pre-
ferred stock due to a special tax feature of preferred stock. Any corporation
that owns preferred stock in another corporation pays taxes on 15 percent of
the dividend payment. Individuals who are preferred stockholders do not
enjoy this same advantage, however. Individuals pay taxes on the full divi-
dend payment. Because preferred stock has this tax advantage for corpora-
tions, most preferred stock in the United States is held by other corporations
and not by individual investors. For this reason common stock is much more
prevalent in the U.S. financial system than preferred stock.
Stocks in Today’s Economy 41
STOCK VERSUS BONDS
Owning a stock is an agreement between an investor and a business that is
very different from the agreement provided to bondholders. Bondholders are
not owners of the business; they are debt holders. The business agrees to be
obligated to—indebts itself—bondholders in exchange for receiving funds.
Most bonds offer periodic payments, generally semi-annual, that are called
coupon payments. Coupon payments are obligations of the business and not
making them in the time promised is grounds for entering bankruptcy
proceedings. Unlike stocks, bonds generally have a fixed maturity date that
reflects the date of the last payment, which includes the last coupon payment
and the principal that the business initially borrowed.
So, while bonds represent another source of funds for businesses, there are
important differences between stocks and bonds. Most importantly, the
business is obligated make all necessary payments to bondholders prior to
making any payments to stockholders, including those who own preferred
stock. Also, bonds generally have a fixed maturity, indicating that the
full amount borrowed is to be paid back at a certain future date. Stock, on
Stocks can be traded in all types of industries—from commodities like coffee to
heavy industry, high-tech, and pharmaceuticals. Photo courtesy of Getty Images/
PhotoLink.
42 The Stock Market
the other hand, has no maturity date because it represents continuous own-
ership.
STOCKS AS AN INVESTMENT
A stock is an agreement between a firm and a shareholder who claims some
pro rata ownership of the firm. The firm agrees to this arrangement as a
means of getting new funds to use for expansion or to pay off some of its
existing obligations. The investor parts with their funds because they antic-
ipate to be compensated by way of economic gain from their ownership. The
compensation given to stockholders is generally referred to as a return.
Stockholders realize economic gain in two different forms. First, a prof-
itable business can pay out profits in the form of dividends, even though they
are not required to do so. Most large, well-known corporations make it a
common practice to pay dividends on a regular basis and increase the amount
of dividends paid to shareholders when business is good. Second, investors
gain when the value of their stock appreciates. This is referred to as a capital
gain. If a corporation makes a profit but does not pay it out in the form of a
dividend, then the firm will retain these earnings and the pro rata value of
each shareholder’s ownership increases in value. In the case of publicly traded
stocks, this would show up as rising stock prices. Why? Because more in-
vestors bid up the stock’s price since the firm is now worth more.
D
IVIDENDS AND CAPITAL GAINS
Large corporations in the United States on average pay out less than one-
half of their profits in the form of dividends; they keep the other half in the
form of retained earnings. The practice of paying out dividends can vary
greatly from one firm to another, however. For example, Berkshire Hath-
away, the large corporation run by Warren Buffet, one of the wealthiest
individuals in the country, has made it a practice of not paying out dividends
at all. Shareholders of Berkshire Hathaway stock have received no periodic
payments in the form of dividends over time. They have, however, seen sig-
nificant appreciation in the value of their stock as the corporation plowed
profits back into the firm for new business investments. At the other extreme,
most utilities pay out a fairly large share of their profits to shareholders as
dividends. Their investors often count on the periodic dividend payments,
much the same way that bondholders count on the periodic coupon pay-
ments.
As just described, shareholders can count on gains in one of two ways.
Firms differ as to which strategy they choose to reward shareholders. Because
Stocks in Today’s Economy 43