Báo cáo toán học: " Voice activity detection based on conjugate subspace matching pursuit and likelihood ratio test" pot
Bạn đang xem bản rút gọn của tài liệu. Xem và tải ngay bản đầy đủ của tài liệu tại đây (526.59 KB, 12 trang )
RESEARCH Open Access
Voice activity detection based on conjugate
subspace matching pursuit and likelihood ratio test
Shiwen Deng
1,2
and Jiqing Han
1*
Abstract
Most of voice activity detection (VAD) schemes are operated in the discrete Fourier transform (DFT) domain by
classifying each sound frame into speech or noise based on the DFT coefficients. These coefficients are used as
features in VAD, and thus the robustness of these features has an important effect on the performance of VAD
scheme. However, some shortcomings of modeling a signal in the DFT domain can easily degrade the
performance of a VAD in a noise environment. Instead of using the DFT coefficients in VAD, this article presents a
novel approach by using the complex coefficients derived from complex exponential atomic decomposition of a
signal. With the goodness-of-fit test, we show that those coefficients are suitable to be modeled by a Gaussian
probability distribution. A statistical model is employed to derive the decision rule from the likelihood ratio test.
According to the experimental results, the proposed VAD method shows better performance than the VAD based
on the DFT coefficients in various noise environments.
Keywords: voice activity detection, matching pursuit, likelihood ratio test, complex exponential dictionary
1 Introduction
Voice activity detection (VAD) refers t o the problem of
distinguishing active speech from non-speech regions in
an given audio stream, and it has become an indispensa-
ble component for many applications of speech proces-
sing and m odern speech communication systems [1-3]
such as robust speech recognition, speech enhancement,
and coding systems. Various traditional VAD algorithms
have been proposed based on the energy, zero-crossing
rate, and spectral difference i n earlier literature [1,4,5].
However, these algorithms are easily degraded by envir-
onmental noise.
Recently, much study for improving the performance
of the VADs in various high noise environments has
been carried out by incorporating a statistical model
and a likelihood ratio test (LRT) [6]. Those algorithms
ass ume that the distributions of the noise and the noisy
speech spectra are specified in terms of some certain
parametric models such as comp lex Gaussian [7], com-
plex Laplacian [8], generalize d Gau ssian [9], or general-
ized Gamma distribut ion [10]. Moreover, some
algorithms based on LRT consider more complex statis-
tical structure of signals, such as the multiple observa-
tion likeliho od ratio test (MO-LRT) [ 11,12], higher
order statistics (HOS) [13,14], and the modified maxi-
mum a posteriori (MAP) criterion [15,16].
Most of the above methods are operated in the DFT
domain by classifying each sound frame i nto speech or
noise based on the complex DFT coefficients. These
coefficients are used as features, and thus the robustness
of these features has an important effect on the perfor-
mance of VAD scheme. However, the DFT, being a
method of orthogonal basis expansion, mainly suffers
two serious drawbacks. One is that a given Fourier basis
is not well suited for modeling a wide variety o f signals
such as speech [17-20]. The other is the problem of
spectra components interference between the two com-
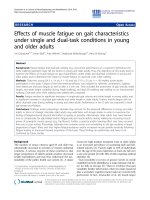
ponents in adjacent frequency bins [19,20]. Figure 1 pre-
sents an example that demonstrates the drawbacks of
the DFT. The DFT coefficients of a signal with five fre-
quency components, 100, 115, 130, 160, and 200 Hz, are
shown in Figure 1a and its accurate frequencies compo-
nents (A, B, C, D, and E) are shown in Figure 1b. As
shown in Figure 1a, first, except these frequenc ies com-
ponents corresponding to the accurate frequencies,
many other frequency components are also emerged in
* Correspondence:
1
School of Computer Science and Technology, Harbin Institute of
Technology, Harbin, China
Full list of author information is available at the end of the article
Deng and Han EURASIP Journal on Audio, Speech, and Music Processing 2011, 2011:12
/>© 2011 Deng and Han; licensee Springer. This is an Open Access article distributed under the terms of the Creative Commons
Attribution License (http://creativecommons.o rg/licenses/by/2.0), which permits unrestricted use, distribution, and reproduction in
any medium, provided the original work is properly cited.
the DFT coefficients all over the whole frequency bins.
Second, there exists the problem of spectra components
interfer ence at a, b, c, and d frequency bins, because the
corresponding accurate frequencies at A, B, C in Figure
1b are too adjacent to each other.
In this article, we present an approach for VAD
based on the conjugate subspace matching pursuit
(MP) and the statistical model. Specifically, the MP is
carried out in each frame by first selecting the most
dominant component, then subtracting its contribution
from the signal and iterating the estimation on the
residual. By subtracting a c omponent at each iteration,
the next component selected in the residual does not
interfere with the previous component. Subsequently,
the coeffici ents extracted in each frame, n amed MP
feature [21], are modeled in complex Gaussian distri-
bution, and the LRT is employed as well. Experimental
results indicate that the proposed VAD algorithm
shows better results compared with the conventional
algorithms based on the DFT coefficients in various
noise environments.
The rest of this article is organized as follows. Section
2 reviews the method of the conjugate subspace MP.
Section 3 presents our proposed approach for VAD
based the MP coefficients and statistical model. Imple-
mentation issues and the experimental results are shows
in Section 4. Section 5 concludes this study.
2 Signal atomic decomposition based on
conjugate subspace MP
In this section, we will briefly review the process of sig-
nal decomposition by using the conjugate subspace MP
[19,20]. The conjugate subspace MP algorithm is
described in Section 2.1, and the demonstration of algo-
rithm and comparison between MP coefficients and
DFT coefficients are presented in Section 2.2.
0 100 200 300 400 500
0
1
2
(a)
Frequency(Hz)
Magnitude
0 100 200 300 400 500
0
1
2
(b)
Frequency(Hz)
Magnitude
A
D
EC
B
a
c
d
b
D
E
Figure 1 Drawbacks of the DFT coefficients. (a) The DFT coefficients of a signal with frequencies: 100, 115, 130, 160, 200 Hz; (b) the accurate
frequency components of the signal.
Deng and Han EURASIP Journal on Audio, Speech, and Music Processing 2011, 2011:12
/>Page 2 of 12
2.1 Conjugate subspace MP
Matching pursuit is an iterative algorithm for deriving
compact signal approximations. For a given signal x Î
R
N
, which can be considered as a frame in a speech, the
compact approximation
ˆ
x
is given by
ˆ
x ≈
K
k=1
α
k
g
γ
k
(1)
where K and {a
k
}
k = 1, ,K
denote the order of decompo-
sition and the expansion coefficients, respectively, and
{g
γ
k
}
k=1, ,K
are the atoms chosen from a dictionary
whose element consists o f complex exponentials such
that
g
i
= Se
jw
i
n
, n =0, , N − 1,
(2)
where i and n are frequency and time indexes, and S
is a constant in order to obtain unit-norm function. The
complex exponential dictionary is denoted as D =[g
1
, ,
g
M
]whereM is the number of dictionary elements such
that M>N. Note that, this dictionary contains the prior
knowledge of the statistical structure of the signal that
we are mostly interested in. Here, the prior knowledge
is that speech is the sum of some complex exponential
with complex weights. And hence, speech can be repre-
sented by a few atoms in dictionary, but noise is not.
The conjugate subspace MP is a method of subspace
pursuit. In the subspace pursuit, the residual of a signal
is projected into a set of subspaces, each of which is
spanned by some atoms from the dictionary, and the
most dominant component in the corresponding sub-
space is selected and subtracted from the residual. Each
of the subspaces in the conjugate subspace MP is the
two-dimensional subspace spa nned by an atom and its
complex conjugate. With the given complex dictionary,
the conjugate subspace MP is operated as follows.
Let r
k
denotes the residual signal after k -1pursuit
iterations, and the initial condition is r
0
= x.Atthekth
iteration, the new residual r
k+1
is given by
r
k+1
= r
k
− 2Re{α
k
g
γ
k
},
(3)
where a
k
is a complex coefficient, Re{·} denotes the
real part of a complex value, and
g
γ
k
is the atom
selected from the dictionary D given by
g
γ
k
=argmax
g∈D
(Re{< g, r
k
>
∗
α
k
}),
(4)
where the superscript * de notes conjugate transpose.
The projection coefficient of the residual r
k
over the
conjugate subspace span {g, g*}, a
k
, is obtained by
α
k
=
1
1 −|c|
2
(< g, r
k
> −c < g, r
k
>
∗
),
(5)
where g* is the complex conjugate of g and c =<g, g*
>is the conjugate cross-correlation coefficient. To obtain
atomic decomposition of a signal, the MP iteration is
continued until a halting criterion is met.
After K iterations, the decomposition of x corresponds
to the estimate
ˆ
x ≈ 2
K
k=1
Re{α
k
g
γ
k
},
(6)
where
{α
k
}
K
k=1
are referred to as the complex MP coef-
ficients of atomic decomposition.
2.2 Demonstration of algorithm and comparison between
MP coefficients and DFT coefficients
In this section, we present an example to demonstrate
the procedure of the decomposition and compare the
MP coefficients with DFT coefficients. Let x[m]bethe
original signal defined by a sum of five sinusoids as fol-
lows
x[m]=
5
i=1
cos(2π mf
i
/F
s
), for m =1,2,
where F
s
= 4, 000 Hz is the sample frequency, and the
frequencies f
1
, f
2
, , f
5
are 100, 115, 130, 160, and 200
Hz, respectively.
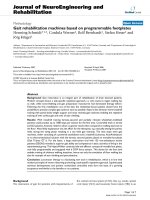
The noisy signal y[m]isgivenbyy[m]=x[m]+n,
where n is the uncor-related additive noise. Figure 2a
shows a 256 sample segment selected by a Hamming
window from y[m], the corresponding DFT coefficients
are shown in Figure 2b,c that shows the accurate fre-
quency components of x[m]. The procedure of the MP
decom position of five iterations is shown in Figure 3. In
each iteration, the component with the maximum of Re
{<g, r
k
>* a
k
} is select ed as shown in the left column in
Figure 3, and, the corresponding a
k
is the MP coeffi-
cient in the kth iteration. The extracted components
2Re{a
k
g
gk
}atthekth iteration is shown in the right col-
umn in Figure 3 and is subtracted from the current resi-
dual r
k
to obtain the next residual r
k+1
according to
Equation (3). After five iterations, we can obtain five
MP coefficients a
1
, , a
5
, whose magnitudes are shown
in Figure 2d.
As shown in Figure 2, the MP coefficients accurately
capture all the frequency components of the original sig-
nal x[m] from the noisy signal y[m], but the DFT coeffi-
cients only capture two frequency components of x[m].
Deng and Han EURASIP Journal on Audio, Speech, and Music Processing 2011, 2011:12
/>Page 3 of 12
On the other hand, the MP coefficients well represent
the frequency components without the problem of the
spectra components interference, such as these compo-
nents at A, B, and C shown in Figure 2d, but the DFT
coefficients fail to do this even in the noise-free case.
Therefore, the MP coefficients are more robust that the
DFT coefficients, and are not sensitive to the noise.
3 Decision rule based on MP coefficients and LRT
In this section, the VAD based on t he MP coefficients
and LRT is presented in Section 3.1. To test the distri-
bution of the MP coefficients, a goodness-of-fit test
(GOF) for thos e coefficients is provided in Section 3.2.
More details about the MP feature are discussed in Sec-
tion 3.3.
3.1 Statistical modeling of the MP coefficients and
decision rule
Assuming that the noisy speech x consists of a clean
speech s and an uncorrelated additive noise signal n,
that is
x = s + n
(7)
Applying the signal atomic decomposition by using
the conjugate MP, the noisy MP coefficient extracted
from x at each pursuit iteration has the following form
α
k
= α
s,k
+ α
n,k
, k =1, , K,
(8)
where a
s,k
and a
n,k
are the MP coefficients of clean
speech and noise, respectively. The varia nce of the noisy
MP coefficient a
k
is given by
λ
k
= λ
s,k
+ λ
n,k
, k =1, , K.
(9)
where l
s,k
and l
n,k
are the variances of MP coefficients
of clean speech and noise, respectively.
The K-dimensional MP coefficient vectors of speech,
noise, and noisy speech are denoted as a
s
, a
n
,anda
with their kth elements a
s,k
, a
n,k
,anda
k
, respectively.
Given two hypotheses H
0
and H
1
, which indicate speech
absence and presence, we assume that
H
0
: α = α
n
H
1
: α = α
n
+ α
s
For implementation of the above statistical model, a
suitable distribution of the MP coefficients is required.
0 50 100 150 200 250
−10
0
10
(a)
sample index
0
1
2
(b)
0
1
2
(c)
0 100 200 300 400 500
0
1
2
(d)
Frequency (Hz)
B
C
D
A
E
B
C
EA
D
C
E
Figure 2 Decompositi on of a noisy signal by DFT and the conjugate subspace MP. (a) The noisy signal; (b) the DFT coefficients of the
noisy signal; (c) the accurate frequency components of the original signal; (d) the MP coefficients of the noisy signal after five iterations.
Deng and Han EURASIP Journal on Audio, Speech, and Music Processing 2011, 2011:12
/>Page 4 of 12
In this article, we assume that the MP coefficients of
noisy speech and noise signal are asymptotically inde-
pendent complex Gaussian random variables with zero
means. We also assume that the variances of the MP
coeffi cient of noise, {l
n,k
, k = 1, , K} are known. Thus,
the probability density functions (PDFs) conditi oned on
H
0
,andH
1
with a set of K unknown parameters Θ =
{l
s,k
, k = 1, , K}, are given by
p(α|H
0
)=
K
k=1
1
πλ
n,k
exp
−
|α
k
|
2
λ
n,k
(10)
p(α|, H
1
)=
K
k=1
1
π(λ
n,k
+ λ
s,k
)
exp
−
|α
k
|
2
λ
n,k
+ λ
s,k
(11)
The maximum likelihood estimate
ˆ
= {
ˆ
λ
s,k
, k =1, , K}
of Θ is obtained by
ˆ
=argmax
{log p(α|, H
1
)},
(12)
and equals
ˆ
λ
s,k
= |α
k
|
2
− λ
n,k
, k =1, , K.
(13)
By substituting Equation (13) into Equation (11), the
decision rule using the likelihood ratio is obtained as
follows
g
=
1
K
log
p(α|
ˆ
O,H
1
)
p(α|H
0
)
=
1
K
K
k=1
|α
k
|
2
λ
nk
− log
|α
k
|
2
λ
nk
− 1
H
1
≥
<
H
0
η
(14)
where h denotes a threshold value.
0
5
10
k−th iteration
−2
0
2
k−th component
0
5
10
−2
0
2
0
5
10
−2
0
2
0
5
10
−2
0
2
0 200 400
0
5
10
Frequency(Hz)
0 100 200
−2
0
2
sample index
k=1
k=2
k=3
k=4
k=5
Figure 3 Five iterations of the MP for a noisy signal. The left column shows each iteration of the MP and the selected component is marked
by a open circles; the right column shows the corresponding signal component extracted at each iteration.
Deng and Han EURASIP Journal on Audio, Speech, and Music Processing 2011, 2011:12
/>Page 5 of 12
3.2 GOF test for MP coefficients
The MP coefficients are considered to follow a Gaussian
distribution in section above. To test this, we carried out
a statistical fitting test for the noisy MP coefficients con-
ditioned on both hypotheses under various noise condi-
tions. To this end, the Kolomogorov-Sriminov (KS) test
[22], which serves as a GOF test, is employed to guaran-
tee a reliable survey of the statistical assumption.
With the KS test, the empirical cumulative distribu-
tion function (CDF) F
a
is compared to a given distribu-
tion function F,whereF is the complex Gaussian
function. Let a ={a
1
, a
2
, , a
N
}beasetoftheMP
coefficients extracted from the noisy speech data, and
the empirical CDF is defined by
F
α
=
⎧
⎪
⎨
⎪
⎩
0, z <α
(1)
n
N
, α
(n)
≤ z <α
(n+1)
,
1, z ≤ α
(N)
n =1, , N
(15)
where a(n), n = 1, , N are the order statistics of the
data a. To compute the order statistics, the elements of
a are sorted and ordered so that a
(1)
represents the
smallest element of a and a
(N)
is the largest one.
For simulating the noisy environments, the white and
factory noises from the NOISEX’92 database are added
to a clean speech signal at 0 dB SNR. With the noisy
speech, the mean and variance are calculated and substi-
tuted into the Gaussian distributio n. Figure 4 shows the
comparison of the empirical CDF and Gaussian func-
tion. As can be seen, the empirical CDF curves of noisy
speech signal are much closed t o that of the Gaussian
CDF under both the white and factory noise conditions.
Therefore, the Gaussian distribution is suitable for mod-
eling the MP coefficients.
3.3 Obtaining MP features
As mentioned before, the DFT coefficients suffer several
shortcomings for modeling a signal and exposing the
signal structure. We use t he MP coefficients,
{α
k
}
K
k=1
,
obtained by the MP as the new feature for discriminat-
ing speech and nonspeech. With the advantage of the
atomic decomposition, MP coefficients can capture the
characteristics of speech [17] and are insensitive to
environment noise. Therefore, the MP coefficients as a
new feature for VAD are more suitable for the classifica-
tion task than DFT coefficients.
With the decomposition of a speech signal by using the
conjugate MP, the MP feature also captures the harmo-
nic structures of the speech signal. Such harmonic com-
ponents can be viewed as a series of sinusoids, which are
buried in noise, with different amplitude, frequency, and
phase. The kth harmonic component h
k
extracted from
the kth pursuit iteration has the following form
h
k
= A
k
cos(ω
k
+ φ
k
)=2Re{α
k
g
γ
k
}
(16)
where A
k
, ω
k
,andj
k
are the amplitude, frequency,
and phase of the sinusoidal component h
k
, respectively.
Those harmonic structures are prominent in a signal
when the speech is present but not when noise only.
In a practical implementation, the procedure for
extracting MP feature is described as follo ws. Assuming
the input signal is segmented into non-overlapping
frames, each frame is decomposed by conjugate sub-
space MP. Thus, the complex MP coefficients of a given
frame are obtained. Instead of requiring a full recon-
struction of a signal, the goal of MP is to extract MP
coefficients. These coefficients capture the most charac-
ters of a signal so that the VAD detector based on them
can detect whether the speech is present or not. Natu-
rally, the selection of iteration number K depends on
the number of sinusoidal components in a speech signal.
4 Experiments and results
4.1 Noise statistic update
To implement the VAD scheme, the variance of the
noise MP coefficients requires to be estimated, which
areassumedtobeknowninEquation(14).Weassume
that the signal consists of noise only during a short initi-
alization period, and the initial noise characteristics are
learned. The background noise is usually non-st ationary,
and hence the estimation requires to be adaptively
updated or tracked. The update is performe d frame by
framebyusingtheminimummeansquareerror
(MMSE) estimation.
Since the signal is frame-processed, we use the super-
script (m) to refer to the mth frame so that
λ
(m)
n,k
and
α
(m)
k
denote l
n,k
and a
k
, respectively. Given the noisy
MP coefficients
α
(m)
k
at the mth frame, the optimal esti-
mate of the variance of the noise MP coefficients
λ
(m)
n,k
under MMSE is given by
ˆ
λ
(m)
n,k
= E(λ
(m)
n,k
|α
(m)
k
)
= E(λ
(m)
n,k
|H
0
)P(H
0
|α
(m)
k
)+E(λ
(m)
n,k
|H
1
)P(H
1
|α
(m)
k
)
(17)
where
E(λ
(m)
n,k
|H
0
)= |α
(m)
k
|
2
(18)
E(λ
(m)
n,k
|H
1
)=
ˆ
λ
(m−1)
n,k
(19)
and
ˆ
λ
(m−1)
n,k
is the estimate in the previous frame.
Based on the total probability theorem and Bayes rule,
the posterior probabilities of H
0
and H
1
given a
k
in
Deng and Han EURASIP Journal on Audio, Speech, and Music Processing 2011, 2011:12
/>Page 6 of 12
(b)
(a)
−
0
.4 −
0
.2
0 0
.2
0
.4
0
0.2
0.4
0.6
0.8
1
C
umulative probability
Empirical CDF
Gaussian
−
0
.4 −
0
.2
0 0
.2
0
.4
0
.
6
0
0.2
0.4
0.6
0.8
1
Cumulative probability
Empirical CDF
Gaussian
Figure 4 Comparison of empirical and Gaussian CDFs of real part of the MP coeff icien t of noisy speech at 0 dB SNR. (a) white noise;
(b) factory noise.
Deng and Han EURASIP Journal on Audio, Speech, and Music Processing 2011, 2011:12
/>Page 7 of 12
Equation 17 are derived as follows
P(H
0
|α
(m)
k
)=
p(α
(m)
k
|H
0
)P(H
0
)
p(α
(m)
k
|H
0
)P(H
0
)+p(α
(m)
k
|H
1
)P(H
1
)
=
1
1+ε
(m)
k
(20)
P( H
1
|α
(m)
k
)=
ε
(m)
k
1+ε
(m)
k
(21)
where ε = P(H
1
) =P(H
0
)and
(m)
k
= p(α
(m)
k
|H
1
)/p(α
(m)
k
|H
0
)
. Since the decision is
made by observing all the K MP coefficients, we replace
the LRT at the kth MP coefficient
(m)
k
with their geo-
metric mean
(m)
g
in Equation (14).
Then the update formula of the variances of noise MP
coefficients is given by
ˆ
λ
(m)
n,k
=
1
1+ε
(m)
g
|α
(m)
k
|
2
+
ε
(m)
g
1+ε
(m)
g
ˆ
λ
(m−1)
n,k
.
(22)
4.2 Experimental results
In this section, the experimental results of our method
are presented. To implement the proposed method, the
dictionary D is the fundamental ingredient for decom-
posing a signal. The atoms of the dictio nary are
generated accordi ng to Equation (2), and the number of
atomsissettobe2N,whereN = 256. Thus, the com-
plex exponential dictionary D is a N ×2N complex
matrix, and is used in the following experiment s. To
demonstrate the ef fectiveness of the proposed VAD, a
test signal (Figure 5b) is created by adding white noise
to a clean speech (Figure 5a) at 0 dB SNR, and is
divided into non-overlapping frames with the frame
length 256. The atomic decomposition based on the
conjugate subspace MP is operated on the test signal.
The likelihood ratios and the results of VAD calculated
with Equation (14) are shown in Figure 5c,d, respec-
tively. As can be seen, even at such a low SNR, the
results also c orrectly indicate the speech presence and
thus verify the effectiveness of MP coefficients in VAD.
The selection of the iteration number K in the MP has
an important effect on the performa nce of the proposed
method and the computational cost. As shown in Figure
6, the performances of the VAD in various K are mea-
sured in terms of the the the receiver operating charac-
terist ic (ROC) curves, which show the trade-off between
the false alarm probability (P
f
) and speech detection
probability (Pd). It is clearly shown that the increasing
of K improves the performance of the VAD. A larger K,
however, implies an increased computational cost. Fig-
ure 7 shows the decrease of the average errors, defined
by P
e
=(P
f
+1-P
d
)=2, against the increase of K in
white, vehicle, and babble noise at 0 dB. The average
errors in three noises remain unchange w hen the value
−
0.5
0
0.5
(a) Clean speech signal
−
0.5
0
0.5
1
(b) Noisy speech signal
0
10
20
(c) Log likelihood ratios for (b)
0.5 1 1.5 2 2.5 3 3.5 4
0
0.5
1
(d) VAD results
Figure 5 Results of the proposed VAD with white noise (SNR = 0 dB and K = 10). (a) Clean speech signal. (b) Noisy speech signal. (c) Log
likelihood ratio for (b). (d) VAD results.
Deng and Han EURASIP Journal on Audio, Speech, and Music Processing 2011, 2011:12
/>Page 8 of 12
0 0.05 0.1 0.15 0.2 0.25 0.3 0.35 0.4
0.75
0.8
0.85
0.9
0.95
1
False Alarm Probability(Pf)
Speech Detection Probability(Pd)
K=15
K=12
K=10
K=5
Figure 6 ROC curves in different selection of iteration number K and other VAD methods in pink noise (SNR = 5 dB).
1 2 3 4 5 6 7 8 9 10 11 12 13 14 15 16 17 18 19 20
10
12
14
16
18
20
22
24
26
28
30
K
Average error (%)
white
vehicle
babble
Figure 7 Average error for speech detection when increasin g the iteration number K in the atomic decomposition in white, vehicle,
and babble noise (SNR = 0 dB).
Deng and Han EURASIP Journal on Audio, Speech, and Music Processing 2011, 2011:12
/>Page 9 of 12
of K is larger than 15. Therefore, a reasonable value of K
isequalto15soastoyieldagoodtrade-offbetween
the computational cost and the performance.
Based on the ROC curves, we evaluated the perfor-
mances of the proposed LRT VAD based on the MP
coefficients (LRT-MP) by comparing with the popular
LRT VADs based on DFT coefficients, including Gaus-
sian (LRT-Gaussian) [7], Laplacian (LRT-Laplacian) [8],
and Gamma (LRT-Gamma) [10]. The test speech mate-
rial used for the comparison is a clean speech of 135 s
connected from 30 utterances selected from TIMIT
database. The reference decisions are made on the clean
speech by labeling manually at every 10 ms frame. To
simulate the noise environments, the noise signal from
NOI-SEX’ 92 database is added to the test speech at 5
dB SNR. For fair comparison, we do not consider any
hang over during the detection, as these can be added
in a heuristic way after the design of the decision rule.
Figures8,9,and10showstheROCcurvesofthese
VADs in the white, vehicle, and babble noise environ-
ments at 5 dB. It was observed that the proposed
approach outperforms other VADs in three noise condi-
tions. These results indicate that the MP coefficients
can captur e harmo nic structure of speech that is insen-
sitive to noise. In more detail, the performances of the
proposed method compared with the LRT-Laplacian,
which has a better performance than the LRT-Gaussian
and LRT-Gamma, are summarized in Table 1, under
white, vehicle, and babble noise conditions. The experi-
mental results show that the VAD based on MP coeffi-
cients outperforms the ones based on the DFT in all of
the testing conditions, and it can be concluded that the
MP coefficients are more robust to background noise
than the DFT.
5 Conclusion
In this article, we present a novel approach for VAD.
The method is based on the complex atomic decompo-
sition of a signal by using the conjugate subspace MP.
With the decomposition, the complex MP coefficients
are obtained, and modeled as the complex Gaussian dis-
tribution which is a suitable one according to the results
of GOF test. Based on the statistical model, the decision
rule for VAD is derived by i ncorporating the LRT on it.
In a practical implementation, the decision is made
frame by frame in a frame-processed signal.
The advantage of the proposed approach is that the
MP coefficients are insensitive to the environmental
noise, and hence the performance of VAD is robust in
high noise environments. Note that, the advantage with
MP coefficients is obtained at the cost of computat ional
cost, which is proportional to the iteration number. An
online detection can be implemented when the iteration
number is smaller than 20. Furthermore, the
0 0.05 0.1 0.15 0.2 0.25 0.3 0.35 0.4
0.7
0.75
0.8
0.85
0.9
0.95
1
False Alarm Probability(Pf)
Speech Detection Probability(Pd)
LRT−MP
LRT−Gaussian
LRT−Laplacian
LRT−Gamma
Figure 8 ROC curves for VADs in white noise (SNR = 5 dB).
Deng and Han EURASIP Journal on Audio, Speech, and Music Processing 2011, 2011:12
/>Page 10 of 12
0 0.05 0.1 0.15 0.2 0.25 0.3 0.35 0.4 0.45
0
0.2
0.4
0.6
0.8
1
False Alarm Probability(Pf)
Speech Detection Probability(Pd)
LRT−MP
LRT−Gaussian
LRT−Laplacian
LRT−Gamma
Figure 9 ROC curves for VADs in vehicle noise (SNR = 5 dB).
0 0.1 0.2 0.3 0.4 0.5
0.5
0.6
0.7
0.8
0.9
1
False Alarm Probability(Pf)
Speech Detection Probability(Pd)
LRT−MP
LRT−Gaussian
LRT−Lalacian
LRT−Gamma
Figure 10 ROC curves for VADs in babble noise (SNR = 5 dB).
Deng and Han EURASIP Journal on Audio, Speech, and Music Processing 2011, 2011:12
/>Page 11 of 12
experimental results show that the proposed approach
outperforms the traditional VADs based on DFT coeffi-
cients in white, vehicle, and babble noise conditions.
Acknowledgements
This study was supported by the Natural Science Foundation of China (No.
61071181 and 91120303).
Author details
1
School of Computer Science and Technology, Harbin Institute of
Technology, Harbin, China
2
School of Mathematical Sciences, Harbin Normal
University, Harbin, China
Competing interests
The authors declare that they have no competing interests.
Received: 29 June 2011 Accepted: 21 December 2011
Published: 21 December 2011
References
1. A Benyassine, E Shlomot, HY Su, D Massaloux, C Lamblin, JP Petit, ITU-T
Recommendation G.729, Annex B: a silence compression scheme for use
with G.729 optimized for V.70 digital simultaneous voice and data
applications. IEEE Commun Mag. 35(9):64–73 (1997). doi:10.1109/35.620527
2. K Itoh, M Mizushima, Environmental noise reduction based on speech/non-
speech identification for hearing aids. Proc Int Conf Acoust, Speech, and
Signal Process. 1, 419–422 (1997)
3. N Virag, Single channel speech enhancement based on masking properties
of the human auditory system. IEEE Trans Speech Audio Process.
7(2):126–137 (1999). doi:10.1109/89.748118
4. K Woo, T Yang, K Park, C Lee, Robust voice activity detection algorithm for
estimating noise spectrum. Electron Lett. 36(2):180–181 (2000). doi:10.1049/
el:20000192
5. M Marzinzik, B Kollmeier, Speech pause detection for noise spectrum
estimation by tracking power envelope dynamics. IEEE Trans Speech Audio
Process. 10(6):341–351 (2002). doi:10.1109/TSA.2002.803420
6. SM Kay, Fundamentals of Statistical Signal Processing. (Prentice-Hall,
Englewood Cliffs, 1998)
7. J Sohn, NS Kim, W Sung, A statistical model-based voice activity detection.
IEEE Signal Process Lett. 6(1):1–3 (1999). doi:10.1109/97.736233
8. JH Chang, JW Shin, NS Kimm, Likelihood ratio test with complex Laplacian
model for voice activity detection. Proc Eurospeech. (Geneva, Switzerland,
2003), pp. 1065–1068
9. JW Shin, JH Chang, NS Kim, Voice activity detection based on a family of
parametric distributions. Pattern Recogn Lett. 28(11):1295–1299 (2007).
doi:10.1016/j.patrec.2006.11.015
10. JW Shin, JH Chang, HS Yun, NS Kim, Voice activity detection based on
generalized gamma distribution. Proc IEEE Internat Conf on Acoustics,
Speech, and Signal Processing 1, 781–784 (2005). Corfu, Greece 17-19
11. J Ramirez, JC Segura, C Benitez, L Garcia, A Rubio, Statistical voice activity
detection using a multiple observation likelihood ratio test. IEEE Signal
Process Lett. 12(10):689–692 (2005)
12. JM Gorriz, J Ramirez, EW Lang, CG Puntonet, Jointly Gaussian PDF-based
likelihood ratio test for voice activity detection. IEEE Trans Speech Audio
Process. 16(8):1565–1578 (2008)
13. J Ramirez, JM Gorriz, JC Segura, CG Puntonet, AJ Rubio, Speech/non-speech
discrimination based on contextual information integrated bispectrum LRT.
IEEE Signal Process Let. 13(8):497–500 (2006)
14. JM Gorriz, J Ramirez, CG Puntonet, JC Segura, Generalized LRT-based voice
activity detector”. IEEE Signal Process Lett. 13(10):636–639 (2006)
15. JW Shin, HJ Kwon, NS Kim, Voice activity detection based on conditional
MAP criterion. IEEE Signal Process Lett. 15, 257–260 (2008)
16. Shiwen Deng, Jiqing Han, A modified MAP criterion based on hidden
Markov model for voice activity detection. Proc Int Conf Acoust, Speech,
Signal Process 5220–5223 (2011). Prague 22-27
17. SG Mallat, Z Zhang, Matching pursuit in a time-frequency dictionary. IEEE
Trans Signal Process.
41(12):3397–3415 (1993). doi:10.1109/78.258082
18. M Goodwin, Matching pursuit with damped sinusoids. Proc IEEE Internat
Conf on Acoustics, Speech, and Signal Processing 3, 2037–2040 (1997).
Munich, Germany 21-24
19. M Goodwin, M Vetterli, Matching pursuit and atomic signal models based
on recursive filter banks. IEEE Trans Signal Process. 47(7):1890–1902 (1999).
doi:10.1109/78.771038
20. MR McClure, L Carin, Matching pursuits with a wave-based dictionary. IEEE
Trans Signal Process. 45(12):2912–2927 (1997). doi:10.1109/78.650250
21. D Shiwen, H Jiqing, Voice activity detection based on complex exponential
atomic decomposition and likelihood ratio test. 20th Int Conf Pattern
Recognition, ICPR 2010. (Istanbul, Turkey, 2010), pp. 89–92
22. RC Reininger, JD Gibson, Distributions of the two dimensional DCT
coefficients for images. IEEE Trans Commun. 31(6):835–839 (1983).
doi:10.1109/TCOM.1983.1095893
doi:10.1186/1687-4722-2011-12
Cite this article as: Deng and Han: Voice activity detection based on
conjugate subspace matching pursuit and likelihood ratio test. EURASIP
Journal on Audio, Speech, and Music Processing 2011 2011:12.
Submit your manuscript to a
journal and benefi t from:
7 Convenient online submission
7 Rigorous peer review
7 Immediate publication on acceptance
7 Open access: articles freely available online
7 High visibility within the fi eld
7 Retaining the copyright to your article
Submit your next manuscript at 7 springeropen.com
Table 1 Performance evaluation in different noise
conditions
Environments LRT-MP LRT-Laplacian
Noise SNR (dB) P
d
(%) P
f
(%) P
d
(%) P
f
(%)
White 0 87.9 10.7 88.7 10.3
5 94.3 9.9 94.2 9.7
10 96.4 9.5 95.8 9.6
20 97.2 9.4 96.8 9.2
Vehicle 0 85.3 10.9 80.3 11.4
5 93.3 10.7 89.7 10.5
10 95.4 9.1 92.5 10.2
20 97.2 8.8 95.2 9.3
Babble 0 63.3 11.1 58.7 11.9
5 79.3 11.1 78.9 11.7
10 84.2 9.3 80.6 10.4
20 87.4 9.1 83.7 9.6
Deng and Han EURASIP Journal on Audio, Speech, and Music Processing 2011, 2011:12
/>Page 12 of 12