Báo cáo toán học: " Aluminium content of selected foods and food products" pptx
Bạn đang xem bản rút gọn của tài liệu. Xem và tải ngay bản đầy đủ của tài liệu tại đây (205.59 KB, 26 trang )
This Provisional PDF corresponds to the article as it appeared upon acceptance. Fully formatted
PDF and full text (HTML) versions will be made available soon.
Aluminium content of selected foods and food products
Environmental Sciences Europe 2011, 23:37 doi:10.1186/2190-4715-23-37
Thorsten Stahl ()
Hasan Taschan ()
Hubertus Brunn ()
ISSN 2190-4715
Article type Research
Submission date 22 July 2011
Acceptance date 28 November 2011
Publication date 28 November 2011
Article URL />This peer-reviewed article was published immediately upon acceptance. It can be downloaded,
printed and distributed freely for any purposes (see copyright notice below).
For information about publishing your research in Environmental Sciences Europe go to
/>For information about other SpringerOpen publications go to
Environmental Sciences Europe
© 2011 Stahl et al. ; licensee Springer.
This is an open access article distributed under the terms of the Creative Commons Attribution License ( />which permits unrestricted use, distribution, and reproduction in any medium, provided the original work is properly cited.
1
Aluminium content of selected foods and food products
Thorsten Stahl
*1
, Hasan Taschan
2
and Hubertus Brunn
3
1
Hessian State Laboratory, Glarusstr. 6, 65203, Wiesbaden, Germany
2
Hessian State Laboratory, Druseltalstraße 67, 34131, Kassel, Germany
3
Hessian State Laboratory, Schubertstrasse 60, 35392, Giessen, Germany
*Corresponding author:
Email addresses:
TS:
HT:
HB:
2
Abstract
For many years aluminium was not considered harmful to human health because
of its relatively low bioavailability. In 1965, however, animal experiments
suggested a possible connection between aluminium and Alzheimer's disease.
Oral intake of foodstuffs would appear to be the most important source of
aluminium. Consequently, the joint FAO/WHO Expert Committee on Food
Additives reduced the provisional tolerable weekly intake value for aluminium from
7 mg kg
−1
body weight/week to 1 mg kg
−1
body weight/week. Analysis of
aluminium content of a number of foods and food products was therefore
undertaken in order to evaluate the nutritional intake of aluminium.
A total of 1,431 samples were analysed within the scope of this study. The data
obtained allow a preliminary but current depiction of the aluminium content of
selected non-animal foods, food products and beverages.
Keywords: aluminium; contamination; food additives; PTWI; TDI.
3
Introduction and objective
Aluminium is the third most abundant element in the earth's crust and is therefore
a natural component of drinking water and foodstuffs and is a component of many
manufactured materials. Exposure of the human body to aluminium may be by
food [1–8] including drinking water, fruit juices wine and beer [9–11], articles of
daily use that are made of aluminium, cosmetics and pharmaceuticals such as
local therapeutic agents, anti-diarrhoeal drugs or antacids. Increased aluminium
exposure can be compensated for by excretion via intestines and normal, healthy
kidneys. Kidney insufficiency was shown to result in increased aluminium
concentrations in the kidneys of dialysis patients, possibly resulting from dialysis
fluids that may contain substantial concentrations of aluminium [12].
For many years, aluminium was not considered a health threat because of its
relatively low bioavailability. In 1965, however, animal experiments suggested a
possible connection between aluminium and Alzheimer's disease, whereby
aluminium salts were injected directly into rabbit brain where they caused tissue
alterations (for a review see [13]). Increased aluminium concentrations were found
in the brains of deceased Alzheimer's patients. Other studies, however, have been
unable to find definite indications supporting the hypothesis that aluminium plays a
causative role in Alzheimer's disease or causes pathological alterations in vivo in
the species studied [14–20].
In the 1970s, the issue of toxicity of aluminium gained importance after Berlyne et
al. (1970) reported on increased aluminium concentrations in the serum of
nephropathic persons [21]. The findings of Alfrey et al. [22] increased concerns
about an increased oral intake of aluminium since these findings were the first to
establish a connection between neurologic diseases of dialysis patients and an
increased intake of aluminium in the organism. In a more recent study aluminium
is also discussed as as an endocrine disruptor in female Nile Tilapia (Oreochromis
niloticus) [23].
Food is unquestionably the main source of aluminium intake, whereby the source
is considered either primary or secondary. The primary content is the natural
content of food caused by uptake from the geologic surrounding during growth and
is for all practical purposes unavoidable. The secondary content is the primary
content plus any possible contamination from aluminium articles that come into
contact with food and additives as well as veterinary drugs, fertilisers and the air.
Table 1 shows the main, permissible secondary aluminium sources that may lead
to an aluminium accumulation in food.
The health safety of aluminium intake has long been a subject of controversial
debate. Table 2 depicts some of the related evaluations published by International
Scientific Committees. In the European Community, the Scientific Committee for
Food of the European Communities (SCF) [24] set the provisional tolerable weekly
intake (PTWI) used by Joint FAO/WHO Expert Committee on Food Additives
(JECFA) for substances that may accumulate in the body) value at 0 to 7 mg kg
−1
body weight per week (Table 2). This occurred in 1990, 1 year after the Joint
FAO/WHO Expert Committee on Food Additives [25] presented their evaluation.
Among various topics considered during its 77th meeting in 1995, JECFA [25]
dealt with the toxicological evaluation of aluminium. The committee reduced the
PTWI value for aluminium from 7 mg kg
−1
body weight per week to 1 mg kg
−1
body
4
weight per week. Additionally, the European Food Safety Authority EFSA set the
weekly aluminium intake to 1 mg kg
-1
body weight in 2008 (Table 2).
On the basis of values obtained from the literature and data from the 1984
German Society of Nutrition Report, Treptow and Askar tried to establish the daily
aluminium intake in the Federal Republic of Germany. The authors estimated the
aluminium intake to be less than 5 mg per day [26]. Treier and Kluthe [27]
analysed 446 foodstuff samples as well as 94 daily meals and determined that
food of plant origin (n = 283) had significantly higher aluminium content than food
of animal origin (n = 163). In a study of Treier [28], an aluminium intake of less
than 5 mg per day and person was found.
Schlegel and Richter [29] reported on the analysis of 451 foodstuffs of different
categories. These authors also determined that the aluminium contents of plant
derived foods were more significant and that processed foods contained more
aluminium than the primary products [29]. Consequently, food was considered to
be increasingly contaminated by aluminium packaging [30–33].
In general, data on the nutritional intake of aluminium in Germany still seems to be
incomplete and is, for the most part, not up to date. In particular, data on the
amounts of foodstuffs that must be ingested to reach the toxicologically tolerable
intake of aluminium is lacking. It was therefore of interest to analyse an extensive
number of foodstuffs for their aluminium content in order to develop a current basis
for the evaluation of the nutritional intake of aluminium.
Material and method
A total of 1,431 samples [65 flours, 37 baking premixes, 107 breads, 60 loaf-
shaped yeast fruit cakes, 38 pastries in aluminium trays, 185 salted pretzels and
similar savoury biscuits, 24 pastas, 12 herb-teas, 37 cocoa powders, 84
chocolates, 115 confectioneries, 50 malts, 237 beers (177 bottled beers, 40
draught beers and 20 canned beers), 59 fruit juices and fruit juice beverages, 65
wines and fruit wines, 31 ready-cooked meals in aluminium trays, 16 soups from
the catering trade, 171 mineral waters and spring waters and 38 diverse products]
were analysed.
The samples which were for the most part from Hessian enterprises (mills,
bakeries) and from the retail market were collected for analysis within the scope of
governmental control and inspection of foodstuffs.
For quantitative determination of aluminium concentration, samples were pre-
treated in accordance with DIN EN 13804 [34] depending upon the physical
properties of the sample. Liquid and powder samples, the homogeneity of which
was considered sufficient according to manufacturing procedures, were shaken in
order to avoid segregation effects and were then dissolved in solvent. Lumpy food
samples were homogenised by means of a Retsch Grindomix GM 200 knife mill
(Retsch, Haan, Germany).
Homogenised compact samples, soups, fruit juices as well as red wines and fruit
wines were solubilised by means of heated-under-pressure microwave dissolution
in accordance with DIN EN 13805 [35]. Samples of one 1 mg were added to 2 ml
of deionised water (18.2 MΩ cm), 3 ml of nitric acid (Merck, 65% Suprapur) and
2 ml of hydrogen peroxide (Merck, 30% Suprapur) as oxidiser. Dissolution for
5
three parallel batches each per sample was made in an Anton Paar Multiwave
3000 microwave digestion system (Anton Paar, Graz-Straßgang, Austria),
whereby the power was increased to 1,000 W after 15 min and maintained for
30 min.
The aluminium concentrations in the dissolution solutions as well as in mineral
waters and white wines that had been acidified with nitric acid were determined by
means of inductively coupled plasma mass spectrometry (ICP-MS), in accordance
with DIN EN ISO 17294 [36]. ICP-MS metering was performed using a Perkin-
Elmer SCIEX ELAN 5000 (PerkinElmer, Waltham, MA, USA) with cross-flow
nebulizer and Scott type spray chamber. For calibration, commercially obtainable
ICP standards by Merck (CertiPUR, Whitehouse Station, NJ, USA) were used.
Standards and samples were diluted with deionised water (18.2 MΩ cm) and high-
purity acids. Rhenium was used as internal standard. Method validation for the
aluminium parameter demonstrated a limit of detection of 0.4 mg kg
−1
(mineral
water 0.1 mg l
−1
). Quality assurance comprised the use of standard reference
materials and comparative inter-laboratory studies.
Quality assurance
Since adequate round-robin testing has not been performed on aluminium in
foodstuffs the validation of the methods was carried out in the following manner.
Validation was performed on material from pretzels. In eleven samples of water
extracted pretzel material (0.5 g/10 ml each) an arithmetic mean of 3.6 mg
aluminium per kilogramme material was determined. TM-28.2 Lake Ontario water
from Environment Canada, Quebec, (47 µg/l) was used a standard reference
additive. A solution containing 0.1 mg/l was added to four of the pretzel extractions
and a solution containing 0.2 mg/l was added to another five extractions. The
following statistical characteristics were determined: limit of detection 0.8 mg/kg,
limit of quantification 2.6 mg/kg, standard deviation of repeatability = 0.4 mg/kg,
relative standard deviation of repeatability (coefficient of variation) 15%, correlation
coeffizient 0.97, recovery 103%.
Using the t-factor method the standard deviation of repeatability was calculated to
represent an uncertainty of measurement of 0.2 mg/kg (95% level) or 0.04 mg/kg
(99% level). These statistical characteristics show that the methods for the
samples to be tested provide excellent accuracy, precision and sensitivity.
Results and discussion
Aluminium compounds may be used as additives in foodstuffs. Additional
contamination can occur through articles that come into contact with food and that
contain aluminium since aluminium is unstable in the presence of acids and bases
if the protective transparent oxide film is damaged, e.g. by fine fissures. Aluminium
concentrations of the samples analysed in this study were between 0.4 and
737 mg kg
−1
or mg l
−1
(Table 3).
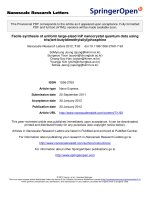
This wide range of concentrations may be due to the effect of important secondary
factors. The relative frequency distribution of all analysed samples is shown in
Figure 1.
Of all the samples, 77.8% had an aluminium concentration of less than
10 mg kg
−1
. Of the samples, 17.5% had aluminium concentrations between 10 and
6
100 mg kg
−1
. In only 4.6% of the samples, aluminium concentrations greater than
100 mg kg
−1
were found.
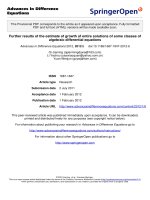
Cereal products
The aluminium concentrations of cereal products (flour, baking premix, bread and
pastries in aluminium trays, salted pretzels and similar savoury biscuits) were
between 1 and 737 mg kg
−1
(Table 3). Figure 2 provides a summary of the relative
frequency distribution of the aluminium contents of all cereal products.
Of these samples, 82% (n = 425) had an aluminium concentration below
10 mg kg
−1
. In 81 samples (20%), an aluminium concentration of 10 to
100 mg kg
−1
was found. Only 2% of the samples (n = 10) had aluminium
concentrations of more than 100 mg kg
−1
. The average aluminium concentration of
the diverse flour products was 4 mg kg
−1
(Table 3).
The baking premixes are ready-to-bake mixtures that are used to make breads or
various pastries after adding liquid and are mainly produced for home use. The
aluminium concentrations of the baking premixes analysed in this study (mainly
ready-to-bake bread flours) were between 1.3 and 737 mg kg
−1
. The median
value, however, was only 6 mg kg
−1
. In three samples, aluminium concentrations
greater than 100 mg kg
−1
were detected. The sample containing 113 mg kg
−1
of
aluminium was a ready-to-bake premix containing nuts. The other two samples
(ready-to-bake pastry flours) with a relatively high aluminium concentration (566
and 737 mg kg
−1
) were baking premixes to which sodium aluminium sulphate had
been added and that were, according to the manufacturer, originally produced for
export but were mistakenly put into circulation in Germany.
The aluminium concentration of the analysed 107 breads was between 1 and
14 mg kg
−1
; 105 samples had aluminium concentrations of less than 10 mg kg
−1
;
only two samples only had concentrations of more than 10 mg kg
−1
(Table 3). As
shown in Table 3, the aluminium concentrations of the pastas analysed in this
study were between 1.4 and 76 mg kg
−1
. Two samples with aluminium
concentrations of 71 and 76 mg kg
−1
were imported products.
The investigation results (1999 to 2006) of the Land of Saxony Control and
Inspection Agency show that 89% (n = 227) of the baking premixes analysed there
had aluminium concentrations of less than 5 mg kg
−1
; the aluminium concentration
of the remaining samples was below 20 mg kg
−1
. Treier [28] determined a mean
aluminium concentration of 1.9 to 2.6 mg kg
−1
for bread and pastry. Thus, the
results obtained in the present study correspond well with those of this previous
study.
The aluminium contents of “pastries in aluminium trays” and “salted pretzels and
similar savoury biscuits” are described under “Articles intended to come into
contact with foodstuffs” subsection due to a possible migration of aluminium from
the trays or the baking trays into these foods.
Herb-tea
The aluminium concentrations of the analysed herb-teas were between 14 and
67 mg kg
−1
(Table 3). The mean value of the concentrations was 40 mg kg
−1
; the
median value was 45 mg kg
−1
.
7
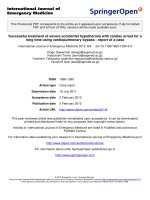
Confectioneries
The comprehensive term confectionery applies to a heterogeneous group of
products mainly containing sugar. They are grouped into hard and soft caramels,
jelly products, chocolates, chocolate articles and others.
Figure 3 summarises the relative frequency distribution of the aluminium contents
of 236 confectioneries analysed in this study (cocoa powders, chocolates and
products containing sugar). The mean value of the concentrations of these
products was 51 mg kg
−1
, the relevant median value was 26 mg kg
−1
(not shown in
Table 3). More than one third of these samples contained aluminium
concentrations greater than 50 mg kg
−1
(Figure 3).
The aluminium contents of the products containing sugar and/or chocolate (bear-
shaped confectionery made of “gummi” substance, “gummi” sticks, soft gums, fruit
gums, sour apple candies, foamed sugar confectionery, etc.) were between 1 and
184 mg kg
−1
(Table 3). Fifty five percent of the samples (n = 62) had less than
10 mg kg
−1
. Thirty six percent had aluminium concentrations between 10 and
50 mg kg
−1
.
In accordance with the German “Additives Admission Regulation” [37] additives
containing aluminium (releasing agents and colour lakes) may be added to such
products. According to the content declarations, additives containing aluminium
were, however, not used in any of the products tested here.
The term cocoa is as a rule used synonymously for cocoa powder and for products
made from the powder. According to the German Cocoa Regulation, cocoa
powder is a product made of roasted cocoa beans ground to powder, purified and
pared containing at least 20% cocoa butter in the dry matter and not more than 9%
water. Cocoa powder can be low in fat or fatless. Cocoa powders were found to
have higher aluminium concentrations than almost all of the other foodstuffs
analysed in this study (Table 3). The mean aluminium concentration of the
products was 165 mg kg
−1
, the median value was 160 mg kg
−1
. Since aluminium-
containing additives are not allowed to be added to cocoa powder, these values
are assumed to be the result of the natural substance in the growing soil. A certain
accumulation during production through aluminium utensils and processing
equipment cannot, however, be excluded.
Chocolate is a product made of cocoa products and sugars that contains a
minimum of 35% total cocoa dry matter of which at least 18% is made up of cocoa
butter and at least 14% non-fat cocoa solids. The chocolates analysed in this
study are products with varying proportions of cocoa. Considering the aluminium
levels found in cocoa, the determined aluminium values can be attributed to the
cocoa portion. Contamination caused by aluminium utensils and production
equipment cannot, however, be excluded. In summary, cocoa powder and
chocolate count amongst those foods that showed the highest aluminium
concentrations found in this study (Table 3). Schlegel and Richter [29] analysed
ten cocoa and chocolate samples and found between 50 and 150 mg kg
−1
aluminium concentrations [29] which is within the same range as the values found
in the present study.
8
Malt, beer, mixed beverages containing beer
As shown in Table 3, aluminium concentrations of the malt samples analysed in
this study were between 0.4 and 12 mg
−1
kg. The bottled, canned and draught
beers examined here revealed aluminium concentrations between 0.4 and
4.2 mg l
−1
, with a mean value of 0.5 mg l
−1
and a median value was 0.4 mg l
−1
.
Aluminium concentrations of the bottled, canned and draught beers varied so
slightly that an examination of statistically significant differences of the aluminium
contents was dispensed with.
Schlegel and Richter [29] analysed 30 beers and determined aluminium
concentrations of less than 1 mg l
−1
. Jorhem et al. [38] and Müller et al. [39]
demonstrated that there was virtually no difference in aluminium content between
beverages in cans and beverages in glass bottles. These authors also reported
aluminium values of below 1 mg l
−1
.
Seruga et al. [32] reported that the aluminium contents of seven analysed soft
drinks (two cola, two orange, two lemons, one tonic) in aluminium cans increased
over a duration of 12-months storage time. The authors attribute this to the low pH
value (pH = 2.80 to 3.20) of these beverages. The values determined every month
by these authors show, however, comparably low aluminium concentrations
between 0.04 mg l
−1
and 0.8 mg l
−1
after 12 months at the maximum. Seruga et al.
[33] established that after expiration date canned beers contained more aluminium
than bottled beers. Aluminium concentrations of canned beers and of bottled beers
were, however, determined to be less than 1 mg l
−1
. Modern aluminium cans are
stove-enamelled inside and seams are provided with an additional layer of
protecting lacquer. The minimal increase of aluminium content of beverages in
cans must be attributed to the high quality of the cans used. This may be assumed
to be the reason for the low contents of aluminium in beverages in aluminium
cans. Modern beer kegs and draught installations are made of stainless steel with
plastic pipes. Accordingly, aluminium concentrations of less than 0.5 mg l
−1
were
determined for draught beers in the present study.
Fruit juice, fruit wine and wine
The aluminium content found was below 5 mg l
−1
for most fruit juices and fruit juice
beverages, but three samples (one sour cherry nectar and two apple juices)
showed aluminium concentrations of 19 to 47 mg l
−1
. According to generally
accepted standards in Germany [40], the aluminium concentration of fruit juices
should not be greater than 8 mg l
−1
.
Section 13, subsection 1 number 2 of the German Wine Regulation [41], states
that wines may have a maximum aluminium concentration of 8 mg l
−1
. Only one of
the wines analysed in this study had an aluminium concentration that exceeded
that limit (14.7 mg l
−1
). The aluminium concentrations of the remaining samples
were below 6 mg l
−1
(Table 3). The arithmetic mean value of the concentrations
was 2 mg l
−1
. The median value was 1 mg l
−1
.
Mineral water
A total of 171 samples were analysed for their aluminium content. As shown in
Table 3, aluminium concentrations of the mineral and spring waters were far below
the permissible limit for drinking water of 0.2 mg l
−1
(Table 3).
9
Diverse foodstuffs
These are samples of various foodstuffs such as soy products, food supplements,
baby food, tomato pulp, dietary foods, etc. The aluminium concentration of baby
food (dry powder, not prepared for immediate consumption) was below 5 mg kg
−1
.
The “tomato pulp” samples had an aluminium concentration of 1.5 to 15 mg kg
−1
.
The aluminium concentration of dietary foodstuff products was between 1 and
53 mg kg
−1
. One “soy product” sample had an aluminium concentration of
138 mg kg
−1
.
Articles intended to come into contact with foodstuffs
Aluminium trays, aluminium baking trays and aluminium cans for beverages fall
under this category. These articles, as defined by the Food and Feedstuffs Law as
well as by Regulation (EC) No. 1935/2004 are materials and objects destined to
come in contact with foodstuffs or already in contact with foodstuffs [41].
As shown in Figure 4, 62 food samples in aluminium trays (91%; cakes to be
consumed without further preparation and prepared ready-to-serve meals with
various ingredients) had an aluminium concentration below 10 mg kg
−1
. Six
products (9%) contained aluminium in concentrations between 10 and 15 mg kg
−1
.
The mean value of the aluminium concentrations in these foodstuffs was
4 mg kg
−1
. The relevant median value was 2 mg kg
−1
.
According to the results of in this study, the aluminium contents of foods in
aluminium packaging (beverages, cakes and various ready-to-serve meals) are so
small that one must draw the conclusion that migration of aluminium from the
packaging into the food can be ignored.
Based on the results of this study, it might even be worth considering the
possibility of coating certain packaging (e.g. for milk and milk products, juices and
other beverages) with aluminium in order to avoid the migration of heavy metals,
additives from packaging materials and printing colours into the foodstuffs. By
using aluminium trays or foils, the development of unwanted substances, such as
3-monochlorpropandiol or polycyclic aromatic hydrocarbons, e.g. during
barbecuing, might be avoidable.
Aluminium baking trays, like aluminium cans and trays, also belong to the class of
materials referred to as articles intended to come into contact with foodstuffs.
According to section 31 of the German Food and Feedstuffs Law (2005) it is
prohibited to use such objects as intended to come into contact with foodstuffs that
do not meet the requirements of Regulation (EC) No. 1935/2004. The use of
aluminium baking trays would therefore be inadmissible if aluminium can migrate
to brined dough and/or salted pretzels and similar savoury biscuits.
In the present study, 185 salted pretzel samples from Hessian bakeries were
analysed for their aluminium contents (Table 3) and were found to be between 1
and 218 mg kg
−1
. A total of 148 samples (81%) had aluminium concentrations
below 10 mg kg
−1
. In 37 samples (19%), aluminium concentrations between 10
and 218 mg kg
−1
were found (Table 3). According to generally accepted standards,
aluminium concentration of such products as a rule should be below 10 mg kg
−1
.
This can be readily achieves since migration is technically avoidable by Teflon
coating or the use of baking paper.
10
Sixteen soup products (ten ready-for-consumption soups from the Asian catering
trade and six dry soups) were analysed. The aluminium concentrations of the
ready-for-consumption soups were between 1 and 4 mg kg
−1
; the dry soups had
aluminium concentrations between 5 and 15 mg kg
−1
. These results suggest that
migration of aluminium from cookware as well as from packing into the food may
be ignored.
Evaluation of a tolerable weekly intake
The results obtained by the present study do not allow a final evaluation of the
PTWI of 1 mg Al kg
−1
body weight (Table 2) since only foodstuffs of plant origin
and beverages were analysed within the scope of this study. Table 4 shows the
percentage of the PTWI acquired for adults (70 kg) and children (30 kg) in
Germany. These values are based on the weekly uptake in foods, wherever
useable data or studies were available, as well as the median and arithmetic mean
of aluminium content. Due to the comparatively low aluminium content of
beverages, these were disregarded. Table 4 shows that the PTWI for aluminium
can be reached only by consumption of large amounts of chocolate [42–44].
In Table 5, the amounts of various foods that would need to be consumed to reach
the PTWI values of 70 mg per week (adults) and of 30 mg per week (children) are
summarised on the basis of the median, lowest and maximum aluminium
concentration (see also Table 4). For adults, the PTWI value would thus be
reached in the event of an average weekly consumption (median value) of, e.g.
1,795 g of chocolate and for children 772 g of chocolate. On the basis of the
maximum aluminium content of chocolate, the PTWI for adults would be reached
after a weekly consumption of 467 g and for children of only 201 g. To reach the
PTWI value of 70 mg per week (adults) and of 30 mg per week (children), the
weekly consumption of bread would have to be on an average of 5 kg (adults) and
2.15 kg (children).
The data obtained in the present study allow a preliminary but current description
of contamination by aluminium through selected foods of plant origin as well as
beverages. For these foods, the amount consumed to reach the PTWI could be
calculated and possible consumer risks could be shown (Table 4). Other groups of
foodstuffs such as tea, coffee, meat, meat products and fish as well as milk and
milk products which may contribute to an aluminium intake will be analysed for
their aluminium contents by our laboratory. This will allow a more accurate
description of the intake of aluminium through nourishment based on the per
capita consumption and will make possible a calculation of the amounts of various
foods that must be consumed to reach the PTWI.
Competing interests
The authors declare that they have no competing interests.
Authors' contributions
TS performed the data calculations, participated in its coordination and drafted the
manuscript, HT participated in the study design and coordination, HB conceived of
the study, and participated in its design and coordination. All authors read and
approved the final manuscript.
11
References
[1] Saiyed SM, Yokel RA: Aluminium content of some foods and food
products in the USA, with aluminium food additives. Food Addit Contam 2005,
22(3):234–244.
[2] Ieggli CV, Bohrer D, Do Nascimento PC, De Carvalho LM: Flame and graphite
furnace atomic absorption spectrometry for trace element determination in
vegetable oils, margarine and butter after sample emulsification. Food Addit
Contam Part A Chem Anal Control Expo Risk Assess 2011, 28(5):640–648.
[3] López FF, Cabrera C, Lorenzo ML, López MC: Aluminium content of
drinking waters, fruit juices and soft drinks: contribution to dietary intake.
Sci Total Environ 2002, 292(3):205–213.
[4] Jalbani N, Kazi TG, Arain BM, Jamali MK, Afridi HI, Sarfraz RA: Application of
factorial design in optimization of ultrasonic-assisted extraction of aluminum
in juices and soft drinks. Talanta 2006: 70(2):307–314.
[5] Turhan S: Aluminium contents in baked meats wrapped in aluminium foil.
Meat Science 2006, 74(4):644–647.
[6] Ranau R, Oehlenschläger J, Steinhart H: Aluminium levels of fish fillets
baked and grilled in aluminium foil. Food Chem 2001, 73:1–6.
[7] Verissimo J, Gomes O, Gomes M: Leaching of aluminum from cooking
pans and food containers. Sensor Actuator B 2006, 118(1–2):192–197.
[8] Neelam MS, Kaladhar M: Risk of increased aluminium burden in the Indian
population: contribution from aluminium cookware. Food Chemistry 1999,
70:57–61.
[9] Abercrombie DE, Fowler RC: Possible aluminium content of canned drinks. Tox
Industr Health 1997, 13:649–654.
[10] Francisco F, López CC: Aluminium content of drinking waters, fruit juices
and soft drinks: contribution to dietary intake. Sci Total Environ 2002,
292(3):205–213.
[11] Federal Institute for Risk Assessment: (2008). Aluminium in apple juice:
Fruit juice should not be stored in aluminium tanks. Health Evaluation No.
034/2008, 18 June 2008.
[12] Krüger G, Morris T, Suskind R, Widner E: The health effects of aluminium
compounds in mammals. CRC Crit Rev Toxicol 1984, 13(1):1–24.
[13] European Aluminium Association: Does aluminium play a role in
Alzheimer's Disease? [www.alufoil.org] 2001.
[14] Rickenbacher U: Toxikologie von Aluminiumverbindungen. Mitteilung aus
Lebensmitteluntersuchung und Hygiene 1984, 75:69–76.
12
[15] Rogers MA, Simon DG: A preliminary study of dietary aluminium intake
and risk of Alzheimer's disease. Age Ageing 1999, 28(2):205–209.
[16] Cunat L, Lanhers MC, Joyeux M, Burnel D: Bioavailability and
intestinalabsorption of aluminum in rats: effects of aluminum compounds
and some dietary constituents. Biol Trace Elem Res 2000, 76:31–55.
[17] Federal Institute for Risk Assessment: No danger of Alzheimers from
aluminium utensils - updated health risk evaluation Nr. 033/2007 des BfR -
December 13th 2005
[18] Robert AY, Florence RL: Aluminum bioavailability from the approved food
additive leavening agent acidic sodium aluminum phosphate, incorporated
into a baked good, is lower than from water. Toxicology 2006, 227(1–2):86–93.
[19] Perl DP, Moalem S: Aluminum and Alzheimer's disease, a personal
perspective after 25 years. J Alzheim Dis 2006, 9(3):291–300.
[20] European Food Safety Authority: On the Evaluation of a new study related
to the bioavailability of aluminium in food. EFSA Journal 2011, 9(5):1–16.
[21] Berlyne GM, Ben-Ari J, Pest D, Weinberger J, Stern M, Levine R, Gilmore
GR: Hyperaluminaemia from Al resins renal failure. Lancet 1970, 2(7671):494–
496.
[22] Alfrey AC, Legendre GR, Kaehyne WD: The dialysis encephalopathy
syndrome. Possible aluminium intoxication. New Engl J Med 1976, 294:184–188.
[23] Correia TG, Narcizo AM, Bianchini A, Moreira RG: Aluminuim as an
endocrine disruptor in femal nile tilapia (Oreochromis niloticus). Comp
Biochem Physiol 2011, 151:461–466.
[24] SCF (2011): Scientific Committee for Food of the European Communities
[
[25] JECFA (2011). Joint FAO/WHO Expert Committee on Food Additives
[
[26] Treptow H, Askar A: Ernährungsbedingte Aufnahme von Aluminium
durch die Bevölkerung der Bundesrepublik Deutschland. Ernährungsumschau
1987, 34:364–367.
[27] Treier S, Kluthe R: Aluminiumgehalte in Lebensmitteln. Ernährungsumschau
1988, 35:307–312.
[28] Treier S: Zur Frage der Aluminium-Aufnahme aus Lebensmitteln und
Pharmaka. Inauguraldissertation am Fachbereich Ernährungs- und
Haushaltwissenschaften, der Universität Giessen; 1989.
[29] Schlegel B, Richter O: Aluminium in Lebensmitteln. Lebensmittelchemiker
Mitteilungen 1997, 2:14–16.
13
[30] Grimm HU: Die Ernährungslüge. München: Verlagsgruppe Droemer Knaur
GmbH & Co. KG; 2003.
[31] Grimm HU: Echt Künstlich, Das Dr. Watson-Handbuch der
Lebensmittelzusatzstoffe, Chemie im Essen kann Ihre Gesundheit gefährden.
Stuttgart, Dr. Watson Books; 2007.
[32] Seruga M, Grgic J, Mandic M: Aluminium content of soft drinks from
aluminium cans. Zeitschrift für Lebensmittel Untersuchung und Forschung 1994,
198(4):313–316.
[33] Seruga M, Grgic J, Grgic Z, Serufa B: Aluminium content of beers.
Zeitschrift für Lebensmittel Untersuchung und Forschung 1997, 204:221–226.
[34] DIN EN 13804: Lebensmittel - Bestimmung von Elementspuren -
Leistungskriterien, allgemeine Festlegungen und Probenvorbereitung; Deutsche
Fassung EN 13804. Köln: Beuth Verlag; 2002
[35] DIN EN 13805: Lebensmittel - Bestimmung von Elementspuren -
Druckaufschluss; Deutsche Fassung EN 13805: Köln: Beuth Verlag; 2002
[36]DIN EN ISO 17294-1: Anwendung der induktiv gekoppelten Plasma-
Massenspektrometrie (ICP-MS) - Teil 1: Allgemeine Anleitung (ISO 17294-
1:2004); Deutsche Fassung EN ISO 17294-1: Köln: Beuth Verlag; 2006
[37] ZZulV: Regulation concerning the approval of food additives for technological
purposes (Food Additive Approval Regulation); 1998
[38] Jorhem L, Haegglund G: Aluminium in foodstuffs and diets in Sweden.
Zeitschrift für Lebensmittel Untersuchung und Forschung 1992, 194(1):38–42.
[39] Müller JP, Steinegger A, Schlatter C: Contribution of Aluminium from
Packing Materials and Cooking Utensils to the Daily Aluminium Intake.
Zeitschrift für Lebensmittel Untersuchung und Forschung 1993, 197(4):332–341.
[40] ALS: Expert advisory group for food chemistry of the Federal States of
Germany and the Federal Office of Consumer Protection and Food Safety
(BVL). J Verbr Lebensm 2007, 2: 439–444.
[41] Meyer AH: Lebensmittelrecht. Textsammlung. München: C.H. Beck; 2009
[42] Max Rubner Institute - Federal Research Institute for Nutrition and Food:
The National Consumption Study Part 2, Nationwide survey on nutrition of youth
and adults; 2008.
[43] Himmerich S, Gedrich K, Karg G: Bavarian Consumption Study (BVS) II
final report - by order of the Bavarian State Ministry of the Environment,
Health and Consumer Protection; 2003.
[44] Federal Institute for Risk Assessment (2007). Federal Institute for Risk
Assessment suggests introduction of a maximum cadmium level in chocolate.
Advisory opinion No. 015/2007. 31 January 2007
14
Table 1. Permissible secondary aluminium sources
Regulation Designation Permitted
concentration
Admitted for
E 561 Vermiculi Mg Al Fe silicate All feedstuffs
E 554 Na Al silicate All feedstuffs
E 559 Kaolinite clay containing Al
silicate
All feedstuffs
Feedstuffs
Regulation
E 599 Perlite Na Al silicate 50,000 mg/kg
a
In mineral feedstuffs only
E 173 Aluminium
Aluminium salts of all other colours
Drug colouring
regulation
Aluminium distereate All animals for food
production
Aluminium hydroxy acetate
Aluminium phosphate
Aluminium tristereate
Aluminium trisalicylate
Magnesium aluminium silicate
Animal drug
residues regulation
Aluminium hydroxide
Cosmetics
regulation
Some particular aluminium
compounds only are forbidden or
subject to limited admission
Ecology regulation Aluminium calcium phosphate As fertiliser/soil
improvement agent
Aluminium hydroxide White burning agent
Aluminium oxide Material for filters
Aluminium sulphate Material for filters
Aluminium oxide Material for filters
Aluminium Material for filters
Tobacco regulation
Aluminium potassium sulphate Chewing tobacco
Drinking water
regulation.
Aluminium 0.2 mg/l
b
Wine regulation. Aluminium 8 mg/l
c
Wine and other products
Food additives
admission
E 173 Aluminium qs* Coverings of sugar
confectionery for cake
decoration, pastries
E 520 Aluminium sulphate 30 mg/kg
d
Egg white
E 521 Aluminium sodium sulphate
E 523 Aluminium ammonium
sulphate
200 mg/kg
d
expressed as
aluminium
Candied, crystallized
crystallised and glazed fruit
and vegetables
E 541 sodium aluminium
phosphate, acidic
1,000 mg/kg
d
expressed as
aluminium
Fine bakery wares (scones
and sponge wares only)
15
aluminium
E 554 Sodium aluminium silicate 10 g/kg
d
Sliced or grated hard, semi-
hard and processed cheese
E 556 Calcium aluminium silicate 30 g/kg
d
Spices
E 556 Calcium aluminium silicate 30 g/kg
d
Products for the greasing of
baking trays
E 559 Aluminium silicate As required Confectionery excluding
chocolate (surface
treatment only)
E 555 Aluminium potassium silicate As required Dye for colouring of Easter
eggs
a
Feedstuffs Regulation (FuttMV 1981) Full citation: “Feedstuffs regulation in the version introduced on 24 May,
2007 (BGBl. I S. 770), that was last amended by Article 1 of the regulation from December 20th, 2010 (eBAnz
2010 AT135 V1)”, Germany.
b
Regulation concerning the quality of water for human usage (Drinking Water
Regulation - TrinkwV 2001), Germany.
c
Wine Regulation (WeinV 1995), Full citation:“Wine regulation in the
version introduced on 21 April, 2009 (BGBl. I S. 827), that was last amended by article 4 of the regulation from
March 28th, 2011 (BGBl. I S. 530) ”, Germany.
d
Additive Regulation (ZVerkV 1998), Full citation: “Additive
regulation from 29 January, 1998 (BGBl. I S. 230, 269), that was last amended by article 2 of the regulation
from March 28th, 2011 (BGBl. I S. 530)”, Germany.
16
Table 2. Evaluation of aluminium and aluminium compound intake from
foodstuffs
International Body Evaluation
JECFA 1970 Aluminium silicate
Sodium aluminium
silicate
No limit
JECFA 1978 Aluminium (metal) for
surface colouring
Not considered to
present a hazard
JECFA 1982 Sodium aluminium
phosphate (acidic and
basic)
Preliminary ADI value 0 to
0.6 mg Al/kg/bw/day
JECFA 1986/87 Aluminium salts
(additives)
Preliminary ADI value 0 to
0.6 mg Al/kg/bw/day
JECFA 1986/87 Calcium aluminium
silicate
ADI (group ADI for
SiO
2
and silicates)
Not specified
JECFA 1989 Aluminium
(foodstuffs incl.
additives)
PTWI 0 to
7 mg Al/kg/bw/week
SCF 1990 Aluminium
(all sources)
PTWI 0 to
7 mg Al/kg/bw/week
JECFA 2007 Aluminium
(all sources)
PTWI
1 mg Al/kg/bw/week
SCF 2008 Aluminium
(all sources)
PTWI
1 mg Al/kg/bw/week
JECFA, Joint FAO/WHO Expert Committee on Food Additives [25]; ADI, acceptable daily intake,
PTWI, provisional tolerable weekly intake; SCF, Scientific Committee for Food of the European
Communities [24].
17
Table 3. Aluminium in foodstuffs (milligrammes per kilogramme or milligrammes per litre)
Product Number Minimu
m
Maximum Mean
value
a
Median
value
Flour 65 1 19 4 3
Baking premix 37 1 737 51 6
Bread 107 1 14 3 2
Loaf-shaped yeast fruit cakes 60 3 22 10 9
Fine bakery wares in aluminium trays 38 1 537 19 3
Salt pretzels and similar savoury biscuits 185 2 218 13 4
Pasta 24 1 76 10 4
Herb-teas 12 14 67 40 45
Cocoa powder 37 80 312 165 160
Chocolate 84 6 150 48 39
Confectionery 115 1 184 17 8
Malt 50 1 12 7 7
Beer and mixed drinks containing beer,
draught beer
237 0.4 4.2 0.5 0.4
Fruit juice and fruit juice drinks
59 0.4 47 3 1
Wine and fruit wine 65 0.4 15 2 1
Mineral water, spring water and table
water
171 0.1 0.07 0.01 0.006
Ready-cooked meals in aluminium trays 31 1 13 3 1
Soups 16 1 15 5 3
Diverse products 38 1 138 16 7
Total 1,431 n.n. 737 19 2
a
Arithmetic mean
1
Table 4. Percent of the PTWI through uptake of aluminium for adults (70kg) and children (30kg)
Product Average
daily intake
[kg]
Average
weekly
intake [kg]
a
Average
weekly Al
uptake
[mg]
b
Percent
PTWI
acquired
adult
[%]
b
Percent
PTWI
acquired
child
[%]
b
Average
weekly Al
uptake
[mg]
c
Percent
PTWI
acquired
adult
[%]
c
Percent
PTWI child
[%]
c
Bread
d
0.178 1.246 3.74 5.34 12.46 2.49 3.56 8.31
Bread
e
0.133 0.931 2.79 3.99 9.31 1.86 2.66 6.21
Fine bakery wares in aluminium trays
f
0.058 0.406 7.71 11.02 25.71 1.22 1.74 4.06
Fine bakery wares in aluminium trays
g
0.045 0.315 5.99 8.55 19.95 0.95 1.35 3.15
Salt pretzels and similar savoury biscuits
h
0.110 0.767 9.97 14.25 33.24 3.07 4.38 10.23
Pastas
i
0.067 0.469 4.69 6.70 15.63 1.88 2.68 6.25
Pastas
j
0.052 0.364 3.64 5.20 12.13 1.46 2.08 4.85
Cocoa powder
k
0.002 0.015 2.53 3.62 8.44 2.45 3.51 8.18
Chocolate
l
0.019 0.133 6.38 9.12 21.28 5.19 7.41 17.29
Chocolate
m
0.065 0.455 21.84 31.20 72.80 17.75 25.35 59.15
Confectionery
n
0.021 0.147 2.50 3.57 8.33 1.18 1.68 3.92
Confectionery
o
0.026 0.182 3.09 4.42 10.31 1.46 2.08 4.85
Ready-cooked meals in aluminium trays
p
0.028 0.193 0.58 0.83 1.93 0.19 0.28 0.64
Percent of the PTWI through uptake of aluminium for adults (70 kg) and children (30 kg) based on the median and arithmetic mean.
a
Calculated by multiplying the
average daily uptake (column 2) by a factor of 7.
b
Calculated on the basis of the arithmetic mean - see Table 3.
c
Calculated on the basis of the Median - see Table 3.
d
Men [42].
e
Women [42].
f
Based on an average consumption of males 13 to 64 years in age per year in Germany under the assumption that all fine baking goods
2
were packaged in aluminium containers [43].
g
Based on an average consumption of females 13 to 64 years in age per year in Germany under the assumption that
all fine baking goods were packaged in aluminium containers [43].
h
Based on the USA with an average yearly consumption of 40 kg
(
i
Based on an average consumption of males 13 to 64 years in age per year in Germany [43].
j
Based on an average
consumption of females 13 to 64 years in age per year in Germany [43].
k
Based on Germany with an average yearly comsumption of 0.8 kg Verzehr.
(
l
Based on normal consumption [44].
m
Based on high consumption [44].
n
Based on an
average consumption of males 13 to 64 years in age per year in Germany [43].
o
Based on an average consumption of females 13 to 64 years in age per year in
Germany [43].
p
Assuming a per-person consumption in Germany in 2010 of 40.2 kg frozen food 25% of which was frozen in aluminium trays.
(
1
Table 5. Consumption of various foods required to achieve the PTWI values adults and
children
Adults Children
Weekly consumption (g) Weekly consumption (g)
Product Minimum
a
Maximum
b
Median
value
c
Minimum
a
Maximum
b
Median
value
c
Bread 70,000 5,000 35,000 30,100 2,150 15,050
Fine bakery wares in aluminium
trays
70,000 130 23,333 30,100 56 10,033
Salt pretzels and similar savoury
biscuits
35,000 321 17,500 15,050 138 7,525
Pastas 70,000 921 17,500 30,100 396 7,525
Cocoa powder 875 224 438 376 96 188
Chocolate 11,667 467 1,795 5,017 201 772
Confectionery 70,000 380 8,750 30,100 164 3,763
Ready-cooked meals in aluminium
trays
70,000 5,385 70,000 30,100 2,315 30,100
Consumption of various foods required to achieve the PTWI values of 70 mg/week (adults) and of
30 mg/week (children) on the basis of the median, the lowest and the maximum aluminium
concentration.
a
Would have to be consumed weekly on the basis of the lowest aluminium
concentration, see Table 3.
b
Would have to be consumed weekly on the basis of the highest
aluminium concentration, see Table 3.
c
Would have to be consumed weekly on the basis of the
median value, see Table 3.
2
Figure captions
Figure 1. Relative frequency distribution of the aluminium content of foodstuffs (n = 1,431).
Figure 2. Relative frequency distribution of the aluminium content in cereal products. Baking
premixes, breads, pastries, salt pretzels and similar savoury biscuits (n = 516)
Figure 3. Relative frequency distribution of the aluminium content in confectionery. Cocoa
powder, chocolate and confectionery (n = 236).
Figure 4. Aluminium in cakes and ready-to-serve meals in aluminium trays (n = 68).
77,9%
8,4%
5,5%
3,6%
4,6%
0,0
10,0
20,0
30,0
40,0
50,0
60,0
70,0
80,0
frequency distribution %
<10 10-20 20-50 50-100 >100
mg/kg
Aluminium content of foodstuffs (n=1431)
Figure 1
82%
11%
3%
2%
2%
0
10
20
30
40
50
60
70
80
90
Frequency distribution %
<10 10-20 20-50 50-100 >100
mg/kg
Aluminium in cereal products (n=516)
Figure 2
27%
17%
21%
16%
19%
0
5
10
15
20
25
30
Frequency distribution %
<10 10-20 20-50 50-100 >100
mg/kg
Aluminium in confectionery (n=236)
Figure 3