Báo cáo toán học: " Yttrium-90-labeled microsphere tracking during liver selective internal radiotherapy by bremsstrahlung pinhole SPECT: feasibility study and evaluation in an abdominal phantom" potx
Bạn đang xem bản rút gọn của tài liệu. Xem và tải ngay bản đầy đủ của tài liệu tại đây (1.11 MB, 14 trang )
ORIGINAL RESEARCH Open Access
Yttrium-90-labeled microsphere tracking during
liver selective internal radiotherapy by
bremsstrahlung pinhole SPECT: feasibility study
and evaluation in an abdominal phantom
Stephan Walrand
1*
, Michel Hesse
2
, Georges Demonceau
2
, Stanislas Pauwels
1
and François Jamar
1
Abstract
Background: The purpose of the study is to evaluate whether a pinhole collimator is better adapted to
bremsstrahlung single photon emission computed tomography [SPECT] than parallel-hole collimators and in the
affirmative, to evaluate whether pinhole bremsstrahlung SPECT, including a simple model of the scatter inside the
patient, could provide a fast dosimetry assessment in liver selective internal radiotherapy [SIRT].
Materials and methods: Bremsstrahlung SPECT of an abdominal-shaped phantom including one cold and five hot
spheres was performed using two long-bore parallel-hole collimators: a medium-energy general-purpose [MEGP]
and a high-energy general-purpose [HEGP], and also using a medium-energy pinhole [MEPH] collimator. In
addition, ten helical MEPH SPECTs (acquisition time 3.6 min) of a realistic liver-SIRT phantom were also acquired.
Results: Without scatter correction for SPECT, MEPH SPECT provided a significantly better contrast recover y
coefficient [CRC] than MEGP and HEGP SPECTs. The CRCs obtained with MEPH SPECT were still improved with the
scatter correction and became comparable to those obtained with positro n-emission tomography [PET] for the 36-,
30- (cold), 28-, and 24-mm-diameter spheres: CRC = 1.09, 0.59, 0.91, and 0.69, respectively, for SPECT and CRC =
1.07, 0.56, 0.84, and 0.63, respectively, for PET. However, MEPH SPECT gave the best CRC for the 19-mm-diameter
sphere: CRC = 0.56 for SPECT and CRC = 0.01 for PET. The 3.6-min helical MEPH SPECT provided accurate and
reproducible activity estimation for the liver-SIRT phantom: relative deviation = 10 ± 1%.
Conclusion: Bremsstrahlung SPECT using a pinhole collimator provided a better CRC than those obtained with
parallel-hole collimators. The different designs and the better attenuating material used for the collimation
(tungsten instead of lead) explain this result. Further, the addition of an analytical modeling of the scattering inside
the phantom resulted in an almost fully recovered contrast. This fills the gap between the performance of
90
Y-PET
and bremsstrahlung pinhole SPECT which is a more affordable technique and could even be used during the
catheterization procedure in order to optimize the
90
Y activity to inject.
Keywords: bremsstrahlung, pinhole, SPECT, SIRT, yttrium-90, microsphere, dosimetry
Background
A selective internal radiation therapy [SIRT] using
90
Y-
labeled microspheres i s a rapidly emerging treatment of
unresectable, chemorefractory primary and metastatic
liver tumors. The success of such therapeutic approach
depends on (1) the expertise of the interventional radiol-
ogist to selectively catheterize the appropriate branch of
artery, (2) the selection of patients with limited tumor
burden, and (3) the determination of the maximal activ-
ity which can be safely injected to the patient. This
determination is not achievable by angiography and is
usua lly performed using empirical formulas , such as the
partition model [1]. Pre-therapy single photon emission
computed tomography [SPECT] using
99m
Tc-labeled
* Correspondence: stephan.walrand@uclouvai n.be
1
Center of Nuclear Medicine, Université Catholique de Louvain, Avenue
Hippocrate 10, Brussels, 1200, Belgium
Full list of author information is available at the end of the article
Walrand et al. EJNMMI Research 2011, 1:32
/>© 2011 Walrand et al; licensee Springer. This is an Open Access article distribu ted under the terms of the Creative Commons
Attribution Licens e ( which permits unrestricted use, distribution, and reproduction in
any medium, provided the original work is properly cited.
macroaggregates [
99m
Tc-MAA] is mainly i ntended to
rule out patients who display a liver-to-lung shunt in
excess of 20% [1,2]. Even if
99m
Tc-MAA SPECT shows
some usefulness in simulating the liver-SIRT procedure
[3-5],
90
Y-microspheres differ from
99m
Tc-MAA by the
higher number of particle s injected during the therapeu-
tic procedure, which could lead to a more pronounced
embolic effect [6]. Imagin g the actual
90
Y-microsphere
deposition during the liver SIRT appears thus preferable.
Gupta et al. [7] showed the feasibility of iron-labeled
microsphere tracking during transcatheter delivery in rab-
bit liver by magnet ic resonance [MR] imaging. In this
paper, cosigned by R. Salem, th e authors concluded:
‘Although quantitative in vivo estimation of microsphere
biodistribution may prove technically challenging, the clin-
ical effect could be enormous, thus permitti ng dose opti-
mization to maximize tumor kill while limiting toxic
effects on normal liver tissues.’ However, human liver
SIRT appears quite incompatible with MR: the X-ray
angiographic imager will difficultly be implemented
around the MR table, and the long duration of liver SIRT,
which can take hours when the arterial tree is challenging,
can unlikely be fitted into clinical MR agenda.
Several methods are already clinically used to assess the
microsphere deposition after SIRT and check that the pro-
cedure has been performed as expected. Conventional
bremsstrahlung imaging is already widely used in order to
qualitatively assess biodistribution after
90
YliverSIRT
[8-17]. However, in the absence of a photopeak, SPECT
imaging of
90
Y is dependent on the continuous bremsstrah-
lung X-rays. Although numerous correction methods have
been proposed for parallel-hole collimator bremsstrahlung
SPECT, the reached accuracy is still insufficient to safely
determine the maximal activity to inject in each patient
(see Walrand et al. [18] for an extensive review of the cor-
rection methods and applications).
More recently, the development of
90
Y-positron-emission
tomography [PET] imaging [19-23] offers the unique
opportunity to easily assess the actual absorbed dose deliv-
ered in
90
Y SIRT. Early human data have already provided
a promising relationship between tumor dose and cell sur-
vival fraction [18,22]. However, the very low positron
abundance (32 out of a million decays) required the use of
long acquisition times (> 30 min).
To the best of our knowledge, bremsstrahlung SPECT
using a pinhole collimator was never investigated for a
human-directed application. This likely results from the
fact that a pinhole collimator has a small field of view
[FOV] and thus, for t he imaging of large organs, results
in lower SPECT performances compared with those
obtained using parallel-hole collimators. Howev er, in
bremsstrahlung SPECT, the different designs (the pinhole
collimator is almost an empty volume where high-energy
X-rays cannot scatter down into the acquisition energy
window) and the bette r attenuating material used for the
collimation (tungsten rather than lead) could result in
better bremsstrahlung SPECT performances using the
pinhole collimator.
The purpos e of the study is to evaluate whether a pin-
hole collimator is better adapted to bremsstrahlung
SPECT than parallel-hole collimators and in the affirma-
tive, to evaluate whether pinhole bremsstrahlung SPECT,
including a simple previously published model of the
scatter inside the pat ient [24,25], could p rovide a fast
dosimetry assessment in liver SIRT. For comparison,
a
90
Y time-of-flight [TOF]-PET acquisition was also
acquired.
Materials and methods
Sphere phantom acquisitions
An abdominal-shaped container (31 × 23 cm
2
cross sec-
tion × 8 cm length, 4.51 volume, Figure 1) was filled with
350 MBq of
90
Y (background + spheres). The container
included six spheres with a diameter of 30, 36, 36, 28, 24,
and 19 mm and a specific activity of 0, 7, 3.5, 3.5, 3.5, and
3.5 times that of the surroun ding medium (background),
respectively. A 30-min acquisition was performed on the
GEMINI TF PET (Philips Medical Systems, Cleveland,
OH, USA). One-hour acquisitions were performed on a
single-head 400AC g camera (1/2-in thick, 40-cm-dia-
meter crystal, GE Healthcare, Haifa, Israel) in order to
model a 30-min acquisition on a dual-head camera that is
now the commercial standard. The acquisition energy
window was limited from 50 to 150 keV in order to avoid
the camera backscatter peak that is slightly above 150 keV
[26]. Long-bore medium-energy general-purpose [MEGP]
and high-energy general-purpose [HEGP] collimators
(hole length 42 and 40 mm, septa thickness 1.4 and 3.2
mm, hole diameter 3.4 and 4.0 mm, respectively), and a
medium-energy pinhole [MEPH] collimator (tungsten
insert, aperture diameter 6 mm, focal length 26 cm, basal
diameter 30 cm; the collimator was kindly provided by GE
Healthcare) were investigated. Elliptical orbits were used
to get the MEGP and HEGP collimators as close as possi-
ble to the phantom edge. For the MEPH collimator, the
largest possible circular orbit was used in order to get the
maximal transverse FOV.
Collimator comparison
Contrast recovery coefficients [CRCs] obtained with the
different collimators were compared on the sphere phan-
toms (Figure 2 ). All reconstructions were performed
using ordered subset expectation maximization [OSEM]
(eight subsets) up to 250 iterations. Despite the acquisi-
tion setup used, with the MEPH collimator, only a
20-cm-diameter centered circle could be imaged at all
acquisition angles. To reduce distortion and loss of
counts near the edges of the pinhole FOV and also to
Walrand et al. EJNMMI Research 2011, 1:32
/>Page 2 of 14
reduce the truncation artifact generated during the
reconstruction, the voxe ls outside the phantom were set
to zero in the initial estimate of the activity distribution.
As this setting also slightly reduced the noise, the same
was applied to the parallel-hole collimators as well (note
that in a patient study, this region can be delineated from
a coregistered computed tomography [CT] scan). The
reconstruction voxel size was 4 mm for PET and 6.5 mm
for SPECT. The TOF, attenuatio n, and scatter were
accounted for in the PET reconstruction [27]. The path
of the betas before X-ray emissions was taken into
account: in the SPECT reconstruction iterations, the vox-
els were extended on each side by the beta mean range
before projecting their activity. The geometrical point
spread function [PSF] of the different collimators was
also accounted for. For th e pinhole SPECT, at 0° and 90°,
the edge of the phantom was 2 cm close to the pinhole
aperture. Due to the magnification, a voxel projected its
activity on the crystal in a circle of 13-pixel diameter, i.e.,
on more than 100 pixels. Instead of using a multi-ray
approach such as that proposed by Vanhove et al. [28],
we developed a projector including an analytical approxi-
mation of the profile generated on the crystal by the geo-
metrical projection of a voxel through the aperture. As
the purpose was to purely compare the hardware
performance, specific effects o f bremsstrahlung resulting
from the high-energy X-rays, such as collimator penetra-
tion-scattering and backscattering in the camera, were
not corrected for, and an effective atten uation coeffi cient
(μ =0.13cm
-1
) [29] was used in the geometrical projec-
tion in order to a ccount for the scattering inside the
phantom (Figure 3).
Pinhole SPECT with scatter modeling
To assess the ‘intrinsic’ CRC that can be reached by pin-
hole SPECT, i.e., not corrupted by the physical effects
occurring in the emission medium, the continuous
energy X-ray scattering in the phantom was modeled
using an adapted version of a previously proposed analy-
tical model [24,25].
Contrary to
99m
Tc, with
90
Y, each point of the phantom
received a continuous energy spectrum of rays coming
from each source in the phantom. As a result, scattered
X-rays having an energy ranging in the energy acquisi-
tion window can occur in all directions. This difference
was approximated by assuming an isotropic scattering
emission in the analytical scatter model (see Appendix
1). With this assumption, the projection with scatter
modeling P
scat
of the activity estimate A
n
is simply
obtained by adding a spatially variant convolution of
true
HE
G
P ME
G
P
MEPH-6mm
TOF-PET
MEPH-6mm SCAT
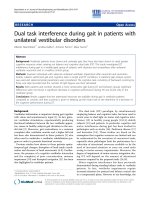
Figure 1 Hot and cold sphere phantoms. The figure shows transverse slices passing through the spheres’ center for the different acquisitions with
reconstructions of four iterations × eight subsets. Slices are shown for general information; the purpose of the study is for quantitative distribution
assessment instead of diagnostic imaging. The true activity distribution is represented with the same voxel size than the reconstructions.
Walrand et al. EJNMMI Research 2011, 1:32
/>Page 3 of 14
0.00
0.20
0.40
0.60
0.80
1.00
1.20
0.00 0.20 0.40 0.60 0.80 1.0
0
MEPH-SCAT
TOF-PET
MEPH
HEGP
MEGP
S
p
here s
p
ecific activit
y
x diameter (arbitrar
y
units)
C
R
C
true
30 36 36 28 24 19
diameter
(
mm
)
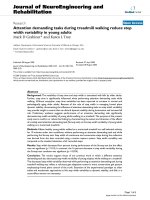
Figure 2 Sphere CRC.ThefigureshowstheCRCasafunctionoftheactualspherespecificactivitytimesthespherediameterwith
reconstructions of 20 iterations × 8 subsets. The true CRC is that obtained with the actual activity ratio.
Pb
W
<150keV
>150keV
Pb
Au
B
c
>150keV
<150keV <150keV
Pb
Ω
ω
A
f
f
a
b
e
c
d
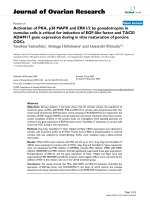
Figure 3 Comparison of parallel-hole and pinhole collimator features. The figure shows emission solid angles (Ω, ω) allowing a scattering
down of the high-energy X-rays into the energy acquisition window. (A) In the parallel-hole collimator, note that Ω is the emission solid angle
for the scatter paths (a) and also of the penetrating-scatter paths (b) that are reduced in the HEGP collimator compared to the MEGP one. These
paths can also occur from the activity not geometrically seen by the crystal (c, d). (B) In the MEPH collimator used in the present study, scatter
paths (e) mainly occur from the activity region that is not seen by the crystal. Due to the high attenuation and double conical shape of the
tungsten insert (W), the emission solid angle for the penetrating-scatter path is too small to be drawn on the figure. (C) The optimized pinhole
collimator for bremsstrahlung SPECT avoids these scattering paths (e) to prevent wall scattering of high-energy X-rays penetrating through the
nose of the gold insert; an empty space (f) is left between the collimator housing and the extreme rays (dot-dash lines) passing through the
aperture.
Walrand et al. EJNMMI Research 2011, 1:32
/>Page 4 of 14
this estimate with an effective attenuation kernel fol-
lowed by the geometrical projection
P
µ
geom
:
P
scat
A
n
→
x
= P
µ
geom
A
n
→
x
+ αρ
→
x
d
→
X
e
−
→
x
→
X
∧
μ
→
y
d
→
y
A
n
→
X
,
(1)
where
is the linear integration of the effective attenua-
tion coefficient
∧
μ
→
y
along the straight line from the
point
→
X
to the scattering point
→
x
,and
ρ
→
x
is the den-
sity at the point
→
x
(zero in air). In liver SIRT, the attenua-
tion is almost homogeneous, and the linear integration
in Equation 1 reduces to
∧
μ |
→
x
−
→
X
|
. Using fast Fourier
transform, the additional convolution in Equation 1 did
not increase the computation time per iteration.
The effective attenuation coefficient
∧
μ
was obtained by
fitting the scatter profile along a tank filled with water and
placed on a MEGP collimator, with a
90
Ypointsource
placed on one side of the tank (see Appendix 1). The scat-
ter fraction a was obtained from a pinhole SPECT of a 20-
cm-diameter Perspex cylinder (Philips Medical Systems)
centered in the FOV, filled with water and containing an
off-centered
90
Y point source. The scatter fraction a was
fitted to obtain the best agreement between the computed
projections of this cylindrical phantom using Equati on 1
and the measured planar views. As the scattering is now
accounted for, the attenuation coefficient μ in Equation 1
is now the total attenuation coefficient and was set to the
wat er attenua tion coefficient at the middle of the energy
acquisition window (μ =0.17cm
-1
), both in the scatter
modeling procedure and in the phantom pinhole
SPECT reconstruction. The projection used in the collima-
tor comparison corresponds to Equation 1 with a =0and
μ =0.13cm
-1
.
Quantitative assessment
The performances of the collimators were evaluated
using the CRC obtained for the spheres:
CRC =
C
meas
− 1
C
true
− 1
,
(2)
where C
meas
and C
true
are the measured and true
spheres to background specific activity ratios, respec-
tively. The measured specific activity of a sphere was the
mean specific activity obtained in a spherical volume of
interest [VOI] centered on the sphere and having the
actual diameter of the sphere. The background specific
activity was the mean specific activity in the phantom
voxels outs ide these sphere VOIs. The CRC is equal to 1
for an ideal reconstruction for both cold and hot spheres.
Liver-SIRT phantom acquisition
Thesameabdominal-shapedcontainer filled with water
was used as the scattering medium. A 5-cm-diameter
cylinder filled with a K
2
HPO
4
solution was set in the con-
tainer in order to model the spine attenuation. A c om-
plex distribution activity pattern corresponding to a
typical liver SIRT was modeled inside an 800-ml box set
in the a natomical position of the right liver. In the right
area of this 800-ml box, a necrotic hetero geneous tumor
was modeled by a shell of five active 13-ml bottles (dia-
meter 2.4 cm, length 2.8 cm) surrounding a cold core (a
13-ml bottle filled with water). In the left area, an isolated
tumor was modeled by an active 13-ml bottle. The
healthy right liver (709 ml) included four compartments:
three active 58-ml bottles (one close to the shell and two
close to the isolated tumor) and the 535-ml spa ce in
between and around the bottles. A total activity of 1.4
GBq was used. Activities of the different compartments
are shown in Table 1.
A helical MEPH SPECT (two half rotations from -135°
to 45° w ith a longitudinal pitch of 5.4 cm per half rota-
tion; Figure 4) was manually performed on the GE
400AC camera in the following way. Three tape measures
werefixedonthebedinordertonoteitspositioninthe
three directions (the camera does not allow radial motion
for the detector, Figure 5). For 72 times, the camera was
rotated by 5° and the bed shifted by 1.5 mm in the longi -
tudinal direction manually. At each angle, (1) the bed
was vertically and horizontally shifted in order to keep at
least 10 cm between the pinhole aperture and the 800-ml
box in order to avoid truncation artifacts; (2) the bed
position in the three directions was reported; and (3) 10
frames of 3 s were recorded (matrix 128 × 128) by put-
ting together the frame number i (i = 1, ,10) of a ll rota-
tion angles, and 10 helical SPECTs o f a 3.6-min
acquisition time were generated. Due to all the manipula-
tions, the total acquisition times was 3.5 h, so about 3 h
just for the manual motions and the initialization of the
dynamic acquisitions at each angle, making a trial on
patients using this SPECT system impossible.
The 3.6-min helical SPECTs were reconstructed wi th
OSEM (70 iterations × 8 subsets) including the analytical
scatter model. The tumor and liver VOIs were drawn on a
CT scan of the phantom, and the position of the set of
VOIs was afterwar d tuned on the SPECT images (Figure
5). In liver SIRT, it can be approximated that the whole
injected activity indefinitely remains in the liver and lungs
and thus can be entirely imaged. As a result, the percen-
tage of activity taken up by the different compartments
was obtained by computing the ratio of the counts in the
compartment VOI with the total count in the image. After
time integration of the physical decay and summation-
multiplication by the S factors between the different
Walrand et al. EJNMMI Research 2011, 1:32
/>Page 5 of 14
compartments, this deter mines the tissue dos imetry
expressed in milligrays per megabecquerel [mGy/MBq]
[30]. These S factors can be computed for each target ¬
source compartment by convolving a three-dimension al
[3-D] mask o f the source compartment VOI with a dose
deposition kernel [31]. After analyzing the data, it was
noted that t he reproducibility of the 3.6-min acquisition
time helical pinhole SPECTs was sufficiently good to
Table 1 Abdominal phantom compartment activities assessed by the MEPH with scatter correction [MEPH-SCAT]
SPECT
True 3.6-min Acquisition time 1-min Acquisition time
Volume
(ml)
RSA % of 1.4 GBq % of 1.4 GBq RD
(%)
% of 1.4 GBq RD
(%)
Core 13 0 0 1.14 ± 0.13 NA 1.20 ± 0.17 NA
Shell 52 4 27.31 20.79 ± 0.35 -24 20.42 ± 0.59 -25
Isolated tumor 13 4 5.46 4.34 ± 0.10 -21 4.32 ± 0.27 -21
Healthy liver 1 34 1 3.73 3.22 ± 0.15 -14 3.26 ± 0.18 -13
Healthy liver 2 58 0.25 1.60 2.46 ± 0.59 54 2.12 ± 0.20 32
Healthy liver 3 58 0.5 3.20 4.03 ± 0.26 26 4.11 ± 0.31 28
Healthy liver 4 58 0.5 3.20 4.25 ± 0.59 33 4.33 ± 0.40 35
Total healthy liver 709 NA 67.23 73.73 ± 0.41 10 74.06 ± 0.57 10
Relative specific activities (RSA; healthy liver is set to 1) and percentage of total activity (mean ± SD) in the liver-SIRT phantom for the different regions: necrotic
tumor (core and shell), isolated tumor, and healthy liver regions (1: VOI sample far from the tumors; 2, 3, 4: cylinders; total healthy liver: the whole region beside
the tumors). RD, relative deviation; NA, not applicable.
Pb
W
a
b
c
10mm
Figure 4 MEPH collimator. The figure shows a view of the MEPH aperture collimator (from top to bottom in Figure 3B with an angle of 45°)
set on the carrier trolley. Pb is the lead housing facing the targeted activity. W is the tungsten insert. (a) The floor of the room. (b) The inner
side of the conical lead housing. (c) The bottom part of the lead thread in which the insert is screwed.
Walrand et al. EJNMMI Research 2011, 1:32
/>Page 6 of 14
expect useable results using shorter acquisition times, so
we decided to gener ate pseudo 1-min helical SPECTs by
keeping only the odd pixel in the two directions of the
acquisition matrix (one pixel on four).
Results
Collimator comparison
The cent ral transverse slices obtained using the different
systems showed that TOF-PET provided the best contrast
for the 36-, 30-, 28-, and 24-mm-diameter spheres, while
MEPH-6-mm SPECT provided the best CRC for the 19-
mm-diameter sphere (Figure 1). This was confirmed in
Table2andFigure2,showingthequantitativeCRC
obtained by the different systems for all spheres. For the
cold and 28-mm hot spheres, the MEPH provided a CRC
twice higher than that provided by the parallel-hole colli-
mators and made the two smallest hot spheres clearly visi-
ble. The cold sphere CRC was also significantly improved.
Pinhole SPECT with scatter modeling
The values obtained for the scattering modeling in
Equation 1 were a =1.97×10
-4
and
∧
μ
=0.0697cm
-1
.
d
e
f
a
A
B
36
min
3
.
6
min 1 min
b c
Figure 5 Acquisition and reconstruction of the abdominal phantom modeling hepatic metastases. The figure shows liver-SIRT phantom
acquisition and reconstruction. (A) The bed holder and the three tape measures. (B) The counterweight lever system that does not allow pure
radial motion. The bottom row shows the images of the liver model and reconstructed oblique slices passing through the middle of the liver
model for 36-, 3.6-, and 1-min acquisitions. (a) The VOI sample in the healthy liver. (b) The necrotic tumor and (c) the isolated tumor with both
specific activities fourfold that of the healthy liver. (d, e, f) The cylinders with specific activities 0.5, 0.5, and 0.25 times that of the healthy liver,
respectively. The cylinder (f) section is smaller than that of cylinders (e) and (d) because cylinder (f) was not centered.
Table 2 CRC of the hot and cold sphere phantoms
Diameter (mm) (act sph/bg) 30 (0) 19 (3.5) 24 (3.5) 28 (3.5) 36 (3.5) 36 (7)
TOF-PET
a
0.56 0.01 0.63 0.84 1.10 1.07
MEPH-SCAT SPECT
a
0.59 0.56 0.69 0.91 1.03 1.09
MEPH-SPECT
a
0.32 0.33 0.39 0.52 0.60 0.60
HEGP-SPECT
a
0.01 0.13 0.06 0.23 0.38 0.39
MEGP-SPECT
a
0.01 0.12 0.06 0.22 0.36 0.37
a
CRC of the different spheres obtained for reconstructions with 20 iterations × 8 subsets, except for the MEPH-SCAT shown for reconstructions with 70 iterat ions
× 8 subsets. The iteration numbers are optimal for the hot spheres, but not for the cold ones, the CRC of which continues to slowly improve with the it eration
number (see Appendix 2 for the convergence rate). According to Equation 2, an ideal reconstruction gives a CRC equal to 1 for both cold and hot spheres. TOF-
PET, time-of-flight positron-emission tomography; MEPH-SCAT SPECT, medium-energy pinhole with scatter correction single photon emission computed
tomography; MEPH-SPECT, medium-energy pinhole single photon emission computed tomography; HEGP-SPECT, high-energy general-purpose single photon
emission computed tomography; MEGP-SPECT, medium-energy general-purpose single photon emission computed tomography; act sph/bg, ratio between the
specific activity of the sphere and of the background.
Walrand et al. EJNMMI Research 2011, 1:32
/>Page 7 of 14
Using the scatte ring analytical model, MEP H provided
similar results as those of the TOF-PET (Table 2), but
with the need to perform significantly more iterations
(see Appendix 2 about the CRC convergence rate).
Table 1 and Figure 5 show the results obtained with the
helical MEPH SPECT for the liver-SIRT phantom
reconstructed with 70 iterations (eight subsets).
Discussion
This study demonstrates the better hardware properties
of a pinhole collimation (MEPH) for bremsstrahlung
SPECT imaging. Further, the adaptation of a previously
described analytical modeling of the scattering inside
the patient leads to contrast recovery very close to those
obtained with
90
Y-PET.
The better CRC obtained by MEPH compared with
MEGP or HEGP collimators resulted from the reduced
high-energy X-ray penetration in the tungsten insert of the
pinhole compared to that of the lead septa of the parallel-
hole collimators. Also, the pinhole collimator is almost an
empty volume reducing the amount of high-energy X-rays
scattering down into the acquisition energy window (Figure
3B) compared to parallel-hole collimators (Figure 3A).
These features made the improvem ent especially noticeable
for the cold sphere and the three smallest hot spheres
(Table 2, Figure 2).
Using a simple analytical scatter model in the phan-
tom, MEPH SPECT provides similar results than those
of TOF-PET (Table 2, Figure 2), although TOF-PET is
free of these collimator penetration-scatter and also of
camera backscatter drawbacks. The results are even bet-
ter for the smallest sphere that is hampered by the
higher noise obtained in PET reconstruction as shown
in Figure 1.
The analytical modeling of the scatter was derived from
phantoms having dif ferent geometries, sizes, and distri-
bution activities than thos e of the spheres and of the
liver-SIRT phantom. This assures that the model can be
applie d to various patient corpulences. Also, the fact that
the cold sphere CRC at the end converged to t he same
value than that of the hot sphere having the same dia-
meter (see Appendix 2) proved that the background
activity is well reproduced and that the analytical model
does not underestima te or overestimate the scatter con-
tribution. Furthermore, this model does not increase the
computation time per iteration. Nevertheless, as the goal
is to determine which maximal activity is still safe for the
liver during the liver SIRT within a few minutes, it is of
prime importance to further validate in patients the pro-
posed method before its utilization in optimizing the
injected activity. This validation could be performed by
comparing the results with those obtained using a long-
acquisition time PET (preferably TOF-PET) soon per-
formed after the radioembolization.
The pinhole collimator used in our study was not
designed for bremsstrahlung SPECT, and several features
can still be im proved. A gold or iridium insert and
thicker pinhole lead wal ls can still reduce the contamina-
tion due to the penetration of the high-energy X-rays.
The design of the collimator housing itself can be
improved. Indeed, in conical housing pinhole, there is a
possibility for the high-energy X-rays to pass through the
aperture or through the nose of the aperture and then, to
scatter on the pinhole inner lead walls down to an energy
inside the acquisition energy window (Figure 3B, 4). Con-
trary to the parallel-hole collimator, these scatterings
mainly occur from X-rays emitted in areas not geometri-
cally seen by the crystal. Making the collimator housing
cylindrical rather than conical, the insert will be inside a
thick lead plate parallel t o the crystal, and the scattering
by the inner wall will be removed (Figure 3C). This hous-
ing shape will also have the benefit of removing the risk
of hurting the patient.
Besides the optimization for bremsstrahlung imaging,
the pinhole collimator should also be optimized to large-
organ SPECT. This can be done by decreasing the focal
length in order to increase the transverse FOV at a short
distance to the aperture using the whole crystal surface
(the MEPH collimator of the present study used only
three-fourths of the crystal diameter). Multiple pinhole
collimators should also be better adapted. Lastly, the aper-
ture size and energy window should be optimized in rela-
tion with collimator effects modeling in the reconstruction
process.
However, even with this suboptimal pinhole collimator,
the results obtained for the liver-SIRT p hantom showed
that a 3.6-min helical MEPH SPECT with 70 iterations
(eight subsets) is sufficient to obtain an accurate (relative
deviation 10%) and reproducible (standard deviation [SD]/
mean < 1%) estimation of the healthy liver activity that
determines the maximal safe activity which can be injected
(Table 1). The percentage of uptake in the different com-
partments was estimated versus the whole activity mea-
sured in the reconstruction. Thus, the computation of the
compartment absorbed doses will require an accurate
measure of the total delivered activity. Especially, t he
catheter and microsphere vial will have to be imaged or
counted after the radioembolization.
Rather than to estimate the mean liver absorbed dose
by multiplying the percentage taken up by the liver
region reached by the microspheres with the S factor of
this region, a voxel-based dosimetry could be obtained by
conv olving the reconstructed
90
Y distribution with a dose
depo sition kern el [18,20] . This will allow computatio n of
the normal tissue complication probability using the
equivalent uniform dose in order to take into account the
liver irradiation heterogeneity. T his can be done using
Niemerko’s model [32] and the normal tissue tolerance
Walrand et al. EJNMMI Research 2011, 1:32
/>Page 8 of 14
determined by Emami et al. [33]. The software performing
this computation is already available [34], and recently, an
improvement of Niemerko’s model was proposed [35].
Using four commercial 4 × 8-core Xeon (Intel Corpora-
tion, Santa Clara, CA, U SA) or 4 × 12-core Opteron (AMD,
Sunnyvale, CA, U SA) computers in a cluster, accurate
results could be obtained in a 30-s computation time (see
Appendix 2). The results obtained with the pseudo 1-min-
helical acquisition (Table 2) supports that using an optimal
pinhole collimator, it could b e possible t o reduce t he acqui-
sition time to 1 min. Although the sma ll SDs obtained
show that the statistic is sufficient, the reconstructed image
is corrupted by more artifacts than for the sphere phantom
where all the spheres were just in front of the collimator
aperture. This likely resulted from the high pitch used (5.4
cm per half r otation). Ideally, the pitch s hould not be larger
than the targeted final resolution (1 cm), requiring an
acquisition software allowing a utomated helical SPECT that
is n ot yet available on a commercial camera.
Besides being more affordable than PET, the possibility
to estimate the mean absorbed dose delivered to the
healthy liver reached by microspheres in a few minutes by
pinhole SPECT also offers new possibilities. Indeed, the
price of a single-head gamma camera is only about tenfold
that of a liver-SIRT procedure, and it could be advisable to
install one in the catheterization room. The helical acquisi-
tion orbit could be performed using a six-axis industrial
arm robot; in home position, the s ystem will leave the
space around the catheterization table free (Figure 6, see
Additional file 1). These industrial robots [36] are very
accurate (0.06 mm), can handle payloads up to 1 ton, are
reasonably cheap (a 300-kg payload model costs about two
liver-SIRT procedures), and their combined use with a
gamma camera requires only to synchronize together the
starts of the camera acquisition and of the robot motion.
Such robots are already used in radiation therapy [37] or
ass isted surgery. State-of-the- art informatics driving sys-
tems are reliable and efficiently prevent any hurt to the
patient.
Conclusion
The use o f pinhole SPECT reduces the disturbing inter-
actions of the high-energy X-rays with the collimator.
Thi s would allow implementing a d osimetr y assessm ent
during the liver-SIRT procedure without displacing the
catheter and at the end, injecting the optimal activity
that provides the highest absorbed dose to the tumors
still safe to the liver. This may definitely improve the
patient outcome.
Appendix 1
Scatter model
The angular distribution s (θ) of photon scattering is
given by the Klein-Nishina formula [38]:
A B C
D
E F
Figure 6 Example of a multi-pinhole SPECT implementation in a catheterization room using a six-axis arm robot.(A, B) The orbit
motion above the patient. (C) The end-stage rotation drive of the robot rotates the detector around itself to turn the collimator side upward.
(D, E) The orbit motion under the patient. (F) In home position, the system leaves the space around the patient free. During the orbit motion,
the robot rotates slowly on its pedestal to provide a helical acquisition. See animation in Additional file 1.
Walrand et al. EJNMMI Research 2011, 1:32
/>Page 9 of 14
σ
(
θ
)
=
r
2
0
2
E
E
0
2
E
0
E
+
E
E
0
− sin
2
θ
,
(3)
where E is the energy of the scattered photon, E
0
is
the initial energy of the photo n, and r
0
is the classical
radius of the electron. E
0
, E,andθ are linked to gether
by the Compton formula [38]:
1
E
−
1
E
0
=
1 − cos
θ
511
,
(4)
where 511 (keV) is the energy of the electron at rest.
For
99m
Tc (E
0
= 140 keV), the Compton formula
(Equation 4) shows that scattering angles higher than
80° in the phantom, or the patient, drop the gamma ray
energy below the energy acquisition window. The angu-
lar distribution of the scattered photon detectable by the
camera is thus given by the Kle in-Nishina formula trun-
cated above 80° (Figure 7).
The angular distributio n P(θ) of single scatterings of a
primary bremsstrahlung X-ray beam coming from a
90
Y
source that drops its energy into the window (50, 150
keV) is:
P
(
θ
)
=
150
50
σ
(
θ
)
S
511
511 − E
(
1 − cos θ
)
E
dE
,
(5)
where S(E
0
) is the bremsstrahlung X-ray yield at
energy E
0
reaching the scattering point; note that due
to the attenuation, there is a hardening of the X-ray
beam when the distance between the emission and
scattering points increases. Due to the continuous
energy spectrum up to 2.27 MeV of the
90
Y bremsstrah-
lung X-rays, all the scattering domain (0°, 180°) × (50,
150 keV) is targeted. The computation of Equation 5
using S(E
0
) obtained from Monte Carlo simulations
[22] is given in Figure 7 and shows that contrary
to
99m
Tc, the first scattering emission can be reasonably
considered as isotropic for
90
Y. Successive scatterings
will not fundamentally change this fea ture. As a result,
while the high-energy continuous spectrum of
90
Y
bremsstrahlung X-rays increases the contamination
level of the scattering compared to
99m
Tc,italsosim-
plifies the analytical model to approximate the scatter-
ing in the patient and its implementation in the
iterative reconstruction that is now a simple additional
convolution term.
0.00
0.20
0.40
0.60
0.80
1.00
1.20
1.40
1.60
0 30 60 90 120 150 18
0
90Y
99mTc
Θ [de
g
]
P(Θ) [%
/
deg]
Figure 7 Scattering angular distribution. The figure shows the angular distribution P(θ) of single scatterings of a primary ray that drops its
energy in the window (115, 140 keV) and (50, 150 keV) for
99m
Tc and
90
Y, respectively. The incident beam hardening is neglected (scatter and
primary emission point close together).
Walrand et al. EJNMMI Research 2011, 1:32
/>Page 10 of 14
Effective attenuation coefficient fitting
The effectiv e attenuation coefficient
∧
μ
was obtained by
fitting the scatter profile along a tank filled with water
and placed on a MEGP collimator with a
90
Ypoint
source placed on one side of the tank (Figure 8). The
profile corresponds to a 90° scattering which is in the
middle of the scattering angle range possible in the
phantom. The fit of the profile by a double exponential
gave 0.0697 and 0.378 cm
-1
for the two exponent coeffi-
cients (Figure 9). The fast exponential decrease is due to
the X-ray penetration-scattering through the camera
shielding and collimator septa (Figure 8, path b); indeed,
this attenuation coefficient is too high to be produced
by water.
Appendix 2
Convergence rate
Figure 10 shows the CRC convergence rate per iteration
for the SPECT reconstructions. The inclusion of the
scattering into the iteration significantly slows down the
convergence rate. The reason is that the additional scat-
tering contribution smoothes the back projection that
appear s in the multiplicative factor applied to the distri-
bution estimate to obtain the next one. To overcome
this drawback, some authors proposed to include
smoothing factors, such as collimator PSF or scattering,
only in the projection step [39]. However, this method
does not longer exactly account for the Poisson nature
of the noise and in this study, slightly degrades the
results (data not shown). Fig ure 10 shows that the cold
sphere CRC is null for the paral lel-hole collimators and
that for the pinhole collimator, a fast, but short, CRC
increasing p hase is prolonged by a slow growth up to a
value near t hat of the hot sphere of a similar diameter.
As the purpose in liver-SIRT dosimetry is mainly to
study the partition of the in jected activity betwee n tak-
ing up healthy liver and taking up tumors, using eight
subsets, it is not needed to go further than 70 and 20
iterations with and without using s catter modeling,
respectively. The computation time on a 2 × 4-core
Xeon 5335 server (core without hyperthreading avail-
able, MMX registers used) was 23 s per iteration for the
pinhole SPECT, with or without scattering correction
(6.5 mm voxel size on edge). A state-of-the-art current
server offers up to 4 × 8-core Xeon 7540 with hyper-
threading (price ≈ 25 k€), dropping down the iteration
time to 3 s. Four of such servers in a cluster should pro-
vide the 70 required iterations in less than 1 min.
90
Y
H
2
O
profile in [50,150] keV
a
b
e
- μ d
^
d
d
Figure 8 Effective attenuation coefficient assessment. The figure shows the experimental setup for the determination of the effective
attenuation coefficient
∧
μ
. The profile in the energy window (50, 150 keV) recorded on the camera equipped with a MEGP collimator is the
result of two kinds of X-ray paths: (a) 90° scattering in the water and (b) penetration through the camera shielding and collimator septa.
Walrand et al. EJNMMI Research 2011, 1:32
/>Page 11 of 14
d
[
cm
]
4 6 8 101214161
8
counts
0
500
1000
1500
2000
2500
3000
90
O
scatter profile in [50,150] keV
a e
-0.38 d
+ b e
-0.07 d
Figure 9 Scatter profile. The figure shows the fit of the scatter profile obtained from the setup shown in Figure 8. The fast exponent ial (0.38
cm
-1
) corresponds to X-ray penetration-scattering through the camera shielding and collimator septa.
0
0.2
0.4
0.6
0.8
1
1.2
0 25 50
0
0.2
0.4
0.6
0.8
1
1.2
0 25
0
0.2
0.4
0.6
0.8
1
1.2
0 25 50 75 100 125 150 175 200 225
8xbg 36mm
4xbg 36mm
4xbg 28mm
0xbg 30mm
4xbg 24mm
4xbg 19mm
MEGP
MEPH
MEPH-SCAT
Iteration number
(
8 subsets
)
CRC
t
rue
Figure 10 CRC convergence rate pe r iteration of the spheres. The figure shows iterations using eight subsets for the MEGP collimator and
for the MEPH collimator with and without scattering correction. HEGP provided similar convergence rate than MEGP (data not shown). Note the
presence of two phases in the convergence rate for the cold sphere.
Walrand et al. EJNMMI Research 2011, 1:32
/>Page 12 of 14
Additional material
Additional file 1: SPECT animation. An example of a multi-pinhole
SPECT implementation in a catheterization room using a six-axis arm
robot.
Author details
1
Center of Nuclear Medicine, Université Catholique de Louvain, Avenue
Hippocrate 10, Brussels, 1200, Belgium
2
Nuclear Medicine, Sint-Elisabeth
Ziekenhuis, Zottegem, 9620, Belgium
Authors’ contributions
SW conceived the method. SW, FJ, and GD participated in the design of the
study. SW and MH developed the reconstruction algorithm. SW, MH, SP, and
FJ participated in the data analysis and in the writing of the manuscript. All
authors read and approved the final manuscript.
Competing interests
The authors declare that they have no competing interests.
Received: 31 August 2011 Accepted: 2 December 2011
Published: 2 December 2011
References
1. Kennedy A, Nag S, Salem R, Murthy R, McEwan AJ, Nutting C, Benson A,
Espat J, Bilbao JI, Sharma RA, Thomas JP, Coldwell D: Recommendations
for radioembolization of hepatic malignancies using yttrium-90
microsphere brachytherapy: a consensus panel report from the
radioembolization brachytherapy oncology consortium. Int J Radiat Oncol
Biol Phys 2007, 68:13-23.
2. Lambert B, Mertens J, Sturm EJ, Stienaers S, Defreyne L, D’Asseler Y: 99mTc-
labelled macroaggregated albumin (MAA) scintigraphy for planning
treatment with 90Y microspheres. Eur J Nucl Med Mol Imaging 2010,
37:2328-2333.
3. Ahmadzadehfar H, Sabet A, Biermann K, Muckle M, Brockmann H, Kuhl C,
Wilhelm K, Biersack HJ, Ezziddin S: The significance of 99mTc-MAA SPECT/
CT liver perfusion imaging in treatment planning for 90Y-microsphere
selective internal radiation treatment. J Nucl Med 2010, 51:1206-1212.
4. Garin E, Rolland Y, Lenoir L, Pracht M, Mesbah H, Porée P, Laffont S,
Clement B, Raoul JL, Boucher E: Utility of quantitative Tc-MAA SPECT/CT
for yttrium-labelled microsphere treatment planning: calculating
vascularized hepatic volume and dosimetric approach. Int J Mol Imaging
2011, 2011:398051.
5. Flamen P, Vanderlinden B, Delatte P, Ghanem G, Ameye L, Van Den
Eynde M, Hendlisz A: Multimodality imaging can predict the metabolic
response of unresectable colorectal liver metastases to
radioembolization therapy with yttrium-90 labeled resin microspheres.
Phys Med Biol 2008, 53:6591-5603.
6. Bilbao JI, Reiser MF: Liver Radioembolization with 90Y Microspheres Berlin
Heidelberg: Springer-Verlag; 2008.
7. Gupta T, Virmani S, Neidt TM, Szolc-Kowalska B, Sato KT, Ryu RK,
Lewandowski RJ, Gates VL, Woloschak GE, Salem R, Omary RA, Larson AC:
MR tracking of iron-labeled glass radioembolization microsphres during
transcatheter delivery to rabbit VX2 livers tumors: feasibility study.
Radiology 2008, 249:845-854.
8. Sebastian AJ, Szyszko T, Al-Nahhas A, Nijran K, Tait NP: Evaluation of
hepatic angiography procedures and bremsstrahlung imaging in
selective internal radiation therapy: a two-year single-center experience.
Cardiovasc Intervent Radiol 2008, 31:643-649.
9. Mansberg R, Sorensen N, Mansberg V, Van der Wall H: Yttrium 90
bremsstrahlung SPECT/CT scan demonstrating areas of tracer/tumour
uptake. Eur J Nucl Med Mol Imaging 2007, 34:1887.
10. Machac J, Weintraub J, Nowakowski F, Mobley D, Zhang Z, Warner R:
Variations in liver perfusion patterns in patients with liver tumors
undergoing therapy with yttrium-90 microspheres, studied with SPECT/
CT. J Nucl Med 2007, 48:396P.
11. Knesaurek K, Muzinic M, Zhang Z, DaCosta M, Machac J: Comparison of
visual and computer calculated coregistration of Y-90 and Tc-99m MAA
SPECT/CT images in treatment of liver cancer. J Nucl Med 2008, 49:112P.
12. Knesaurek K, Machac J, Muzinic M, DaCosta M, Zhang Z, Heiba S:
Quantitative comparison of yttrium-90 (90Y)-microspheres and
technetium-99m (99mTc)-macroaggregated albumin SPECT images for
planning 90Y therapy of liver cancer. Technol Cancer Res Treat 2010,
9:253-262.
13. Moore S, Park M, Mueller S: Activity estimation performance in Y-90
microsphere bremsstrahlung SPECT. J Nucl Med 2009, 50:1433.
14. Tehranipour N, AL-Nahhas A, Canelo R, Stamp G, Woo K, Tait P, Gishen P:
Concordant F-18 FDG PET and Y-90 bremsstrahlung scans depict
selective delivery of Y-90-microspheres to liver tumors: confirmation
with histopathology. Clin Nucl Med 2007, 32:371-374.
15. Simon N, Feitelberg S: Scanning bremsstrahlung of yttrium-90
microspheres injected intra-arterially. Radiology 1967, 88:719-724.
16.
Gnanasegaran G, Buscombe JR, O’Rourke E, Caplin ME, Purfield D,
Hilson AJW: Bremsstrahlung imaging after intra-arterial 90Y lanreotide
radionuclide therapy for carcinoid liver metastases. Nucl Med Commun
2005, 26:284-285.
17. Luo J, Rao P, Zimmer M, Polis M, Mistretta M, Spies S: Imaging technique
in estimating lung shunting of yttrium-90 microspheres. Med Phys 2005,
32:1913.
18. Walrand S, Flux GD, Konijnenberg MW, Valkema R, Krenning EP, Lhommel R,
Pauwels S, Jamar F: Dosimetry of yttrium-labeled radiopharmaceutical for
internal therapy: yttrium-86 or -90 imaging? Eur J Nucl Med Mol Imaging
2011.
19. Lhommel R, Goffette P, Van den Eynde M, Jamar F, Pauwels S, Bilbao JI,
Walrand S: Yttrium-90 TOF PET scan demonstrates high-resolution
biodistribution after liver SIRT. Eur J Nucl Med Mol Imaging 2009.
20. Lhommel R, van Elmbt L, Goffette P, Van den Eynde M, Jamar F, Pauwels S,
Walrand S: Feasibility of yttrium-90 TOF-PET based dosimetry in liver
metastasis therapy using SIR-spheres. Eur J Nucl Med Mol Imaging 2010.
21. Werner MK, Brechtel K, Beyer T, Dittmann K, Pfannenberg C,
Kupferschläger J: PET/CT for the assessment and quantification of 90Y
biodistribution after selective internal radiotherapy (SIRT) of liver
metastases. Eur J Nucl Med Mol Imaging 2009.
22. Lhommel R, Walrand S, van Elmbt L, Pauwels S, Jamar F: Dose-response
relationship in liver-SIRT: Y90 TOF-PET versus Tc99m-MAA SPECT based
dosimetry. Eur J Nucl Med Mol Imaging 2010, 37:S201.
23. Gates VL, Esmail AAH, Marshall K, Spies S, Salem R: Internal pair production
of 90Y permits hepatic localization of microspheres using routine pet:
proof of concept. J Nucl Med 2010, 52:72-76.
24. Walrand SH, van Elmbt LR, Pauwels S: Quantitation in SPECT using an
effective model of the scattering. Phys Med Biol 1994, 39:719-734.
25. Cao ZJ, Frey EC, Tsui BMW: A scatter model for parallel and converging
beam SPECT based on the Klein-Nishina formula. IEEE Trans Nucl Sci 1994,
41:1594-1600.
26. Rault E, Staelens S, Van Holen R, De Beenhouwer J, Vandenberghe S:
Accurate Monte Carlo modelling of the back compartments of SPECT
cameras. Phys Med Biol 2011, 56:87-104.
27. Surti S, Kuhn A, Werner ME, Perkins AE, Kolthammer J, Karp JS:
Performance of Philips Gemini TF PET/CT scanner with special
consideration for its time-of-flight imaging capabilities. J Nucl Med 2007,
48:471-480.
28. Vanhove C, Andreyev A, Defrise M, Nuyts J, Bossuyt A: Resolution recovery
in pinhole SPECT based on multi-ray projections: a phantom study. Eur J
Nucl Med Mol Imaging 2007, 34:170-180.
29. Shen S, DeNardo GL, DeNardo SJ: Quantitative bremsstrahlung imaging of
yttrium-90 using a Wiener filter. Med Phys 1994, 21
:1409-1417.
30.
Stabin MG: Fundamentals of Nuclear Medicine Dosimetry New York: Springer;
2008.
31. Walrand S, Jamar F, van Elmbt L, Lhommel R, Bekonde EB, Pauwels S: 4-
Step renal dosimetry dependent on cortex geometry applied to 90Y
peptide receptor radiotherapy: evaluation using a fillable kidney
phantom imaged by 90Y PET. J Nucl Med 2010, 51:1969-1973.
32. Niemierko A: A unified model of tissue response to radiation. In
Proceedings of the 41st AAPM Annual Meeting: July 25-29 1999; Nashville,
Tennessee Edited by: William Hendee: AAPM 1999, 1100.
Walrand et al. EJNMMI Research 2011, 1:32
/>Page 13 of 14
33. Emami B, Lyman J, Brown A, Coia L, Goitein M, Munzenrider JE, Shank B,
Solin LJ, Wesson M: Tolerance of normal tissue to therapeutic irradiation.
Int J Radiat Oncol Biol Phys 1991, 21:109-122.
34. Gay HA, Niemierko A: A free program for calculating EUD-based NTCP
and TCP in external beam radiotherapy. Physica Medica 2007, 23:115-125.
35. Luxton G, Keall PJ, King CR: A new formula for normal tissue complication
probability (NTCP) as a function of equivalent uniform dose (EUD). Phys
Med Biol 2008, 53:23-36.
36. KUKA. [ />37. Kraus-Tiefenbacher U, Scheda A, Steil V, Hermann B, Kehrer T, Bauer L,
Melchert F, Wenz F: Intraoperative radiotherapy (IORT) for breast cancer
using the intrabeam™ system. Tumori 2005, 91:339-345.
38. Bjorken JD, Drell SD: Relativistic Quantum Mechanics New York: McGraw-Hill
Inc.; 1964.
39. Kamphuis C, Beekman FJ, van Rijk PP, Viergever MA: Dual matrix ordered
subsets reconstruction for accelerated 3D scatter compensation in
single-photon emission tomography. Eur J Nucl Med 1997, 25:8-18.
doi:10.1186/2191-219X-1-32
Cite this article as: Walrand et al.: Yttrium-90-labeled microsphere
tracking during liver selective internal radiotherapy by bremsstrahlung
pinhole SPECT: feasibility study and evaluation in an abdominal
phantom. EJNMMI Research 2011 1:32.
Submit your manuscript to a
journal and benefi t from:
7 Convenient online submission
7 Rigorous peer review
7 Immediate publication on acceptance
7 Open access: articles freely available online
7 High visibility within the fi eld
7 Retaining the copyright to your article
Submit your next manuscript at 7 springeropen.com
Walrand et al. EJNMMI Research 2011, 1:32
/>Page 14 of 14