Báo cáo hóa học: " Noise-robust speech feature processing with empirical mode decomposition" pptx
Bạn đang xem bản rút gọn của tài liệu. Xem và tải ngay bản đầy đủ của tài liệu tại đây (307.5 KB, 9 trang )
RESEARCH Open Access
Noise-robust speech feature processing with
empirical mode decomposition
Kuo-Hau Wu, Chia-Ping Chen
*
and Bing-Feng Yeh
Abstract
In this article, a novel technique based on the empirical mode decomposition methodology for processing speech
features is proposed and investigated. The empirical mode decomposition generalizes the Fourier analysis. It
decomposes a signal as the sum of intrinsic mode functions. In this study, we implement an iterative algorithm to
find the intrinsic mode functions for any given signal. We design a novel speech feature post-processing method
based on the extracted intrinsic mode functions to achieve noise-robustness for automatic speech recognition.
Evaluation results on the noisy-d igit Aurora 2.0 database show that our method leads to significant performance
improvement. The relative improvement over the baseline features increases from 24.0 to 41.1% when the
proposed post-processing method is applied on mean-variance normalized speech features. The proposed method
also improves over the performance achieved by a very noise-robust frontend when the test speech data are
highly mismatched.
1 Introduction
State-of-the-art automatic speech recognition (ASR) sys-
tems can achieve satisfactory performance under well-
matched conditions. However, when there is a mismatch
between the train data and the test d ata, the perfor-
mance often degrades quite severely. The versatility of
everyday environments requires ASR systems to func-
tion well in a wide range of unseen noisy conditions.
Therefore, noise-robust speech processing technology
for recognition is an important research topic.
Many techniques for noise-robustness have been pro-
posed and put to tests. Speech enhancement methods,
such as the well-known spectral subtraction [1] and
Wiener filters [2], introduce pre-processing steps to
remove the noise part or estimate the clean part given
the noisy speech signal. Auditory frontend approaches
incorporate knowledge of human auditory systems
acquired from psychoacoustic experiments, such as criti-
cal bands and spectral/temporal masking effects [3,4], in
the process of speech feature extraction. Noise-robust
feature post-processing techniques, such a s cepstral
mean subtraction (CMS) [5], cepstral variance normali-
zation (CVN) [6], and histogram equalization (HEQ) [7],
aim to convert raw speech features to a form that is less
vulnerable to the corruption of adverse environments.
In this article, we study a feature post-processing tech-
nique for noise-robust ASR based on the empirical
mode decomposition (EMD) [8]. Thro ugh EMD, a fea-
ture sequence (as a function of time) is decomposed
into intrinsic mode functions (IMFs). The basic idea
behind ou r proposed method is that the low-order IMFs
contain high-frequency components and they are
removed based on a threshold estimated from training
data. Alternatively, the recombination weights can be
decided using other algorithms [9]. Since EMD is a tem-
poral-domain technique, a comparison o f EMD with
common temporal processing techniques is in order. In
the RASTA processing of speech [10], a filter combining
temporal difference and integration effects is designed.
It results in a bandpass filter, which discriminates
speech and noise by their difference in temporal proper-
ties. The RASTA processing technique is generally con-
sidered very effective for both additive and convolution
noises. However, a basic assumption underlying any fil-
tering technique is that the signals being processed are
approximatel y stationary, which may not be the case for
speech or non-stationary noises. Fu rthermore, using lin-
ear filters implies a decomposition of signal into sinusoi-
dal f unctions. In contrast, IMFs used in EMD are data
driven, so they are theoretically more general than
* Correspondence:
Department of Computer Science and Engineering, National Sun Yat-Sen
University, 70 Lien-Hai Road, Kaohsiung 800, Taiwan
Wu et al. EURASIP Journal on Audio, Speech, and Music Processing 2011, 2011:9
/>© 2011 W u et al; licensee Springer. This is an Open Access article distributed under the terms of the Creative Commons Attrib ution
License ( which permits unrestri cted use, dis tribution , and reproduction in any medium,
provided the original work is properly cited.
sinusoidal functions, and may lead to better si gnal-noise
decomposition. A comparison between the results of
using EMD and RASTA is given in Section 5. In modu-
lation spectrogram approach [11], modulation patterns
of temporal envelope signals of the critical-band chan-
nels are represented by the amplitudes at 4-Hz (via
FFT) dynamically. This representation proves to be
robust for syllable recognition under noise corruption.
For a different application, critical parameters of central
frequency may have to be tuned. In temporal modula-
tion processing of speech signals [12], the DC part of
the signal is denoised for better speec h detection in
noisy conditions, and to provide an SNR estimator via
cross-correlation with low modulation-frequency (1.5-
Hz) part of the signal. In contrast to the above reviewed
methods of temporal processing, we note that the pro-
posed EMD does not a ssume stationarity of signal, and
there are no task-dependent parameters to be tuned
when we extract IMFs.
The rest of article is organized as follows. In Section
2, we introduce the formulation of EMD and show that
it is a generalization of the Fourier analysis. In Section
3, we design an iterative algorithm to extract IMFs for
EMD. In Section 4, w e describe t he proposed EMD-
based feature post-processing method and give a few
illu strative examples. Experimental results are pre sented
in Section 5. Finally, concluding remarks are summar-
ized in Section 6.
2 Em pirical mode de composition
The EMD generalizes the Fourier series. Sinusoidal basis
functions used i n the Fourier analysis are generalized to
data-dependent IMFs. Compared to a sinusoidal func-
tion, an IMF satisfies the generalized alternating prop-
erty and the gener alized zero-mean property, and relaxes
the amplitude and frequency from being constant to
being generally time-varying.
2.1 The Fourier series
A signal x(t) of finite duration, say T, can be represented
by a Fourier series, which is a weighted sum of complex
exponential functions with frequenc ies ω
k
=2πk/T.
That is, we can write
x(t)=
∞
k
=−∞
r
k
e
jω
k
t
= r
0
+
∞
k
=1
(r
k
+ r
−k
)cosω
k
t + j
∞
k
=1
(r
k
− r
−k
)sinω
k
t
.
(1)
Defining
p
k
= r
k
+ r
−k
, q
k
= j
(
r
k
− r
−k
)
, k =1,2,
,
(2)
we can re-write (1) as
x(t)=r
0
+
∞
k
=1
p
k
cos ω
k
t +
∞
k
=1
q
k
sin ω
k
t
.
(3)
If x(t) is real, p
k
, q
k
in (2) are real. Equation 3 can be
seen as a decomposition of x(t) in the vector space
spanned by the following basis set:
B
=
{
1
}
∪
{
cos ω
k
t, k =1,2,
}
∪
{
sin ω
k
t, k =1,2,
}.
(4)
The following properties of about basis functions of
the Fourier series are quite critical in the generalization
to EMD.
• (alternating property)Abasisfunctionhasalter-
nating stationary points and zeros. That is, there is
exactly one zero between two stationary points, and
exactly one stationary point between two zeros.
• (zero-mean property) T he maxima and minima of
the basis functions are opposite in sign, and the
average of the maxima and the minima is 0.
2.2 Empirical mode decomposition
In EMD, a real-valued signal x (t) is decomposed as
x(t) ≈
k
c
k
(t )
.
(5)
Those c
k
(t)s in (5) ar e called IMFs. As generalization
of sinusoidal function, an IMF is required to satisfy the
following generalized properties.
• (generalized alternating property)Thedifference
between the number of extrema (maxima and
minima) and the number of zeros is either 0 or 1.
• (generalized zero-mean property) The average of
theupperenvelope(asmoothcurvethroughthe
maxima) and the lower envelope (a smooth curve
through the minima) is zero.
The amplitude and frequency of an IMF are defined as
follows. Given a real-valued function c
k
( t), let d
k
( t)be
the Hilbert transform of c
k
(t). A complex function f
k
(t)
is formed by
f
k
(
t
)
= c
k
(
t
)
+ jd
k
(
t
)
= α
k
(
t
)
e
j(
∫
v
k
(t)dt)
.
(6)
In (6), we identify a
k
(t)andν
k
(t) as the time-dep en-
dent amplitude and the time-dependent frequency of f
k
(t). Note that the Fourier analysis is a special case of (6),
since sinω
k
t is the Hilbert transform of cosω
k
t . While
sinusoidal functions have constant amplitudes and fre-
quencies, IMFs have t ime-varying amplitudes and
frequencies.
3 Intrinsic mode functions
The core problem for EMD is to find IMFs given a sig-
nal. In the following subsections, we state the algorithm
Wu et al. EURASIP Journal on Audio, Speech, and Music Processing 2011, 2011:9
/>Page 2 of 9
that we design for EMD and highlight properties of
IMFs with an illuminating instance.
3.1 Extraction algorithm
The pseudocode o f the extraction of IMFs is stated as
follows.
Require:inputsignalx(t), maximum number of IMFs K;
remainder function r(t);
extracted IMF c
k
(t);
upper envelope function u(t);
lower envelope function l(t);
hypothetical function h(t);
k := 1;
r(t):=x(t);
while k ≤ K and r(t) is not monotonic do
h(t)=0;
while h(t) is not an IMF do
u(t) ¬ the upper envelope of r(t);
l(t) ¬ the lower envelope of r(t);
h(t ) ← r(t) −
1
2
(u(t)+l(t)
)
;
if (h(t) is an IMF or a stopping criterion is
met) then
c
k
(t) ¬ h(t);
r(t) ← x(t) −
k
i
=1
c
i
(t )
;
k ¬ k +1;
else
r(t) ¬ h(t);
end if
end while
end while
return the IMF c
k
(t)’s;
In this algorithm, there is an outer loop to control the
number of IMFs and there is an inner loop to find the
next IMF given the current remainder function. The
spline interpolation is used to find envelopes (cf. Section
4.2). To g uard against slow convergence, we enforce a
criterion to terminate the iteration if the difference
between the old and new candidates of h(t)isbelowa
threshold.
3.2 An important property
In the extraction of IMFs, the remainder function r(t)is
recursively replaced by the hypothetical function h(t),
r(t) ← h(t)=r ( t) −
1
2
(u(t)+l(t))
.
(7)
The envelopes u(t)andl(t) are smoother than r( t)as
each envelope is the spline interpolation of a proper
subset of points of r(t). Being the remainder after the
subtraction of the envelope mean, h(t) approximates the
time-varying local high-frequency part of r(t). Whenever
h (t) is a valid IMF, it is set to c
k
( t)andsubtracted,so
the remaining part of signal is smoother. Thus, we
expect c
k
(t)tobeprogressively smooth as k increases.
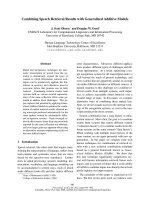
For an illustrative example, IMFs extracted from the
log-energy sequence of an utterance in the Aurora 2.0
database with a signal-to-noise ratio (SNR) of 0 dB are
shown in Figure 1. One can see clearly that the degree
of oscillation decreases as k increases, as is predicted by
our analysis.
4 EM D-based feature post-processing
The goal of speech feature post-processing is to reduce
the mismatch between clean speech and noisy speech.
In order to achieve this goal, we first look at the pat-
terns introduced by the presence of noises of varying
levels, then we propose a method to counter such
patterns.
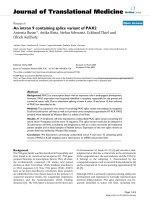
The patterns created by noises of several SNRs can be
observed on the log-energy sequences of an underlying
clean utterance in the Aurora 2.0 d atabase, as shown at
the top of Figure 2. We can see that the degree of oscil-
lation of the speech feature sequence increases with the
noise level. That is, the spurious spikes in the sequence
basically stems from the noise signal, rather than from
the speech signal.
4.1 Basic idea
Since the spikes introduced by the noise are manifest in
the low-order IMFs, we propose to subtract these IMFs
to alleviate mismatch. That is, for a noisy speech signal
x(t) with EMD
x(t)=
K
k
=1
c
k
(t )+r(t)
,
(8)
we simply subtract a small number, say N,ofIMFs
from x(t), i.e.,
ˆ
x(t)=x(t) −
N
n
=1
c
n
(t )
.
(9)
At the bottom of Figure 2, EMD post-processed
sequences of the same instances are shown. Comparing
them to the original sequences at the top, we can see
that the mismatch between clean and noisy speech is
significantly reduced.
4.2 Implementation details
The spline interpolation is employed to find upper and
lower envelopes during the process of IMF extraction.
For upper envelopes (and similarly for lower envelope s),
we use the local maximum points and the end points as
the interpolation po ints. These interpolation points
Wu et al. EURASIP Journal on Audio, Speech, and Music Processing 2011, 2011:9
/>Page 3 of 9
divide the entire time span into segments, and each seg-
ment, say segment i, is interpolated by a cubic function,
s
i
(
t
)
= α
i
(
t − t
i
)
3
+ β
i
(
t − t
i
)
2
+ γ
i
(
t − t
i
)
+ δ
i
,
(10)
where the parameters a
i
, b
i
, g
i
, δ
i
can be decided by
requiring the overall interpolation function to be contin-
uous up to the second-order derivatives [13].
In the extraction algorithm, we also guard against per-
petual changes in the extraction process of IMF via a
threshold on the standard deviation (SD), which is
defined as follows:
SD =
T
t
=1
h
o
(t ) − h
n
(t )
2
h
2
0
(t )
≤ σ
,
(11)
where T is the total number of points in the sequence,
h
o
(t)andh
n
(t) are the old and new candidates for IMF.
In our experiments, we set s = 0.25 [8]. The number of
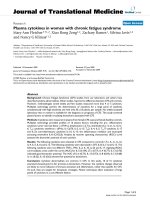
iterations needed to find the first IMF varies with the
input s ignal. The histogram (statistics) o f this iteration
scheme applied on a data set is given in Figure 3.
5 Experiments
The proposed EMD-based approach to noise-robustness
is evaluated on the Aurora 2.0 database [14]. After the
baseline results are reproduced, we first apply the com-
monly used per-utterance mean-variance normalized
(MVN) on the speech features to boost the perfor-
mance, then we apply the proposed EMD-based post-
processing to achieve further improvem ent. After seeing
−2
0
2
−2
0
2
Log energy features
−2
0
2
50 150 250 350
−2
0
2
Fr
a
m
e
c
1
(t)
c
2
(t)
c
3
(t)
c
4
(t)
Figure 1 The intrinsic mode functions extracted from the log-energy sequenc e of the utterance MKG_677884ZA, which is corrupted
by the subway noise with the signal-to-noise ratio of 0 dB.
0 50 100 150 200 250 300 350
5
10
15
20
clean
0 50 100 150 200 250 300 350
5
10
15
20
20db
0 50 100 150 200 250 300 350
5
10
15
20
15db
0 50 100 150 200 250 300 350
5
10
15
20
10db
0 50 100 150 200 250 300 350
5
10
15
20
5db
0 50 100 150 200 250 300 350
5
10
15
20
0db
0 50
1
00
1
50
2
00
2
50 300 350
5
10
15
20
−5db
0 50 100 150 200 250 300 35
0
−5
0
5
clean
0 50 100 150 200 250 300 35
0
−5
0
5
20db
0 50 100 150 200 250 300 35
0
−5
0
5
15db
0 50 100 150 200 250 300 35
0
−5
0
5
10db
0 50 100 150 200 250 300 35
0
−5
0
5
5db
0 50 100 150 200 250 300 35
0
−5
0
5
0db
0 50
1
00
1
50
2
00
2
50 300 350
−5
0
5
−5db
Figure 2 The log-energy sequences of the Aurora 2.0 utterance MKG_677884ZA under the corruption of the subway noise of different
SNRs. Left: the raw log-energy sequences; right: after the mean-variance normalization and the proposed EMD post-processing. Due to the
difference in dynamic range, the left-side block and the right-side block cannot have the same scale. Yet, it is not difficult to observe the degree
of similarity of both sides.
Wu et al. EURASIP Journal on Audio, Speech, and Music Processing 2011, 2011:9
/>Page 4 of 9
significant performance gain over the baseline, we apply
theproposedmethodtoETSIadvancedfrontend(AFE)
speech features [15] to see if further improvement can
be achieved on speech features that are already very
noise-robust to begin with. We also compare EMD with
the RASTA processing method.
5.1 Aurora database
The Aurora 2.0 noisy digit database is widely used for the
evaluation of noise-robust frontends [14]. Eight types of
additive noises are artificially added to clean speech data
with SNR levels ranging from 20 to -5 dB. The data may
be further convolved with two types of convolution
noises. The multi- train recognizer is trained by a data set
(called the multi-train set) consisting of clean and multi-
condition noisy speech samples. The clean-train recogni-
zer is trained by a data set (called the c lean-train set)
consisting of clean speech samples only. Test data in Set
A are matched to the multi-condition train data, test data
in Set B are not matched to the multi-condition train
data, and test data in Set C are further mismatched due
to convolution. Note that the proportion of the data
amounts of Set A, Set B, and Set C is 2 : 2 : 1.
5.2 Frontend and backend
The baseline speech feature vector consists of the static
features of 12 mel-frequency cepstral coefficients
(MFCC) C
1
, ,C
12
and the log energy. Dynamic fea-
tures of velocity (delta) and acceleration (delta-delta) are
also derived, resulting in a 39-dimension vector per
frame.
The standard backend recognizer of Aurora evaluation
[14] is adopted. That is, we use 16-state whole-word
models for digits, a 3-state silence model, and a 1-state
short-pause model. The state of the short-pause model
is tied to the middle state of the silence model. The
state-emitting probability density is a 3-component
Gaussian mixture for a word state, and a 6-component
Gaussian mixture for a silence/short-pause state.
5.3 Results
Three sets of experiments have been carried out in this
research. In the first set of experiments, noisy feature
sequences are replaced by the corresponding clea n fea-
ture sequences. This is possible in Aurora 2.0 because
clean and noisy sp eech data are “parallel”, i.e. each noisy
utterance has a corresponding clean utterance. The
results are compared to case where each sequence is
post-processed by EMD. In the second set of experi-
ments, various aspects of EMD are investigated. In the
final set of experiments, the proposed EMD method is
compared to the well-known temporal filtering method
of RASTA.
5.3.1 Feature replacement experiments
The first set of experiments is designed to determine
which speech feature sequence is to be applied the
EMD-based post-processing. For each of the 13 static
features, we replace noisy feature sequences with c lean
feature sequences (RwC: replace with clean). Based on
the results summarized in Table 1, it is clear that repla-
cing noisy log-energy sequence leads to the most signifi-
cant improvement. The performance level decreases as
we move down the tab le from C
1
to C
12
. Thus, unless
otherwise stated, in the remaining investigation, we
focus on using log-energy sequences as the targets to be
processed by the proposed EMD.
1 2 3 4 5 6
0
500
1000
1500
2000
2500
3000
3500
4000
iteration number
coun
t
171
3382
3866
878
126
17
Figure 3 The histogram of the number of iterations needed to find the first IMF c
1
(t) for the 8440 utterances of clean-train dataset of
Aurora 2.0. The actual counts are 171, 3382, 3866, 878, 126, and 17.
Wu et al. EURASIP Journal on Audio, Speech, and Music Processing 2011, 2011:9
/>Page 5 of 9
In addition, we apply the proposed EMD to noisy fea-
ture sequences and the results are a lso shown in Table
1. It is interesting to see that EMD even leads to better
performance than clean feature replacement in the cases
from C
2
to C
12
. Furthermore, applying EMD to all fea-
tures does not yield better performance than EMD on
log energy alone, although the performance levels are
quite close. Higher-order cepstral features provide infor-
mation for the more delicate structures in the speech
signal. It is more difficult to recover such information
lost in the presence of noise through EMD. In contrast,
the loss o f information conveyed by log energy due to
noise is relatively easy to recover.
5.3.2 Effectiveness of EMD
The recognition accuracy rates of clean-train tasks aver-
aged over 0-20 dB noisy test data with different degrees
of feature post-processing are listed in Table 2. The row
of “baseline” shows the results o f using the raw speech
features extracted by the ETSI standard frontend. The
row of “MVN” shows the results after the application of
the mean-variance normalization (MVN). MVN achieves
24.0% relative improvement.
The proposed EMD-based method is applied to the
log-energy feature sequences, by subtracting the first
IMF for each utterance. Applying EMD on the MVN
feature sequence, the relative improvement improves
from 24.0 to 41.1%. The results show that the EMD-
based post-processing of subtracting IMF s from the
speech feature sequences significantly reduce the mis-
match between clean and noisy feature sequences.
It is very encouraging to see that the case of most sig-
nificant improvement by EMD is with Set C (66.4-
75.3%). W e note that Set C contains arguab ly the most
mismatched data because that convolution noises are
applied to the utterances in addition to additive noises.
With only MVN, the accuracy level on Set C is signifi-
cantly below Set A or Set B. After EMD, the accuracy
levels of the three sets become very close. Thus, EMD
does increase the noise-robustness of the ASR system.
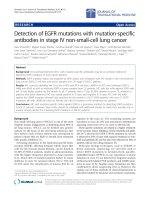
Detailed compar ison between the word accuracy rates
of the MVN method and the proposed EMD-based
post-processing method are broken down in Table 3. In
addition, we present a scatter plot of the word accur acy
rates in Figure 4. It can be clearly seen that the recogni-
tion accuracy is improved by EMD.
In addition to ETSI basic frontend feature sequence,
we also apply the proposed EMD-based method on
ETSI AFE feature sequence. It is important for us to
point out that AFE is a strongly noise-robust frontend,
which combines modules for voice activity detection
(VAD), Wiener-filter noise reduction, and blind
Table 1 The word accuracy rates of clean-train tasks
20 dB 15 dB 10 dB 5 dB 0 dB -5 dB
RwC EMD RwC EMD RwC EMD RwC EMD RwC EMD RwC EMD
L.E. 98.0 96.5 95.8 93.3 89.8 85.7 76.2 68.3 51.9 37.5 30.2 13.8
C
1
95.8 95.8 91.2 91.0 81.0 79.8 63.4 57.2 37.7 27.4 16.3 11.3
C
2
95.1 96.0 88.1 91.2 72.7 79.7 49.3 56.9 25.1 27.0 10.1 10.8
C
3
95.3 95.8 88.1 90.9 72.2 79.0 45.5 55.6 21.7 25.3 10.8 10.3
C
4
94.0 95.8 85.7 90.8 69.2 79.0 46.1 55.8 22.9 24.9 10.4 10.1
C
5
94.5 95.7 86.8 90.6 70.5 78.6 45.9 55.4 22.0 25.8 10.1 10.7
C
6
94.3 95.7 86.2 90.6 68.5 78.4 42.9 54.9 20.0 25.2 9.3 10.6
C
7
94.6 95.7 86.3 90.6 68.5 78.4 42.6 54.8 19.6 24.8 9.7 10.3
C
8
94.3 95.8 86.0 90.8 67.8 78.5 41.9 55.1 19.3 25.5 9.7 10.9
C
9
94.4 96.0 88.8 91.0 71.1 79.1 42.7 55.7 18.5 26.0 9.9 10.8
C10 94.4 95.9 86.1 90.7 68.0 78.6 42.3 55.0 19.5 24.9 9.5 10.1
C11 94.4 95.6 86.1 90.3 68.4 78.3 42.2 54.6 19.0 24.8 9.2 10.3
C12 94.3 95.9 85.9 90.9 67.7 78.6 41.7 54.9 19.0 25.2 9.2 10.5
All 96.5 93.1 85.6 68.2 37.2 13.7
None 94.1 85.5 67.0 40.6 18.3 9.0
The noisy feature sequences are replaced with the clean feature sequences or they are processed by the proposed EMD-based method . Each number in the
table is the average word accuracy over 10 test subsets, 4 subsets from Set A, 4 subsets from Set B, and 2 subsets from Set C for each SNR. RwC: Replaced with
Clean; L.E.: the log-energy sequence; C
i
:theith MFCC sequence; all: the entire feature vector; none: no replacement or post-processing (baseline).
Table 2 Word accuracy rates of the Aurora 2.0 clean-train
tasks for the 0-20 dB SNR test data, using the proposed
method
Set A Set B Set C Avg. Rel. imp.
Baseline 61.3 55.8 66.1 60.1 =
MVN 70.2 70.8 66.4 69.7 24.0
MVN+EMD(e) 76.8 76.7 75.3 76.5 41.1
AFE 87.5 87.0 85.6 86.9 67.1
AFE+EMD 87.6 86.6 86.1 86.9 67.1
Baseline: raw features; MVN: mean variance normalization; MVN+EMD(e): EMD
applied on the log-energy sequence; AFE: advanced frontend; AFE+EMD: EMD
applied on the combined C
0
/log-energy sequence of AFE.
Wu et al. EURASIP Journal on Audio, Speech, and Music Processing 2011, 2011:9
/>Page 6 of 9
equalization. From Table 3, we can see that while AFE
already achieves a relative improvement of 67.1% over
the baseline, the application of EMD fur ther improves
the performance, achieving further improvements in
Sets A and C. The improvement on the most
mismatched test data set (Set C) is t he most significant
(from 85.6 to 86.1%).
We also compare subtracting different numbers of
IMFs. Essentially, the more IMFs are subtracted, the
smoother the resultant sequence becomes. Recognition
accuracies when subtracting 1 IMF (MVN+EMD1) and
2 IMFs (MVN+EMD2) are listed in Table 4. From the
results, we can see that for the noisier 0 and -5 dB data,
MVN+EMD2 yields better accuracy. The results confirm
that we should subtract fewer IMFs in higher SNRs,
because the interference of noise is not as severe as in
lower-SNR cases.
Based on the argume nts given i n Section 4, it is clear
that the noise level and the number of IMFs to be sub-
tracted from the signal to reduce mismatch are closely
related. Therefore, we use a scheme that allows the
Table 3 The word accuracy rates of MVN and the proposed EMD method for every noise condition and every test
subset (70 subsets total) of the Aurora 2.0 clean-train tasks
Clean training–results
EMD A B C (MIRS)
Sub Bab Car Exh Avg Res Str Air Sta Avg Sub Str Avg
Clean 98.3 99.5 98.5 98.7 98.8 98.3 98.5 98.5 98.7 98.5 98.5 98.7 98.6
20 dB 96.0 97.1 96.7 95.6 96.4 97.1 96.7 96.5 96.1 96.6 96.2 96.8 96.5
15 dB 93.8 94.0 93.7 91.9 93.4 93.9 93.7 94.1 92.9 93.7 92.7 93.1 92.9
10 dB 86.0 87.4 86.5 82.8 85.7 87.0 87.3 86.6 86.0 86.7 84.6 85.1 84.9
5 dB 73.1 68.2 69.7 66.6 69.4 67.9 71.5 70.1 66.5 69.0 66.1 67.2 66.7
0 dB 43.6 33.7 37.3 41.3 40.0 36.0 42.0 38.2 34.2 37.6 34.4 37.1 35.8
-5 dB 16.3 11.6 12.0 17.1 14.3 12.8 15.9 13.5 11.9 13.5 12.3 15.2 13.8
0-20 dB 78.5 76.1 76.8 75.6 76.8 76.4 78.2 77.1 75.1 76.7 74.8 75.9 75.3
MVN A B C (MIRS)
Sub Bab Car Exh Avg Res Str Air Sta Avg Sub Str Avg
Clean 98.8 99.0 98.9 98.9 98.9 98.8 99.0 98.8 98.9 98.9 99.0 99.0 99.0
20 dB 96.0 96.6 95.9 94.7 95.8 96.5 96.5 96.6 95.8 96.4 94.8 95.7 95.3
15 dB 92.4 92.8 91.2 89.8 91.6 93.2 92.1 92.2 91.2 92.2 88.0 59.3 73.7
10 dB 82.5 92.6 79.0 77.0 82.8 93.0 81.7 81.1 80.0 84.0 73.4 75.1 74.3
5 dB 61.7 56.4 55.6 55.5 57.3 59.4 60.1 58.3 53.8 57.9 48.7 51.2 50.0
0 dB 31.3 22.5 22.4 27.9 26.0 26.6 29.5 26.7 21.3 26.0 22.6 25.0 23.8
-5 dB 11.5 9.5 8.8 12.1 10.5 11.2 12.0 10.6 9.0 10.7 9.5 11.6 10.6
0-20 dB 72.8 72.2 68.8 69.0 70.7 73.7 72.0 71.0 68.4 71.3 65.6 61.2 63.4
0 10 20 30 40 50 60 70 80 90 10
0
0
10
20
30
40
50
60
70
80
90
100
ori
g
inal
EMD processed
Figure 4 The scatter plot of word acc uracy before and after
EMD process. The x-axis is the word accuracy rate before the
proposed EMD processing and the y-axis is the word accuracy rate
after the EMD processing. A point in the plot corresponds to a test
data subset in the Aurora 2.0 corpus, and there are 70 points. The
line is x=y, so we can see that the EMD processing technique
improves the recognition accuracy.
Table 4 Word accuracy rates of Aurora 2.0 clean-train
tasks for the 0-20 dB SNR test data, subtracting 1 (MVN
+EMD1) or 2 (MVN+EMD2) IMFs
MVN+EMD1 MVN+EMD2 Diff.
Clean 98.4 98.2 +0.2
20 dB 96.3 96.0 +0.3
15 dB 93.3 92.9 +0.4
10 dB 85.8 85.0 +0.8
5 dB 68.6 68.6 +0.0
0 dB 39.6 41.9 -2.3
-5 dB 16.6 18.8 -2.2
Wu et al. EURASIP Journal on Audio, Speech, and Music Processing 2011, 2011:9
/>Page 7 of 9
number of IMFs to be subtracted from speech feature
sequences to vary from utterance to utterance. We calcu -
late the average oscillation frequency of the log-energy
feature s equences from the clean-tr ain data and us e it as
a threshold. If the oscillation frequency of the remainder
is lower than the threshold, we stop finding and subtract-
ing the next IMF. The results of recognition experiments
are listed in Table 5. We can see that this scheme,
denoted by MVN+EMDd, does outperform the schemes
of subtracting a fixed number (1 or 2) of IMFs. We also
inspect the number of IMFs, N in (9), subtracted in the
dynamic scheme of EMD. Figure 5 shows the average of
N on the test set as a function of SNR, for t he MVN fea-
ture and the AFE feature. As expected, it increases as
SNR decreases, i.e., as the noise level increases.
5.3.3 EMD and RASTA
Since EMD is essentially a tech nique that alters feature
sequences in the tempor al domain, it is of interest to
compare its effectiveness with common temporal-
domain techniques. The proposed EMD method is com-
pared to the RASTA processing since both are temporal
processing techniques. The results are summarized in
Table 6, and it is clearly seen that EMD outperforms
the RASTA in this evaluation. The result s support our
analysis in Section 1 from the theoretical perspective
that EMD is potentially more effective on non-stationary
signals than conventional techniques based on temporal
filtering. Decomposition with IMFs is more general than
decomposition with sinusoidal functions, in allowing
time-varying amplitudes and frequencies for input
signals.
It is important to point out that EMD processing is an
utterance-level method, so the latency is generally
longer than using frame-level methods such as the
Table 5 Word accuracy rates of Aurora 2.0 clean-train
tasks for 0-20 dB SNR test data
Set A Set B Set C Avg.
MVN+EMD1 76.3 77.2 76.6 76.7
MVN+EMD2 76.2 77.5 77.0 76.8
MVN+EMDd 77.6 78.7 77.6 78.0
Comparison of subtracting 1, 2, or a dynami c number (MVN+EMDd) of IMFs.
C
lean
S
NR2
0 S
NR1
5 S
NR1
0 S
NR
5 S
NR
0 S
NR−
5
0.4
0.6
0.8
1
1.2
1.4
AFE+EMDd
MVN+EMDd
Figure 5 The average of the number of IMFs e xtracted for the
MVN and AFE features as a function of SNR. For each utterance,
the extraction of IMFs stops when the oscillation of r(t) is below a
threshold determined by the train data set. It is clear that the
average number increases with the level of noise.
Table 6 The comparison of RASTA and the proposed EMD method for every noise condition and every test subset (70
subsets total) of the Aurora 2.0 clean-train tasks
Clean training–results
EMD A B C (MIRS)
Sub Bab Car Exh Avg Res Str Air Sta Avg Sub Str Avg
Clean 98.3 99.5 98.5 98.7 98.8 98.3 98.5 98.5 98.7 98.5 98.5 98.7 98.6
20 dB 96.0 97.1 96.7 95.6 96.4 97.1 96.7 96.5 96.1 96.6 96.2 96.8 96.5
15 dB 93.8 94.0 93.7 91.9 93.4 93.9 93.7 94.1 92.9 93.7 92.7 93.1 92.9
10 dB 86.0 87.4 86.5 82.8 85.7 87.0 87.3 86.6 86.0 86.7 84.6 85.1 84.9
5 dB 73.1 68.2 69.7 66.6 69.4 67.9 71.5 70.1 66.5 69.0 66.1 67.2 66.7
0 dB 43.6 33.7 37.3 41.3 40.0 36.0 42.0 38.2 34.2 37.6 34.4 37.1 35.8
-5 dB 16.3 11.6 12.0 17.1 14.3 12.8 15.9 13.5 11.9 13.5 12.3 15.2 13.8
0-20 dB 78.5 76.1 76.8 75.6 76.8 76.4 78.2 77.1 75.1 76.7 74.8 75.9 75.3
RASTA A B C (MIRS)
Sub Bab Car Exh Avg Res Str Air Sta Avg Sub Str Avg
Clean 98.8 98.9 99.1 99.2 99.0 98.8 98.9 99.1 99.2 99.0 98.7 98.8 98.8
20 dB 95.7 96.9 96.7 95.2 96.1 95.8 96.6 96.9 97.1 96.6 95.4 96.0 95.7
15 dB 90.1 91.6 89.7 88.8 90.1 91.9 90.3 92.9 90.9 91.5 89.7 90.9 90.3
10 dB 71.4 75.6 64.2 70.4 70.4 79.1 70.0 79.6 72.8 75.4 72.2 72.5 72.4
5 dB 39.8 43.2 30.0 34.6 36.9 50.8 41.3 48.6 40.0 45.2 40.7 40.4 40.6
0 dB 20.6 20.2 17.6 16.1 18.6 24.0 20.3 25.0 20.3 22.4 20.5 20.3 20.4
-5 dB 12.8 10.9 10.1 8.4 10.6 12.2 10.6 13.5 10.5 11.7 12.5 10.8 11.7
0-20 dB 63.5 65.5 59.6 61.0 62.4 68.3 63.7 68.6 64.2 66.2 63.7 64.0 63.9
Wu et al. EURASIP Journal on Audio, Speech, and Music Processing 2011, 2011:9
/>Page 8 of 9
RASTA filter or the advanced ETSI frontend. There is a
trade-off between complexity, latency, and accuracy. In
certain scenarios where low latency is critical, fast on-
line/sequential methods without significant sacrifice in
performance may be preferred to batch techniques.
6 Conclusion
In this article, we propose a feature post-processing
scheme for n oise-robust speech recognition frontend
based on EMD. We introduce EMD as generalization of
the Fouri er analysis. Our motivation is that speech sig-
nals are non-stationary and non-linear, so EMD is theo-
retically superior to Fourier analysis for signal
decomposition. We implement an algorithm to find
IMFs. Based on properties of the extracted IMFs, we
propose to subtract low-order IMFs to reduce the mis-
match between clean and noisy data. Evaluation results
on the Aurora 2.0 database show that the proposed
method can effectively improve recognition accuracy.
Furthermore, with the ETSI AFE speech features, which
are very noise-robust by design, the application of EMD
method further improves recognition accuracy, which is
very remarkable.
Competing interests
The authors declare that they have no competing interests.
Received: 4 May 2011 Accepted: 15 November 2011
Published: 15 November 2011
References
1. S Boll, Suppression of acoustic noise in speech using spectral subtraction.
IEEE Trans Acoust Speech Signal Process. 27(2), 113–120 (1979). doi:10.1109/
TASSP.1979.1163209
2. A Berstein, I Shallom, A hypothesized Wiener filtering approach to noisy
speech recognition, in ICASSP, 913–916 (1991)
3. W Zhu, D O’Shaughnessy, Incorporating frequency masking filtering in a
standard MFCC feature extraction algorithm, in Proceedings of the IEEE
International Conference on Signal Processing, 617–620 (2004)
4. B Strope, A Alwan, A model of dynamic auditory perception and its
application to robust word recognition. IEEE Trans Speech Audio Process.
5(5), 451–464 (1997). doi:10.1109/89.622569
5. S Furui, Cepstral analysis technique for automatic speaker verification. IEEE
Trans Acoust Speech Signal Process. 29(2), 254–272 (1981). doi:10.1109/
TASSP.1981.1163530
6. O Viikki, D Bye, K Laurila, A recursive feature vector normalization approach
for robust speech recognition in noise, in Proceedings of the ICASSP
733–736 (1998)
7. A de La Torre, A Peinado, J Segura, J Perez-Cordoba, M Benitez, A Rubio,
Histogram equalization of speech representation for robust speech
recognition. IEEE Trans Speech Audio Process. 13(3), 355–366 (2005)
8. N Huang, Z Shen, S Long, M Wu, H Shih, Q Zheng, N Yen, C Tung, H Liu,
The empirical mode decomposition and the Hilbert spectrum for nonlinear
and non-stationary time series analysis. Proc R Soc London Ser A Math Phys
Eng Sci. 454, 903–995 (1998). doi:10.1098/rspa.1998.0193
9. XY Li, The FPGA implementation of robust speech recognition system by
combining genetic algorithm and empirical mode decomposition, Master’s
thesis, National Kaohsiung University (2009)
10. H Hermansky, N Morgan, RASTA processing of speech. IEEE Trans Speech
Audio Process. 2(4), 578–589 (1994). doi:10.1109/89.326616
11. S Greenberg, BED Kingsbury, The modulation spectrogram: in pursuit of an
invariant representation of speech, in Proceedings of the ICASSP , 1647–1650
(1997)
12. H You, A Alwan, Temporal modulation processing of speech signals for
noise robust ASR, in Proceedings of the INTERSPEECH 36–39 (2009)
13. GD Knoty, Interpolating Cubic Splines (Birkhäuser, Boston, 1999)
14. D Pearce, H Hirsch, The AURORA experimental framework for the
performance evaluation of speech recognition systems under noisy
conditions, in ICSA ITRW ASR2000 (September 2000)
15. ETSI Standard ETSI ES 202 050: Speech processing, transmission and quality
aspects (STQ); distributed speech recognition; advanced front-end feature
extraction algorithm; compression algorithms (2007)
doi:10.1186/1687-4722-2011-9
Cite this article as: Wu et al .: Noise-robust speech feature processing
with empirical mode decomposition. EURASIP Journal on Audio, Speech,
and Music Processing 2011 2011:9.
Submit your manuscript to a
journal and benefi t from:
7 Convenient online submission
7 Rigorous peer review
7 Immediate publication on acceptance
7 Open access: articles freely available online
7 High visibility within the fi eld
7 Retaining the copyright to your article
Submit your next manuscript at 7 springeropen.com
Wu et al. EURASIP Journal on Audio, Speech, and Music Processing 2011, 2011:9
/>Page 9 of 9