Báo cáo hóa học: " Mild hypoglycemia is strongly associated with increased intensive care unit length of stay" pdf
Bạn đang xem bản rút gọn của tài liệu. Xem và tải ngay bản đầy đủ của tài liệu tại đây (544.99 KB, 29 trang )
This Provisional PDF corresponds to the article as it appeared upon acceptance. Fully formatted
PDF and full text (HTML) versions will be made available soon.
Mild hypoglycemia is strongly associated with increased intensive care unit
length of stay
Annals of Intensive Care 2011, 1:49 doi:10.1186/2110-5820-1-49
James S Krinsley ()
Marcus J Schultz ()
Peter E Spronk ()
Floris van Braam Houckgeest ()
Johannes P van der Sluijs ()
Christian Melot ()
Jean-Charles Preiser ()
ISSN 2110-5820
Article type Research
Submission date 15 July 2011
Acceptance date 24 November 2011
Publication date 24 November 2011
Article URL />This peer-reviewed article was published immediately upon acceptance. It can be downloaded,
printed and distributed freely for any purposes (see copyright notice below).
Articles in Annals of Intensive Care are listed in PubMed and archived at PubMed Central.
For information about publishing your research in Annals of Intensive Care go to
/>For information about other SpringerOpen publications go to
Annals of Intensive Care
© 2011 Krinsley et al. ; licensee Springer.
This is an open access article distributed under the terms of the Creative Commons Attribution License ( />which permits unrestricted use, distribution, and reproduction in any medium, provided the original work is properly cited.
1
Mild hypoglycemia is strongly associated with increased intensive care unit length of
stay
James Krinsley
1
, Marcus J. Schultz
2,3
, Peter E. Spronk
2,4
, Floris van Braam Houckgeest
5
,
Johannes P. van der Sluijs
6
, Christian Mélot
7
, and Jean-Charles Preiser
7,8
1
Division of Critical Care, Stamford Hospital, Columbia University College of Physicians and
Surgeons, Stamford, CT, USA
2
Department of Intensive Care, Academic Medical Center, University of Amsterdam,
Amsterdam, the Netherlands
3
Laboratory of Experimental Intensive Care and Anesthesiology (L·E·I·C·A), Academic
Medical Center, University of Amsterdam, Amsterdam, the Netherlands
4
Department of Intensive Care, Gelre Hospitals, location Lukas, Apeldoorn, the Netherlands
5
Department of Intensive Care, Tergooi Hospitals, location Blaricum, Blaricum, the
Netherlands
6
Department of Intensive Care Medicine, Medical Center Haaglanden, The Hague, the
Netherlands
7
Department of Intensive Care, Erasme University Hospital, Brussels, Belgium
2
8
Department of Emergency Medicine, Erasme University Hospital, Brussels, Belgium
Email addresses:
*JK:
MJS:
PES:
FvBH:
JPvdS:
CM:
JCP:
*Corresponding Author
Abstract
Background: Hypoglycemia is associated with increased mortality in critically ill patients.
The impact of hypoglycemia on resource utilization has not been investigated. The objective
of this investigation was to evaluate the association of hypoglycemia, defined as a blood
glucose concentration (BG) <70 mg/dL, and intensive care unit (ICU) length of stay (LOS) in
three different cohorts of critically ill patients.
Methods: This is a retrospective investigation of prospectively collected data, including
patients from two large observational cohorts: 3,263 patients admitted to Stamford Hospital
(ST) and 2,063 patients admitted to three institutions in The Netherlands (NL) as well as 914
patients from the GLUCONTROL trial (GL), a multicenter prospective randomized
controlled trial of intensive insulin therapy.
3
Results: Patients with hypoglycemia were more likely to be diabetic, had higher APACHE II
scores, and higher mortality than did patients without hypoglycemia. Patients with
hypoglycemia had longer ICU LOS (median [interquartile range]) in ST (3.0 [1.4–7.1] vs. 1.2
[0.8–2.3] days, P < 0.0001), NL (5.2 [2.6–10.3] vs. 2.0 [1.3–3.2] days, P < 0.0001), and GL
(9 [5–17] vs. 5 [3–9] days, P < 0.0001). For the entire cohort of 6,240 patients ICU LOS was
1.8 (1.0–3.3) days for those without hypoglycemia and 3.0 (1.5–6.7) days for those with a
single episode of hypoglycemia (P < 0.0001). This was a consistent finding even when
patients were stratified by severity of illness or survivor status. There was a strong positive
correlation between the number of episodes of hypoglycemia and ICU LOS among all three
cohorts.
Conclusions: This multicenter international investigation demonstrated that hypoglycemia
was consistently associated with significantly higher ICU LOS in heterogeneous cohorts of
critically ill patients, independently of severity of illness and survivor status. More effective
methods to prevent hypoglycemia in these patients may positively impact their cost of care.
Keywords: hypoglycemia; intensive care unit; length of stay; resource utilization; APACHE
II; mortality; intensive insulin therapy.
4
Introduction
Hyperglycemia occurs commonly in critically ill patients and is strongly associated with
increased risk of mortality [1-3]. During the past decade, a number of interventional trials
have assessed the impact of intensive insulin therapy (IIT) to correct even moderate degrees
of hyperglycemia; several have resulted in improvements in mortality and/or morbidity [4-6],
whereas a number did not demonstrate benefit [7-11]. Hypoglycemia, either spontaneous or
occurring as a complication of IIT, is a frequent occurrence in critically ill patients and is
independently associated with increased risk of mortality [12-15]. Whereas severe
hypoglycemia, usually defined as blood glucose level (BG) < 40 mg/dL, has been the focus of
most of these studies [9, 12-16], other investigators have demonstrated a deleterious impact of
even mild hypoglycemia—BG < 70 mg/dL—on survival in heterogeneous populations of
critically ill patients [17, 18].
The cost of treating intensive care unit (ICU) patients is enormous. It has been
estimated that 0.5–1.0% of the United States Gross Domestic Product is consumed in the
ICU, representing 20–30% of a typical hospital’s costs [19, 20]. A limited body of literature
has explored the impact of glycemic management protocols on the cost of care in ICU
populations [21-23]. These data suggest that significant cost savings accrue from amelioration
of hyperglycemia in the critically ill, associated with reductions in ICU length of stay (LOS),
ICU acquired infections, and decreases in pharmacy, laboratory, and diagnostic imaging use.
To date, however, no studies have investigated the impact of hypoglycemia on the cost of care
of critically ill patients.
The purpose of this study was to evaluate the impact of hypoglycemia, defined as BG < 70
mg/dL, on resource utilization in the ICU. The choice of a threshold value of 70 mg/dL was
based on several factors. Cryer has detailed the pathophysiologic consequences of
hypoglycemia defined at this threshold [24]. Moreover, two recent observational cohort
5
studies have demonstrated an independent association of mild hypoglycemia with mortality
[17, 18]. Consequently, we hypothesized that hypoglycemia would impact the magnitude of
resource utilization, reflected by ICU LOS.
We have the unique opportunity to analyze a large diverse group of critically ill patients in
this international collaboration; the 3 datasets include a large single-center cohort from an
ICU in the United States (Stamford Hospital), 3 ICUs from the Netherlands, and 21 ICUs
from Western Europe and Israel that participated in the GLUCONTROL trial, a multicenter
randomized controlled trial of intensive insulin therapy [8].
Methods
Settings, patients, glycemic control programs and data accrual
The Stamford cohort. Stamford Hospital is a 305-bed, university-affiliated hospital. The 16-
bed adult ICU treats a heterogeneous population of medical, surgical, and trauma patients.
Medical and surgical house staff, closely supervised by a team of intensivists, delivers care.
The patient cohort in Stamford (ST) includes 3,263 patients admitted to the ICU between
January 12, 2007 and April 30, 2010 who had at least three blood glucose values obtained
during their ICU stay. Forty-one patients admitted during this period with a diagnosis of
diabetic ketoacidosis or hyperosmolar nonketotic coma were excluded from the study. The
glycemic target during the period of the investigation was 80-125 mg/dL. Details of the
protocol have been published previously [24]. Most of the BG measurements (85%) were
made using bedside glucometers (AccuChek Inform, Indianapolis, IN) and capillary or
venous blood; the remainder were performed in the central laboratory using a using a Siemens
Advia 1800 analyzer (Siemens Medical Solutions, Malvern, PA) or in the ICU using a
GEM4000 point of care analyzer (Instrument Laboratory, Lexington, MA). Data were
6
abstracted from the ICU’s comprehensive clinical database. Diabetic status was determined
prospectively based on all available clinical information at the time of ICU admission.
The Dutch cohort. The three hospitals in the Netherlands are university-affiliated hospitals,
with 700 beds (Gelre Hospital, Apeldoorn, The Netherlands), 633 beds (Tergooi Hospitals,
Hilversum, The Netherlands), and 785 beds (Medical Center Haaglanden, The Hague, The
Netherlands). The 10-bed, 9-bed, and 18-bed adult ICUs treat a heterogeneous population of
medical, surgical, and trauma patients. A team of intensivists delivers care in a closed-format
setting. The patient cohort in the Netherlands (NL) includes 2,063 patients admitted to the
ICU between January 1, 2007 and December 29, 2009, who had at least three blood glucose
values obtained during their ICU stay: 1,098 patients (NL-L) admitted between January 1,
2007 and January 31, 2008 were subjected to a “loose” intensive insulin therapy guideline,
and 965 patients (NL-S) admitted between February 1, 2008 and December 29, 2009 were
subjected to a “strict” intensive insulin therapy guideline (see below for details on “loose” and
“strict” glucose control). Per protocol, patients admitted during this period with a diagnosis of
diabetic ketoacidosis or hyperosmolar nonketotic coma were not subjected to treatment
according to the guideline. Loose intensive insulin therapy: blood glucose control in the three
participating ICUs followed the 2004 Surviving Sepsis Campaign Guidelines [26] and aimed
for a BG < 150 mg/dl. Insulin dose and route of administration (intravenous or subcutaneous)
and timing and type of blood glucose measurement (using capillary or arterial blood, at the
bedside or in a central laboratory) were loosely defined in the guidelines in use. ICUs nurses
practiced blood glucose control. Strict intensive insulin therapy: blood glucose control in the
three participating ICUs aimed for a BG between 80-110 mg/dl; administration of insulin was
intravenous at all times, and BG measurements were performed at the bedside. Blood glucose
control required a high level of intuitive decision-making. All BG measurements were made
by using bedside glucometers (AccuChek Inform; Roche, Almere, The Netherlands) and
7
arterial blood. Details of the protocol have been published previously [27]. Data were
abstracted from the National Intensive Care Evaluation (NICE) database, created daily by the
responsible intensivists (PES, FvBH, JPvdS) and maintained by the NICE Foundation [28].
The GLUCONTROL cohort. This cohort included data from patients enrolled in the
GLUCONTROL trial [8] in 1 of the 21 units from 19 different hospitals in 7 different
countries of Western Europe and Israel, between November 3, 2004 and May 30, 2006. The
number of ICU beds of the participating units ranged from 5 to 44 (median, 12). Patients were
randomized to an intensive insulin therapy (target BG: 80-110 mg/dl) (GL-IIT) or to a control
arm (GL-C) with an intermediate glucose target (140-180 mg/dl), using an insulin protocol.
BG checks were performed on arterial or central venous samples when a catheter was in place
and a blood gas analyzer was preferentially used. Capillary samples and a specific glucometer
(Accu-Check Inform, Roche Diagnostics, Mannheim, Germany) were allowed. The data from
the 914 patients with at least three BG checks and survivor status were analyzed; the other
164 patients were evenly distributed between the GL-IIT and GL-C groups (n = 82 in each
arm).
Additional details about the glycemic control protocols used in the three cohorts can be found
in a recent publication [18].
Statistical analysis
Continuous data are presented as mean (standard deviation) or median (interquartile range), as
appropriate, and compared by using Student’s t test or the Mann-Whitney rank-sum test,
respectively. Ordinal data are presented as percentages and compared using the Chi-square
test. Multivariate analysis to assess the independent association of any hypoglycemia (BG <
70 mg/dL), as well as BG < 50 mg/dL and 50-69 mg/dL, with ICU LOS included the
following parameters found to be statistically significant at P < 0.1 on univariate analysis:
age, modified APACHE II score (age component deleted to avoid colinearity with age in the
8
multivariate analysis: age 45-54, 2 points; age 55-64, 3 points; age 65-74, 5 points; age >
75,
6 points), medical diagnostic category on admission to the ICU and mechanical ventilation.
The same model was used to assess independent contributors to the risk of prolonged ICU
stay, defined as greater than the 75
th
percentile for each cohort (3.1, 6.6, and 12.8 days for the
ST, NL, and GL cohorts, respectively). Diabetes was not associated with mortality on
univariate analysis and therefore was not entered into the multivariate model.
Mortality is defined throughout as hospital, not ICU, mortality. Statistical analysis was
performed using the MedCalc statistical package version 10.1.1.6.0 ().
Results
Characteristics of the patients
In brief, age (all five subpopulations) and diabetic status (data not available for NL cohorts)
were similar. The percentage of patients with nonsurgical admitting diagnoses ranged from
39.9% (GL-C) to 64.1% (NL-L). Mean (SD) APACHE II scores ranged from 16.0 (9.0) (ST)
to 19.7 (8.2) (NL-L), and mortality ranged from 14.2% (ST) to 27.5% (NL-L).
Significant differences in glycemic control also were noted [16]. The median (IQR) number
of BG measurements per day ranged from 5.1 (3.6-7.6) (NL-L) to 9.3 (8.0–11.3) (ST). Mean
BG (median, [IQR]) ranged from 117.9 (107.0–137.0) (NL-S) to 146.3 (128.1–164.6) (GL-C)
and coefficient of variation (CV, %) (median [IQR]) from 21.0 (14.8–28.5) (ST) to 31.8
(23.8–40.8) (NL-S). Finally, the percentage of patients who experienced at least one episode
of hypoglycemia (BG < 70 mg/dL) ranged from 17.8% (GL-C) to 64.9% (NL-S)
Comparison of patients with and without hypoglycemia
Table 1 demonstrates differences between patients with hypoglycemia, including patients
with minimum BG <70 mg/dL, 50–69 mg/dL, and <50 mg/dL, and those without
hypoglycemia for the entire cohort of 6,240 patients. Patients with hypoglycemia were older,
9
more likely to be admitted to the ICU with a nonsurgical diagnosis, and more likely to be
diabetic. They had higher APACHE II scores and higher mortality. Additional differences
included lower mean BG concentrations and higher CV.
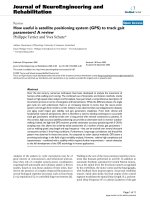
Figure 1 illustrates the negative correlation between minimum BG during ICU stay and ICU
LOS for the different cohorts (P for trend < 0.0001 for each of the cohorts).
Multivariate analysis of factors associated with ICU LOS
Table 2 demonstrates that hypoglycemia—minimum BG < 50 mg/dL as well as minimum BG
50–69 mg/dL—is independently associated with prolonged ICU LOS, defined as greater than
the 75
th
percentile for each cohort (3.1, 6.6, and 12.8 days, respectively, for ST, NL, and GL).
Association between ICU LOS and hypoglycemia, stratified by severity of illness
survivor status
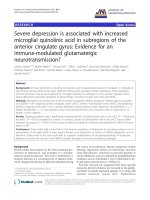
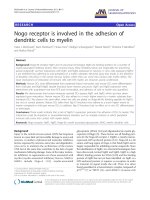
Figure 2 illustrates that the difference in ICU LOS comparing patients with hypoglycemia and
patients without hypoglycemia is found across different ranges of severity of illness, reflected
by admission APACHE II score. Figure 3 stratifies this relationship by survivor status.
Dose response relationship between hypoglycemia and ICU LOS
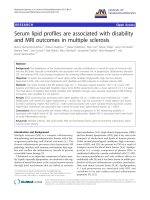
Figures 4a and 4b illustrate that most hypoglycemic events occurred soon after ICU
admission for patients in the ST and NL cohorts. Of the patients with hypoglycemia in the ST
cohort, 47% cohort had an episode within the first 48 hours of ICU admission; in the NL
cohort, 72% of the patients with hypoglycemia in the NL cohort had an episode within the
first 48 hours of ICU admission. Figure 5 displays the strong association between the number
of episodes of hypoglycemia and ICU LOS. For the entire cohort of 6,240 patients, ICU LOS
was 1.8 (1.0-3.3) days for those without hypoglycemia (n = 3,917) and 3.0 (1.5–6.7) days for
those with a single episode of hypoglycemia (n = 774; P < 0.0001).
Discussion
10
Although emerging literature has documented the strong association between hypoglycemia
during acute and critical illness and an increased risk of mortality [9, 11-18], this is the first
investigation that has focused explicitly on the association of hypoglycemia with ICU LOS,
the predominant driver of resource utilization in this population. The salient finding of this
investigation is that patients sustaining even a single episode of BG < 70 mg/dL during ICU
stay incurred substantially greater LOS than did those without an episode of hypoglycemia:
1.8 (1.0-3.3) vs. 3.0 (1.5-6.7) days (p < 0.0001). This observation was independent of survivor
status or severity of illness, as reflected by admission APACHE II score. The relationship
between ICU LOS and hypoglycemia was remarkably consistent in these three separate
cohorts of patients. Finally, there was a dose response relationship between hypoglycemia and
resource utilization: the number of discrete episodes of hypoglycemia was directly and
positively correlated with ICU LOS.
The major interventional trials of IIT [4-8, 10] as well as large observational cohort
studies [12, 13, 16, 17] describing the association of hypoglycemia with mortality do not
detail differences in ICU LOS comparing those who experienced hypoglycemia to those who
did not. However, the findings of the current investigation corroborate the limited data
available in the literature that do address this topic. Arabi et al. analyzed severe hypoglycemic
events (BG < 40 mg/dL) that occurred in their randomized, controlled trial of IIT [9]. ICU
LOS (median, IQR) was considerably longer in patients with hypoglycemia than in those
without: 5.8 (2.0-12.9) vs. 1.0 (0.8-1.9) (p value not supplied). Additionally, Vriesendorp and
colleagues performed an observational cohort study of patients sustaining severe
hypoglycemia (BG < 45 mg/dL) [15]. Index cases and controls were matched by the time of
the hypoglycemic event. The median (range) time in days from the index moment to death or
hospital discharge was longer in patients with hypoglycemia: 11 (0-204) vs. 8 (0-146; p value
not provided).
11
The multicenter, international nature of the investigation increases the generalizability
of the findings; the heterogeneous 6,240 patient cohort were admitted with varying severities
of illness and ICU LOS and treated in ICUs using different glycemic targets, measurement
technologies, and glycemic management protocols. One limitation is the absence of data
differentiating between spontaneous and therapy-induced hypoglycemia; it is unclear whether
these may have the same association with increased ICU LOS. The use of bedside
glucometers for measurement of capillary blood is an additional limitation of this
investigation, because this measurement technology has been associated with analytic
inaccuracies, especially in the hypoglycemic range [29-31]. Notably, the retrospective nature
of this investigation is an acknowledged weakness. This was unavoidable, because it would
be unethical to perform a randomized, controlled trial of induced hypoglycemia in a
population of critically ill patients. However, while the design of the study precludes proof of
causality, there are several lines of evidence that suggest strongly that hypoglycemia led to
increased resource utilization, rather than was a consequence of more frequent BG
measurements in patients who required longer ICU stays. Hypoglycemia occurred early in the
course of ICU stay; 47% and 72% of the patients with hypoglycemia in the ST and NL
cohorts, respectively, experienced an episode within the first 48 hours of ICU stay. Moreover,
the relationship between hypoglycemia and increased LOS was independent of severity of
illness; patients with hypoglycemia who had mild, moderate, or severe levels of illness,
reflected by APACHE II score sustained significantly longer LOS than did those without
hypoglycemia, and this relationship was seen for survivors as well as nonsurvivors.
There are some possible links between hypoglycemia and worsened outcome or complicated
course of critical illness [24, 32]. First, the physiological mechanisms triggered by
hypoglycemia are commonly impaired during critical illness. These include the inhibition of
insulin release, typically occurring when BG is <80 mg/dl, an increased release of glucagon,
12
epinephrine, and growth hormone when BG is <65 mg/dl, and increase release of cortisol
when BG is <55 mg/dl [33]. During critical illness, exogenous insulin is infused and the
levels of glucagon, epinephrine, cortisol, and growth hormone are typically already elevated.
Second, large swings in BG, as observed when hypoglycemia is aggressively treated with a
large amount of intravenous glucose, are typically associated with cellular damages [34].
Third, the detrimental effects of hypoglycemia are well documented in the brain. Indeed,
glucose is the preferential energetic substrate in the brain. The absence of cerebral stores of
glucose and the diffusive character of transport imply that the glucose concentration in
neurons and glial cells is entirely determined by BG [34].
The main driver of the cost of care of patients admitted to the ICU is length of stay
[33-35]. This investigation, demonstrating consistent evidence of increased ICU LOS among
critically ill patients sustaining hypoglycemia compared with those without hypoglycemia,
has important implications for the management of these patients. Although this study must be
considered hypothesis-generating, the evidence from this study and other recent investigations
strongly suggests that avoidance of hypoglycemia has a beneficial effect not only on survival,
but on cost, an important goal in the context of estimates that ICU care consumes 20–30% of
individual hospital’s resources and 0.5–1.0% of US Gross National Product [19, 20].
Conclusions
This multicenter investigation demonstrates a strong association between mild hypoglycemia
(BG < 70 mg/dL) and increased ICU LOS, independent of severity of illness and survivor
status. Successful avoidance of hypoglycemia has the potential to decrease significantly the
cost of care of the critically ill.
13
Abbreviations
APACHE II, Acute Physiology and Chronic Health Evaluation II; BG, blood glucose
concentration (mg/dL); CV, coefficient of variation; DM, diabetes mellitus; GL,
GLUCONTROL cohort; ICU, intensive care unit; LOS, length of stay; NL, Netherlands
cohort; SD, standard deviation; ST, Stamford cohort.
14
Competing interests
James S. Krinsley, MD, has performed consulting work for Medtronic Inc., Edwards Life
Sciences, Baxter, Roche Diagnostics, and Optiscan Biomedical and has received speaker’s
fees from Edwards Life Sciences, Roche Diagnostics and Sanofi-Aventis. Marcus J. Schultz,
MD, PhD, has performed consulting work for Medtronic Inc. and Optiscan Biomedical and
has received research support from Optiscan Biomedical. Peter E. Spronk, MD, PhD, FCCP,
Floris van Braam Houckgeest, MD, Johannes P. van der Sluijs, MD, PhD, and Christian
Mélot, MD, PhD, have no disclosures to report. Jean-Charles Preiser, MD, PhD, has
performed consulting work for Medtronic Inc., Edwards Life Sciences, and Optiscan
Biomedical.
Authors’ contributions
JK wrote the initial and subsequent drafts of the manuscript and performed statistical analysis.
MS reviewed all drafts of the manuscript and assisted with revisions. PS, FH, JS, and CM
helped with data collection and reviewed the drafts of the manuscript. JCP reviewed all drafts
of the manuscript and assisted with revisions. All authors read and approved the final
manuscript.
This investigation was not supported by any source of external funding.
15
Figure 1. Relationship between minimum BG during ICU stay and ICU LOS: 3 cohorts.
Figure 2. Relationship between hypoglycemia and ICU LOS, stratified by APACHE II
score.
Figure 3. Relationship between hypoglycemia and ICU LOS, stratified by survivor
status.
Figure 4. (a) Timing of hypoglycemic events: Stamford cohort. (b) Timing of
hypoglycemic events: Netherlands cohort.
Figure 5. Relationship between number of episodes of hypoglycemia and ICU LOS: 3
cohorts.
16
References
1. Dungan S, Braithwaite S, Preiser JC: Stress hyperglycemia. Lancet 2009, 373:1798-
1807.
2. Krinsley JS: Association between hyperglycemia and increased hospital mortality in a
heterogeneous population of critically ill patients. Mayo Clin Proc 2003, 78:1471-1478.
3. Falciglia M, Freyberg R, Almenoff PL, D’Allesio D, Rener M: Hyperglycemia–related
mortality in critically ill patients varies with admission diagnosis. Crit Care Med 2009,
37:3001-3009.
4. Van den Berghe G, Wouters P, Weekers F, Verwaest C, Bruyninckx F, Schetz M,
Vlasslaers D, Ferdinande P, Lauwers P, Bouillon R: Intensive insulin therapy in critically
ill patients. N Engl J Med 2001, 345:1359-1367.
5. Krinsley JS: The effect of an intensive glucose management protocol on the mortality
of critically ill adult patients. Mayo Clinic Proc 2004, 79:992-1000.
6. Van den Berghe G, Wilmer A, Hermans G, Meersseman W, Wouters PF, Milants I, Van
Wijngaerden E, Bobbaers H, Bouillon R: Intensive insulin therapy in the medical ICU. N
Engl J Med 2006, 354:449-461.
7. Brunkhorst FM, Engel C, Bloos F, Meier-Hellmann A, Ragaller M, Weiler N, Moerer O,
GruendLing M, Oppert M, Grond S, Olthoff D, Jaschinski U, John S, Rossaint R, Welte T,
Schaefer M, Kern P, Kuhnt E, Kiehntopf M, Hartog C, Natanson C, Loeffler M, Reinhart K:
Intensive insulin therapy and pentastarch resuscitation in severe sepsis. N Eng J Med
2008, 358:125-139.
8. Preiser, JC, Devos P, Ruiz-Santana S, Melot C, Annane D, Groeneveld J, Iapichino G,
Leverve X, Nitenberg G, Singer P, Wernerman J, Joannidis M, Stecher A, Chiolero R: A
prospective randomized multi-centre controlled trial on tight glucose control by
17
intensive insulin therapy in adult intensive care units: the GLUCONTROL study. Int
Care Med 2009, 35:1738-1748.
9. Arabi YM, Tamim HM, Rishu AH: Hypoglycemia with intensive insulin therapy in
critically ill patients: predisposing factors and association with mortality. Crit Care Med
2009, 37:2536-2544.
10. The NICE-SUGAR Study Investigators: Intensive versus conventional glucose control
in critically ill patients. N Engl J Med 2009, 360:1283-1297.
11. Marik PE, Preiser JC: Toward understanding tight glycemic control in the ICU: a
systemic review and metaanalysis. Chest 2010, 137:544-551.
12. Krinsley JS, Grover A: Severe hypoglycemia in critically ill patients: risk factors and
outcomes. Crit Care Med 2007, 35:2262-2267.
13. Bagshaw S, Egi M, George C, Bellomo R: Early blood glucose control and mortality in
critically ill patients in Australia. Crit Care Med 2009, 37:463-470.
14. Meyfroidt G, Keenan DM, Wang X, Wouters P, Veldhuis J, Van den Berghe G: Dynamic
characteristics of blood glucose time series during the course of critical illness: effects of
intensive insulin therapy and relative association with mortality. Crit Care Med 2010,
38:1021-1029.
15. Vriesendorp TM, DeVries H, van Santen S, et al: Evaluation of short-term
consequences of hypoglycemia in an intensive care unit. Crit Care Med 2006, 34:2714-
2718.
16. Hermanides J, Bosman J, Vriesendorp TM, Dotsch R, Rosendaal FR, Zandstra DF,
Hoekstra JB, DeVries JH: Hypoglycemia is associated with intensive care unit mortality.
Crit Care Med 2010, 38:1430-1434.
17. Egi, M, Bellomo R, Stachowski E, French C, Hart G, Taori G, Hegarty C, Bailey M:
Hypoglycemia and outcome in critical illness. Mayo Clinic Proc 2010, 85:217-224.
18
18. Krinsley JS, Schultz MJ, Spronk PE, van Braam Houckgeest F, van der Sluijs JP, Mélot
C, Preiser JC: Mild hypoglycemia is independently associated with increased mortality in
the critically ill: Crit Care 2011, 15:R173.
19. Halpern N, Pastores S, Greenstein R, et al: Critical care medicine in the United States
1985-2000: an analysis of bed numbers, use, and costs: Crit Care Med 2004, 32:1254-
1259.
20. Bloomfield L: The impact of economics on changing medical technology with
reference to critical care medicine in the United States. Anesth Analg 2003, 96:418-425.
21. Van den Berghe G, Wouters P, Kesteloot K, et al: Analysis of healthcare resource
utilization with intensive insulin therapy in critically ill patients. Crit Care Med 2006, 34:
612-616.
22. Krinsley JS, Jones R. Cost analysis of intensive glycemic control in critically ill adult
patients. Chest 2006, 129:644-650.
23. Furnary AP, Zerr KJ, Grunkemeier GL et al. Continuous intravenous insulin infusion
reduces the incidence of deep sternal wound infection in diabetic patients after cardiac
surgical procedures. Ann Thorac Surg 1999, 67: 352-360
21. Sadhu AR, Ang AC, Ingram-Drake LA, Martinez DS, Hsueh WA, Ettner SL: Economic
benefits of intensive insulin therapy in critically ill patients: Diab Care 2008, 31:1556-
1561.
22. Cryer PE: Hypoglycemia: functional brain failure, and brain death: J Clin Invest
2007, 117:868-870.
23. Krinsley JS: Glycemic control, diabetic status and mortality in a heterogeneous
population of critically ill patients before and during the era of tight glycemic control.
Semin Thorac Cardiovasc Surg 2006, 18:317-325.
19
24. Dellinger RP, Carlet JM, Masur H, Gerlach H, Calandra T, Cohen J, Gea-Benacloche J,
Keh D, Marshall J, Parker M: Surviving Sepsis Campaign guidelines for management of
severe sepsis and septic shock. Int Care Med 2004, 30:536-555.
25. Schultz MJ, Harmsen RE, Spronk PE: Strict or loose glycemic control in critically ill
patients - implementing best available evidence from randomized controlled trials. Crit
Care 2010, 14:223.
26. Arts D, de Keizer N, Scheffer GJ, de Jonge E: Quality of data collected for severity of
illness scores in the Dutch National Intensive Care Evaluation (NICE) registry. Int Care
Med 2002, 28:656-659.
27. Finkielman J, Oyen LJ, Afessa B: Agreement between bedside and plasma glucose
measurement in the ICU setting. Chest 2005, 127:1749–1751.
28. Desachy A, Vuagnat AC, Ghazali AD, Baudin OT, Longuet OH, Calvat SN, Gissot V:
Accuracy of bedside glucometry in critically ill patients: Influence of clinical
characteristics and perfusion index. Mayo Clin Proc. 2008, 83:400-405.
29. Kanji S, Buffie J, Hutton B, Bunting PS, Singh A, McDonald K, Fergusson D, McIntyre
LA, Hebert PC: Reliability of point-of-care testing for glucose measurement in critically
ill patients. Crit Care Med 2005, 33:2778-2785.
30. Lacherade JC, Jacqueminet S, Preiser JC: An overview of hypoglycemia in the critically
ill. J Diab Sci Tech 2009, 3:1242-1249.
31. Ceriello A: New insights on oxidative stress and diabetic complications may lead to a
“causal” antioxidant therapy. Diab Care 2003, 26:1589-1596.
32. Oddo M, Schmidt JM, Carrerra E, Badjatia N, Connolly E, Presciutti M, Ostapkovich N,
Levine J, Roux P, Mayer S: Impact of tight glycemic control on cerebral glucose
metabolism after severe brain injury: a microdialysis study. Crit Care Med 2008,
36:3233-3238.
20
33. Krinsley JS, Jones RL: Cost analysis of intensive glycemic control in critically ill adult
patients. Chest 2006, 129:644-650.
34. Van den Berge G, Wouters PJ, Kesteloot K, Hilleman DE: Analysis of health care
resource utilization with intensive insulin therapy in critically ill patients. Crit Care Med
2006, 34: 612-616.
35. Dasta JF, McLaghlin TP, Mod SH, Piech DT: Daily cost of an intensive care unit day:
The contribution of mechanical ventilation. Crit Care Med 2005, 33:1266-1271.
21
Table 1 Comparison of patients with hypoglycemia to those without hypoglycemia
Minimum BG <70
mg/dL
Minimum BG 50-69
mg/dL
Minimum BG <50
mg/dL
Minimum BG ≥70
mg/dL
Number 2,313 1,424 889 3,927
Age (yr) 70 (57-79) 70 (59-80) 69 (58-78) 66 (52-78)
DM (%)* 27.3 28.3 26.8 17.5
MED patient
(%)
56.2 56.0 56.6 54.7
ICU LOS 5 (2.2-10.5) 4.2 (2-9) 6 (2.8-12.2) 1.8 (1.0-3.3)
APACHE II 20.8 (8.4) 19.9 (8.1) 22.2 (8.8) 15.2 (8.1)
Mortality (%) 29.6 26.5 34.6 13.1
Glucose
control
BG per patient 45 (21-97) 36 (18-78) 65 (29-127) 11 (7-24)
BG per day 9.5 (7.2-11.9) 9.2 (6.6-11.2) 10.2 (8.1-12.5) 8 (5-10)
Mean (mg/dL) 118.3 (108.1-132.5) 120 (109.3-133.4) 116.5 (106.5-129.4) 128.1 (115.3-144.4)
CV (%) 31.6 (25.0-40.0) 29 (23.1-37.4) 35 (29-43.7) 19.2 (13.7-26.1)
*Includes only patients from ST and GL cohorts. Data displayed as percentage, median
(interquartile range), or mean (standard deviation). P values comparing patients without
hypoglycemia to those with minimum BG < 70 mg/dL < 0.0001, except for MED patient p =
0.2581. DM, diabetes mellitus; MED patient, medical diagnosis on admission to the ICU,
rather than surgical or trauma; BG, blood glucose; BG per patient, number of BG
measurements per patient; BG per day, number of BG measurements per day per patient;
22
Mean, individual patient’s mean BG during ICU stay; CV, individual patient’s mean
coefficient of variation during ICU stay.
23
Table 2 Multivariate analysis of factors independently associated with prolonged ICU LOS
OR (95% CI) P value
Mechanical ventilation 3.82 (3.20-4.51) <0.0001
Minimum BG <70 mg/dL 2.50 (2.12-2.95) <0.0001
Minimum BG 50-69 mg/dL 2.16 (1.81-2.59) <0.0001
Minimum BG <50 mg/dL 1.78 (1.39-2.29) <0.0001
Medical diagnosis on admission 1.59 (1.34-1.88) <0.0001
Modified APACHE II score 1.04 (1.03-1.06) <0.0001
Age 1.00 (0.99-1.01) 0.6002
The 5 parameters in these multivariate models were each significant at p < 0.10 on univariate
analysis. Diabetes was not significant on univariate analysis and is therefore not included in
the models. Prolonged ICU LOS is defined as greater than the 75
th
percentile for each cohort
(3.1, 6.6, and 12.8 days for ST, NL and GL respectively). OR per year for age and per point
for Modified APACHE II score.
Figure 1