Báo cáo hóa học: " FITC and Ru(phen)32+ co-doped silica particles as visualized ratiometric pH indicator" pdf
Bạn đang xem bản rút gọn của tài liệu. Xem và tải ngay bản đầy đủ của tài liệu tại đây (1.21 MB, 7 trang )
NANO EXPRESS Open Access
FITC and Ru(phen)
3
2+
co-doped silica particles as
visualized ratiometric pH indicator
Jianquan Xu
1
, Lei Sun
2
, Jun Li
1
, Jinglun Liang
1
, Huimao Zhang
3*
and Wensheng Yang
1*
Abstract
The performance of fluorescein isothiocyanate (FITC) and tris(1, 10-phenanathroline) ruthenium ion (Ru(phen)
3
2+
)
co-doped silica particles as pH indicator was evaluated. The emission intensity ratios of the pH sensitive dye (FITC)
and the reference dye (Ru(phen)
3
2+
) in the pa rticles were dependent on pH of the environment. The changes in
emission intensity ratios of the two dyes under different pH could be measured under single excitation
wavelength and readily visualized by naked eye under a 365-nm UV lamp. In particular, such FITC and Ru(phen)
3
2+
co-doped silica particles were identified to show high sensitivity to pH around the pKa of FITC (6.4), making them
be potential useful as visualized pH indicator for detection of intracellular pH micro-circumst ance.
Keywords: pH indicator, visualized, silica particles, ratiometric, fluorescein, ruthenium complex
Background
In recent years, ratiometric fluorescent pH indicators had
been developed for sensitive detection of pH of an ana-
lyte [1-6]. To fabricate a ratiometric pH indicator, usually
two dyes, one pH sensitive and one reference dyes, were
incorporated into a silica or polymer matrix. In thi s
approach, a core/shell architecture in which the reference
dye was mainly located in the core and the pH-sensitive
dye located primarily in the shell was preferred [2,7]. The
ratios in emission intensity of the two dyes were corre-
lated to pH of the analyte. Compared to pH indicator
containing only the pH-sensitive dye [8-13], such ratio-
metric pH indicator was more reliable si nce the ra tios in
emission intensity were less sensitive to the fluctuations
in excitation light source intensity and variations in other
experimental conditions except pH [3,4,14-16]. However,
most of the ratiometric pH indicators reported required
the measurements of the emission intensity of the two
dyes under two different excitation wavelengths, which
made the analysis process be complicated and difficult to
be visualized by naked eye [2,4,6,7,17].
In our previous work, we developed a kind of multicolor
silica particles co-doped by fluorescent (fluorescein
isothiocyanate - FITC) and phosphorescent (Ru(phen)
3
2+
)
dyes. The green FITC and red Ru(phen)
3
2+
dyes could be
synchronouslyexcitedbyasingleexcitationwavelength
since there was large overlapping region in their absorp-
tion spectra. Color of the dye-doped silica particles was
tunable by simply the ratios of the two dyes, which was
readily visualized under a 365-nm UV lamp by naked eye
[18]. In this work, we explored the feasibility of such FITC
and Ru(phen)
3
2+
co-doped silica particles as visualized pH
indicator, in which the green FITC was used as the pH
sensitivedyeandtheredRu(phen)
3
2+
was employed a s
reference dye. It is expected that the particles may present
different colors under different pH since the emission
intensity of FITC was sensitive to pH. Experimental results
revealed that the particles showed visualized color changes
from red to yell owish-green distinguishable under a 365-
nm UV lamp when pH of the buffer solutions increased
from 2 to 8. Specially, such ratiometric pH i ndicator was
very sensitive to pH around the pKa of FITC (6.4), making
it potential useful for detection of intracellular pH micro-
circumstance.
Experimental section
Materials
FITC, 3-ami nopropyltriethoxysilane (APS ), and dichloro
tris (1,10-phenanathroline) ruthenium (II) hydrate (Ru
(phen)
3
2+
) were purchased from Aldrich Chemical Co.
(Milwaukee, WI, USA). Tetraethoxysilane (TEOS,
* Correspondence: ;
1
State Key Laboratory of Supramolecular Structure and Materials, College of
Chemistry, Jilin University, Changchun 130012, People’s Republic of China
3
China-Japan Union Hospital, Jilin University, Changchun 130033, People’s
Republic of China
Full list of author information is available at the end of the article
Xu et al. Nanoscale Research Letters 2011, 6:561
/>© 2011 Xu et al; licensee Springer. This is an Open Access article distributed under the terms of the Creative Commons Attribution
License ( enses/by/2.0), which permits unrestricted use, distribution, and reproduction in any medium,
provided the original work is properly cited.
Tiantai Chemical Int., Tianjin, China) was distilled
under reduced pressure before use. Analytical grade
ethanol, ammonia hydroxide (25%), NaOH (98%),
H
3
PO
4
(85%), H
3
BO
3
(99%), and CH
3
COOH (36%) were
purchased from Beijing Chemical Int. (Beijing, China)
and used without further purification. Dulbecco ’ s Modi-
fied Eagle Medium (DMEM), fetal bovine serum (FBS),
and phosphate-buffered saline (PBS) were purchased
from Invitrogen Gibco Corp. (Carlsbad, CA, USA). The
human hepatoma cell line SMMC-7721 was purchased
from Cell Resource Center of Shanghai Institutes for
Biological Sciences (Shanghai, China). Britton-Robinson
buffer solutions (denoted as BR buffer solution here-
after) in the pH range of 2.0-10 were prepared from a
solution containing H
3
BO
3
,H
3
PO
4
,andCH
3
COOH
with the same concentration of 0.04 mol L
-1
,andthe
desired pH value were acquired by adding different
volume of 0.2 mol L
-1
of NaOH. High-purity water with
a resistivity of 18.2 MΩ cm (Pall Purelab Plus) was used
in all experiments.
Synthesis of Ru(phen)
3
2+
-doped silica particles
Ru(phen)
3
2+
-doped silica particles were prepared by a
modified Stöber method. In a typical reaction, 3 mL
TEOS was added to ethanol solution (60 mL) containing
ammonia (2.4 mL), Ru(phen)
3
2+
(0.6 mg, dissolved in 1
mL ethanol), and water (1.2 mL). The reaction mixture
was kept at 40°C for 6 h, then another 0.8 ml TEOS was
added for the growth of an additional silica layer, and
then the reaction was continued for another 6 h. The
reaction solution was centrifuged at 10,000 rpm for 15
min to collect the silica particles. The particles were
further washed with ethanol for three times to remove
the unreacted chemicals and then dispersed in 60 mL
ethanol.
Synthesis of FITC and Ru(phen)
3
2+
co-doped silica
particles
Ammonia (2.4 mL) and water (1.2 mL) were added
into the ethanol dispersion of the Ru(phen)
3
2+
-doped
silica particles (60 mL) and then 80 μLAPSwasadded
into the mixture. After being kept at 40°C unde r mag-
netic stirring for 8 h, the reaction solution was centri-
fuged at 10,000 rpm for 15 min to collect the
aminated silica particles. After being washed three
times with ethanol to remove the unreacted chemicals,
the particles were dispersed to 60 mL ethanol and
then 1 mg FITC dissolved in 1 mL ethanol was added.
The mixture was allowed to stand at 40°C under mag-
netic stirring for 12 h. After the reaction, the particles
were centrifuged at 10,000 rpm f or 15 min to remove
the unreacted dyes. The particles were washed by
water until no fluorescence was detectable in the
supernatant.
Cell handing process
SMMC-7721 cells were cultured in DMEM containing
10% FBS (fetal bovine serum) with 100 U/ml penicillin
and 100 μg/ml streptomycin and incubated at 37°C
under a humidified atmosphere containing 5% CO
2
. The
cells were seeded in culture plates at a density of 1 ×
10
5
cell/mL. After 24-h culturing, the cells were treated
with the as-prepared silica particles which dispersed in
serum-free DMEM at a concentrati on of 100 μg/mL for
4 h. After treatment, the cells wer e isolated by trypsin
and washed with PBS for three times, and then the cells
after endocytosis of the silica particles were observed by
a fluorescence microscopy.
Characterizations
Transmission electron microscopic (TEM) observations
were carried out on a JEOL- 2010 electron microscope
(JEOL, Tokyo, Japan) operating at 200 kV for determin-
ing the sizes of silica particles. The samples were pre-
pared by depositing a drop of the dispersion of the
particles onto carbon grids (200 mesh) and allowing
evaporation of the solvent in air at room temperature.
Emission spectra were measuredonanEdinburgh
FS900 steady-state fluorescence spectrometer (Edin-
burgh Instruments Ltd., Livingston, UK) with a 450-W
xenon lamp as excitation source. Absorption spectra
were collected with a Varian Cary-100 scan UV-vis
spectrophotometer. Fluorescence images were taken
under a 400 times OLYMPUS IX71 fluorescence micro-
scope excited at 450 nm.
Results and discussion
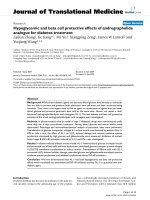
Figure 1A illustrates the procedures for preparation of
the FITC and Ru(phen)
3
2+
co-doped silica particles.
First, the reference dye, Ru(phen)
3
2+
, was incorporated
into the silica particles by electrostatic adsorption via
the modified Stöber method [19-21]. Average diameter
of the silica particles was determined to be 52 nm as
indicated by TEM observations (Figure 2B). After the
centrifugation treatment, no emission of the dye was
detectable in the supernatant, indicating complete incor-
poration of the reference dye added into the silica parti-
cles. After the growth of a silica shell, surface of the Ru
(phen)
3
2+
silica particles was functionalized by amino
groups. FITC was grafted onto surface of the aminated
particles by formation of covalent bond between the
amino groups on the particle surface and isothiocyanate
group of FITC. The ratio of FITC and Ru(phen)
3
2+
in
the particles could not be determined directly from the
absorption spectrum of the co-doped silica particles
since there was large overlap between their absorption
features (see Figure S1 of Additional file 1). Pure silica
particles (52 nm) without Ru(phen)
3
2+
were adopted to
evaluate the labeling efficiency of FITC. After graft of
Xu et al. Nanoscale Research Letters 2011, 6:561
/>Page 2 of 7
FITC onto the pure silica particles, the particles were
centrifuged and washed with water until the supernatant
was clear. Then the particles were dissolved in 0.5 M
NaOH solutions to liberate the dye molecules [22]. The
labeling efficiency of FITC was estimated to be about
47% from the absorption spectra (see Figure S2 of Addi-
tional file 1). So the actual molar ratio of Ru(phen)
3
2+
and FITC in the silica particles was about 2:3. In such
co-doped silica particles, the reference dye molecules
were mainly located in the core part of the particles to
prevent their direct contact with the solvent environ-
ment. On the contrary, the pH sensitive dye molecules
were primarily located on the surface of the particle to
maximize their contact with th e analyte. The as-pre-
pared FITC and Ru(phen)
3
2+
co-doped silica particles
were well dispersed in aqueous solution. Average dia-
meter of t he co-doped particles was determined to be
60 nm as observed by TEM (Figure 1C). It was deduced
that the shell thickness was about 4 nm since the
fictionalization of A PS and FITC had little effect on the
particle size.
Figure 2A shows the emission spectra of the co-doped
silica particles dispersed in BR buffer solutions with dif-
ferent pH. The excitation wavelength was set at 450 nm
under which both FITC and Ru(phen)
3
2+
present rea-
sonable extinction coefficients higher than 10
4
M
-1
cm
-1
(see Figure S3 of Additional file 1) [23,24]. At pH = 2,
the emission of FITC around 520 nm was quenched
greatly. With the increased pH, the emission intensity of
FITC increased gradually and then kept almost
unchanged at pH ≥8, which was consistent with the
behaviors of free FITC i n aqueous solutions (see Figure
S4 of Additional file 1). At the same time, the emission
intensity of the reference dye located in the core part of
the particles kept almost constant under the different
pH. After being dispersed in BR buffers with pH of 2 to
8, the particles showed tunable emission color from red
to yellowish-green which could be readily distinguished
Figure 1 Preparation of FITC and Ru(phen)
3
2+
co-doped silica particles and TEM images of the Ru(phen)
3
2+
-doped particles. (A)
Procedures for preparation of the FITC (green) and Ru(phen)
3
2+
(red) co-doped silica particles. TEM images of the Ru(phen)
3
2+
-doped particles
(B) before and (C) after the shell growth and graft of FITC.
Xu et al. Nanoscale Research Letters 2011, 6:561
/>Page 3 of 7
by naked eye under a 365-nm UV lamp (see insert of
Figure 2). It is known that FITC may exist in dianionic,
monoanionic, cationic, or neutral form dependent on
pH of the solution (see Figure 2B). The monoanionic
and neutral forms could be transfo rmed into the non-
luminous ester-type structure [25,26]. The pH-sensitive
emission of the co-doped silica particles was primarily
related to the equilibrium of FITC between the low
quantum yield monoanionic form ( = 0.36) and high
quantum yield dianionic one ( =0.93).WhenpHof
the solution was lowered, the emission intensity of FITC
decreased greatly mainly attributed to formation of the
non-luminous ester-type structure since there was no
great difference in molar extinction coefficients of the
momoanionic and dianionic forms (see Figure S4 of
Additional file 1). Therefore, the particles showed a yel-
lowish-green color at high pH and red color at low pH
since the emission intensity of the red reference dye was
almost insensitive to the changes in pH of the buffers.
The variations in emission properties of the c o-doped
silica particles with pH could be further understood by
the ratiometric calibration curve. Figure 3 shows the
ratios in emission intensity (I
520/
/I
585
) of FITC (520 nm)
and Ru(phen)
3
2+
(585 nm) in the co-doped silica parti-
cles dispersed in BR buffers with different pH value.
Emission intensity of both the two dyes was obtained
from the same spectrum, which made the detection pro-
cess become more convenient. The calibration curve fol-
lowed the typical behavior of a system in equilibrium
between the mono- and dianionic states of FITC. It is
noted that the ratio increased rapidly in the range of pH
from pH 5 to 8, attributed to the smart change in ratio
of the mono- and dianionic forms of FITC around its
pKa (6.4) [27].
Reversibility of the pH indicator was evaluated by
monitoring the changes of the ratios in emission inten-
sity of the two dyes (Figure 4). The c o-doped silica par-
ticles were disperse d alternatively in BR buffers with pH
4 and 8. The r atio could be completely recovered when
the particles were transferred between the BR buffers
with pH 4 and 8. In addition, no leakage of the dyes
from the particles was detectable even after 4 cycles.
These results indicated that such c o-doped silica parti-
cles are a kind of reversible and robust ratiometric pH
indicator. It should be mentioned that the response of
such ratiom etric pH indicator was very fast (a coupl e of
seconds), which may benefited from the efficient contact
of the pH sensitive dye located on the particle surface
with the analyte.
As mentioned above, th e co-doped silica particles pre-
sented more sensitive response to pH around the pKa of
FITC (6.4), meaning such pH indicator is suitable for
detection of physiological pH. The nanoparticles were
used to detect the intracellular pH micro-environment
of SMMC-7721 hepatoma cells. TEM observations
showed that the particl es could be endocytosed and dis-
tributed in different compartments of the cells (see Fig-
ure S5 of Additional file 1). Figure 5 gives the image of
Figure 2 Emission spectra of the co-doped silica particles and molecular structures of FI TC under different pH. (A) Em ission spectra of
the co-doped silica particles dispersed in BR buffers with pH of 2.1, 3.3, 4.1, 4.9, 5.8, 6.8, 7.8, 8.9, and 9.9. The excitation wavelength was at 450
nm. Insert gives the photos of the particles dispersed in BR buffers with different pH under a 365 nm UV lamp. (B) Molecular structures of FITC
under different pH.
Xu et al. Nanoscale Research Letters 2011, 6:561
/>Page 4 of 7
Figure 3 Ratiometric calibration curve of the co-doped silic a particles. Based on the ratios of the emission intensity (I
520
/I
585
)ofFITCand
Ru(phen)
3
2+
under different pH.
Figure 4 Variations in the emission intensity ratios (I
520
/I
585
) of the co-doped silica particles. Recoded at the start pH (pH = 4) and end
pH (pH = 8) of different cycles. The excitation wavelength was at 450 nm.
Xu et al. Nanoscale Research Letters 2011, 6:561
/>Page 5 of 7
the cells after endocytosis of the particles observed by a
fluorescence microscopy. The particles showed distin-
guishable color even in one cell, corresponding to the
different pH circumstance of the intracellular compart-
ments. It was likely that the yellow color came from the
particles internalized by lysosome, a kind of organelle
with pH around 5, while the green color was contribu-
ted by the particles located in the cytoplasm and other
organelles with neutral pH.
Conclusion
In summary, visualized ratiometric pH indicator was
fabricated by using a fluorescent dye (FITC) and a phos-
phorescent dye (Ru(phen)
3
2+
). The two dyes were intro -
duc ed into silica particles in a core/ shell architecture to
maximize the contact of the pH sensitive dye FITC with
analyte while protecting the reference dye Ru(phen)
3
2+
from the environment. Such ratiometric pH indicator
could be excited simultaneo usly by using single wave-
length due to the large overlapping in absorption fea-
tures of the two dyes. The co-doped silica particles were
sensitive to pH in the range of 2 to 8 distinguishable
either by the emission spectra or in color observable by
naked eye. The pH indicator showed good sensitivity
around physiological pH, making it potential useful as a
simple visualization pH indicator from detection of
intracellular micro-environment.
Additional material
Additional file 1: Supplementary dataSupplementary data. FITC and
Ru(phen)
3
2+
co-doped silica particles as visualized ratio-metric pH
indicator. Figures S1 to S5. Supplementary data(1364224948562217).doc,
1110K. />supp1.docSupplementary data files
Abbreviations
FITC: fluorescein isothiocyanate; Ru(phen)
3
2+
: tris(1, 10-phenanathroline)
ruthenium ion; APS: 3-aminopropyltriethoxysilane; TEOS: tetraethoxysilane;
DMEM: Dulbecco’s Modified Eagle Medium; FBS: fetal bovine serum; PBS:
phosphate-buffered saline; TEM: transmission electron microscopic.
Acknowledgements
This work was supported by the National Basic Research Program of China
(no. 2009CB939701, no. 2011CB935800), the National Nature Science
Foundation of China (50825202), and Graduate Innovation Fund of Jilin
University (10201044)
Author details
1
State Key Laboratory of Supramolecular Structure and Materials, College of
Chemistry, Jilin University, Changchun 130012, People’s Republic of China
2
College of Public Health, Jilin University, Changchun, Jilin, 130021, People’s
Republic of China
3
China-Japan Union Hospital, Jilin University, Changchun
130033, People’s Republic of China
Authors’ contributions
The work presented here was carried out in collaboration between all
authors. JX carried out the laboratory experiments, interpreted the results,
and drafted the paper. LS performed the cell experiments. JL, JlL, HM, and
WY co-designed the experiments, discussed the experimental results, and
revised the paper. All authors have contributed to, seen, read, and approved
the manuscript.
Competing interests
The authors declare that they have no competing interests.
Received: 14 June 2011 Accepted: 25 October 2011
Published: 25 October 2011
References
1. Wang Z, Zheng G, Lu P: 9-(Cycloheptatrienylidene)-fluorene derivative:
remarkable ratiometric pH sensor and computing switch with NOR logic
gate. Org Lett 2005, 7:3669.
2. Burns A, Sengupta P, Zedayko T, Baird B, Wiesner U: Core/shell fluorescent
silica nanoparticles for chemical sensing: towards single-particle
laboratories. Small 2006, 2:723.
3. Snee PT, Somers RC, Nair G, Zimmer JP, Bawendi MG, Nocera DG: A
ratiometric CdSe/ZnS nanocrystal pH sensor. J Am Chem Soc 2006,
128:13320.
4. Doussineau T, Smaïhi M, Mohr GJ: Two-dye core/shell zeolite
nanoparticles: a new tool for ratiometric pH measurements. Adv Funct
Mater 2009, 19:117.
5. Jin T, Sasaki A, Kinjo M, Miyazaki J: A quantum dot-based ratiometric pH
sensor. Chem Commun 2010, 46:2408.
6. Schulz A, Wotschadlo J, Heinze T, Mohr GJ: Fluorescent nanoparticles for
ratiometric pH-monitoring in the neutral range. J Mater Chem 2010,
20:1475.
7. Allard E, Larpent C: Core-shell type dually fluorescent polymer
nanoparticles for ratiometric pH-sensing. J Polym Sci - Polym Chem 2008,
46:6206.
8. Murtaza Z, Chang Q, Rao G, Lin H, Lakowicz JR: Long-lifetime metal-ligand
pH probe. Anal Biochem 1997, 247:216.
9. Lin HJ, Szmacinski H, Lakowicz JR: Lifetime-based pH sensors: indicators
for acidic environments. Anal Biochem 1999, 269:162.
Figure 5 Fluorescence image of the SMMC-7721 hepatoma
cells after endocytosis of the co-doped silica particles. The
excitation wavelength was at 450 nm and the magnification was
400.
Xu et al. Nanoscale Research Letters 2011, 6:561
/>Page 6 of 7
10. Cui D, Qian X, Liu F, Zhang R: Novel fluorescent pH sensors based on
intramolecular hydrogen bonding ability of naphthalimide. Org Lett 2004,
6:2757.
11. Hong SW, Kim KH, Huh J, Ahn CH, Jo WH: Design and synthesis of a new
pH sensitive polymeric sensor using fluorescence resonance energy
transfer. Chem Mater 2005, 17:6213.
12. Price JM, Xu W, Demas JN, DeGraff BA: Polymer-supported ph sensors
based on hydrophobically bound luminescent ruthenium(II) complexes.
Anal Chem 1998, 70:265.
13. Yao S, Schafer-Hales KJ, Belfield KD: A new water-soluble near-neutral
ratiometric fluorescent pH indicator. Org Lett 2007, 9:5645.
14. Peng J, He X, Wang K, Tan W, Wang Y, Liu Y: Noninvasive monitoring of
intracellular pH change induced by drug stimulation using silica
nanoparticle sensors. Anal Bioanal Chem 2007, 388:645.
15. Burns A, Ow H, Wiesner U: Fluorescent core-shell silica nanoparticles:
towards “Lab on a Particle” architectures for nanobiotechnology. Chem
Soc Rev 2006, 35:1028.
16. Ji J, Rosenzweig N, Griffin C, Rosenzweig Z: Synthesis and application of
submicrometer fluorescence sensing particles for lysosomal pH
measurements in murine macrophages. Anal Chem 2000, 72:3497.
17. Hornig S, Biskup C, Grafe A, Wotschadlo J, Liebert T, Mohr GJ, Heinze T:
Biocompatible fluorescent nanoparticles for pH-sensoring. Soft Matter
2008, 4:1169.
18. Xu J, Liang J, Li J, Yang W: Multicolor dye-doped silica nanoparticles
independent of FRET. Langmuir 2010, 26:15722.
19. Stöber W, FiInk A: Controlled growth of monodisperse silica spheres in
the micron size range. J Colloid Interface Sci 1968, 26:62.
20. Van Blaaderen A, Imhof A, Hage W, Vrij A: Three-dimensional imaging of
submicrometer colloidal particles in concentrated suspensions using
confocal scanning laser microscopy. Langmuir 1992, 8:1514.
21. Zhang D, Wu Z, Xu J, Liang J, Li J, Yang W: Tuning the emission
properties of Ru(phen)
3
2+
doped silica nanoparticles by changing the
addition time of the dye during the Stöber process. Langmuir 2010,
26:6657.
22. Imhof A, Megens M, Engelberts JJ, de Lang DTN, Sprik R, Vos WL:
Spectroscopy of fluorescein (FITC) dyed colloidal silica spheres. J Phys
Chem B 1999, 103:1408.
23. DeRose PC, Kramer GW: Bias in the absorption coefficient determination
of a fluorescent dye, standard reference material 1932 fluorescein
solution. J Lumin 2005, 113:314.
24. Kalyanasundaram K: Photochemistry of Polypyridine and Porphyrin Complexes
London: Academic Press; 1992.
25. Bryleva EY, Vodolazkaya NA, McHedlov-Petrossyan NO, Samokhina LV,
Matveevskaya NA, Tolmachev AV: Interfacial properties of
cetyltrimethylammonium-coated SiO
2
nanoparticles in aqueous media
as studied by using different indicator dyes. J Colloid Interface Sci 2007,
316:712.
26. McHedlov-Petrossyan NO, Kleshchevnikova VN: Influence of the
cetyltrimethylammonium chloride micellar pseudophase on the
protolytic equilibria of oxyxanthene dyes at high bulk phase ionic
strength. J Chem Soc Faraday Trans 1994, 90:629.
27. Haugland RP: The handbook-a guide to fluorescent probes and labeling
technologies. 10 edition. Eugene: Molecular Probes; 2005.
doi:10.1186/1556-276X-6-561
Cite this article as: Xu et al.: FITC and Ru(phen)
3
2+
co-doped silica
particles as visualized ratiometric pH indicator. Nanoscale Research Letters
2011 6:561.
Submit your manuscript to a
journal and benefi t from:
7 Convenient online submission
7 Rigorous peer review
7 Immediate publication on acceptance
7 Open access: articles freely available online
7 High visibility within the fi eld
7 Retaining the copyright to your article
Submit your next manuscript at 7 springeropen.com
Xu et al. Nanoscale Research Letters 2011, 6:561
/>Page 7 of 7