Báo cáo hóa học: " Graphitic carbon growth on crystalline and amorphous oxide substrates using molecular beam epitaxy" pot
Bạn đang xem bản rút gọn của tài liệu. Xem và tải ngay bản đầy đủ của tài liệu tại đây (682.5 KB, 6 trang )
NANO EXPRESS Open Access
Graphitic carbon growth on crystalline and
amorphous oxide substrates using molecular
beam epitaxy
Sahng-Kyoon Jerng
1
, Dong Seong Yu
1
, Jae Hong Lee
1
, Christine Kim
2
, Seokhyun Yoon
2
and Seung-Hyun Chun
1*
Abstract
We report graphitic carbon growth on crystalline and amorphous oxide substrates by using carbon molecular
beam epitaxy. The films are characterized by Raman spectroscopy and X-ray photoelectron spectroscopy. The
formations of nanocrystalline graphite are observed on silicon dioxide and glass, while mainly sp
2
amorphous
carbons are formed on strontium titanate and yttria-stabilized zirconia. Interestingly, flat carbon layers with high
degree of graphitization are formed even on amorphous oxides. Our results provide a progress toward direct
graphene growth on oxide materials.
PACS: 81.05.uf; 81.15.Hi; 78.30.Ly.
Keywords: graphite, molecular beam epitaxy, Raman, oxide
Introduction
Graphene growth on Ni or Cu by chemical vapor
deposition [CVD] is now well established. However, the
CVD graphene needs to be transferred onto insulating
substrates for application, which may degrade the qual-
ity and bring complications to the manufacturing pro-
cess. This is why direct graphene growth on insulator is
still intensively being studied. Notably, the growt h on
oxide is of great interest beca use graphene is expected
to face current metal-oxide semiconductor [MOS] tech-
nology through an oxide layer. Recent studies have
shown some accomplishments toward this goal by using
CVD [1-3].
Here, we attempt molecular beam epitaxy [MBE] of
carbon onto several oxide substrates to figure out the
potential of graphene growth. So far, carbon MBE has
been applied mostly on group IV semiconductors [4-7],
where graphitic carbon growth was observed. We have
shown previously that nanocrystalline graphite [NCG]
canbeformedonsapphire(Al
2
O
3
)andobserveda
Dirac-like peak for the first time in MBE-grown NCGs
[8]. In this study, we expand the subject to include
various crystalline and amorphous oxides. We observe
that graphitic carbon or NCG can be grown by carbon
MBE on amorphous SiO
2
, the most important oxide in
the MOS technology. We also o btain similar results on
glass (Eagle 2000™, Corning Inc., Corning, NY, USA).
In contrast, carbons on amorphous TiO
2
or Ta
2
O
5
do
not seem to form graphitic structures. Among the crys-
talline oxides, mainly sp
2
amorphous carbons are
observed on SrTiO
3
(100) and yttria-stabilized zirconia
[YSZ] (100).
Methods
Materials and film fabrication
Samples were fabricated in a home-made ultra-high-
vacuum MBE system. Carbons were sublimated from a
heated pyrolytic graphite filament. The pressure of the
chamber was kept below 1.0 × 10
− 7
Torr during the
growth with the help of liquid nitrogen flowing in the
shroud. Details about the growth procedure can be
found elsewhere [8]. Both crystalline and amorphous
oxide substrates were purchased from commercial ven-
dors (AMS Korea, Inc., Sungnam, Gyeonggi-do, South
Korea; INOSTEK Inc., Ansan-si, Gyeonggi-do, South
Korea). The growth temperature ( T
G
) was in the range
of 900°C to approximately 1,0 00°C, based on our pre-
vious study with sapphire. The typical thickness of
* Correspondence:
1
Department of Physics and Graphene Research Institute, Sejong University,
Seoul 143-747, South Korea
Full list of author information is available at the end of the article
Jerng et al. Nanoscale Research Letters 2011, 6:565
/>© 2011 Jerng et al; licensee Springer. This is an Open Access artic le distribute d under the terms of the Creative Commons Attribution
License ( nses/by/2.0), which permits unrestricted use, distrib ution, and re production in any medium,
provided the original work is properly cited.
carbon film, determined by mea suring the step height
after lithography, was 3 to approximately 5 nm.
Characterization
Raman-scattering measurements were performed by
using a M cPherson model 207 monochromator with a
488-nm (2.54 e V) laser excitation source. The s pectra
recorded with a nitrogen-cooled charge-coupled device
array detector. X-ray photoelectron spectroscopy [XPS]
measure ments to analyze carbon bonding characteristics
were done by using a Kratos X-ray photoelectron spec-
trometer with Mg Ka X-ray source. C1s spectra were
acquired at 150 W X-ray power with a pass energy of
20 eV and a resolution step of 0.1 eV. Atomic force
microscopy [AFM] images were taken by a c ommercial
system (Nan oFocus Inc., Seoul, South Korea) in a non-
contact mode.
Results and discussion
Raman-scattering measurements have become a power-
ful, non-destructive tool in the study of sp
2
carbons
(carbon nanotube, graphene, and graphite). The well-
known G peak is observed in all sp
2
systems near 1,600
cm
-1
. With the advent of graphene, the so-called 2D
peak, which occurs near 2,700 cm
-1
, has become impor-
tant. Single-layer graphene is characterized by the sharp
and large 2D peak. This 2D peak is actually the second
order of D peak. The typical position of D peak is 1,350
cm
−1
,onehalfofthe2D peak position. The D peak is
absent in a perfect graphene sheet or gra phite because
of symmetry and increases as de fects or disorders in the
honeycomb structure increases. However, it should be
noted that the D peak also disappears in amorphous
carbon. That is, Raman D peak does indicate the pre-
sence of sixfold aromatic rings as well as sp
2
bonds. It is
from A
1g
symmetry phonons in which t he D peak
becomes Raman active by structural disorders in the
graphene structure.
Ferrari and Robertson studied the degree of sp
2
bond-
ing and the relative strength of D and G peaks thor-
oughly [9-11], and recent experiments confirmed their
theory [12,13]. Here, we follow their arguments and
evaluate the degree of crystallinity based on the sharp-
ness and the intensity of D, G,and2D peak s. Let us
start with carbon deposited on crystalline oxide sub-
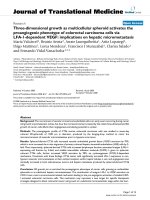
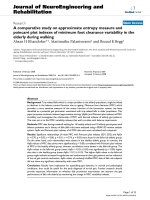
strates. Fi gure 1 shows the Raman spectra from the ca r-
bon films grown on SrTiO
3
(100) and YSZ(100). The
well-developed D and G peaks with similar intensities
indicate that the film consists of sp
2
carbons with a
number of defects. However, the 2D peak is hardly seen
although a small bump is observed at the expected posi-
tion in Figure 1a. According to recent criteria, the
absence of a clea r 2D peak implies the transition from
NCG to mainly sp
2
amorphous carbon [11]. Based on
the intensity ratio, I
D
/I
G
~ 1 (Table 1), we can conclude
that the carbon films on SrTiO
3
(100) and YSZ(100) are
in the middle of ‘ stage 2’ as defined by Ferrari and
Robertson [9].
The crystalline ordering is worse than that of graphitic
carbon grown at the same T
G
onasapphirecrystal,
where a 2D peak is easily identif ied [8]. In the previous
study, we observed that the crystal orientations of sap-
phire substrates did not affect the quality of NCG
grown on them and speculated that the lattice constants
and the substrate symmetry were not critical parameters
in the NCG growth by MBE [8]. Then, we expect simi-
lar growth on cubic SrTiO
3
and YSZ, contrary t o what
weobserve.Onepossibleexplanationisthattheopti-
mum T
G
depends on the material. In fact, t he Raman
spectra in Figure 1 are similar to those of NCG on sap-
phire grown at 600°C, far lower than the optimum T
G
of 1,100°C [8]. Because of the difference in the sticking
coefficient of carbon to the substrate and/or the diffu-
sion constant of carbon on the surface, the optimum
growth temperature may depend on the substrate.
Further experiments of carbon growth on SrTiO
3
or
YSZ at different temperatures might prove this
assumption.
Figure 1 Raman spectra of carbon films.Thefilmsweregrown
(a) at 1,000°C on SrTiO
3
(100) and (b) at 900°C on YSZ(100). The D
and the G peaks are identified.
Jerng et al. Nanoscale Research Letters 2011, 6:565
/>Page 2 of 6
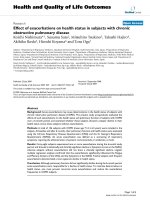
Now, we turn to amorp hous oxides, which a re more
relevant to the MOS technology. First, we tested 100-
nm-thick TiO
2
and Ta
2
O
5
grownonSiO
2
(300 nm)/Si
by sputtering. As shown in Figure 2, no sign of graphitic
carbon is observed. The only peak near 1,000 cm
−1
is
the background Raman signal from Si wafer. Usually,
this background is removed to highlight the carbon-
related peaks, but we leave that in Figure 2 to show the
absence of other peaks.
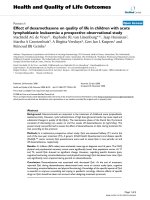
The situation changes drastically as the substrate is
changed to SiO
2
(300nm)onSiwafer.Figure3ashows
tha t graphitic carbon of a relatively high degree of crys-
tallinity is formed on SiO
2
. The Raman spectra are simi-
lar to the best data from NCG on sapphire [8]: the
sharp and large D peak and the clear 2D peak. Notably,
the existence of 2D peak is an important evidence of
successful NCG growth on amorphous SiO
2
[11]. This
shows that the crystallinity of the substrate is not
essential and explains why the quality of NCG was inde-
pendent of substrate orientation in the previous study
[8]. This surprising result may find int eresting applica-
tions because we also expect a Dirac-like conduction in
NCG [8]. Further optimization along with transport
measurement is under progress. Similar results are
obtained from Eagle 2000™ glass,awidelyusedmate-
rial in act ive matrix liquid crystal displays (Figure 3b).
ThisglassisknowntoconsistofSiO
2
,B
2
O
3
,Al
2
O
3
,
CaO, and Na
2
O. It mea ns that SiO
2
is not the only
amorphous oxide on which graphitic carbon can be fab-
ricated. Considering the vari ety of oxides, the quality of
graphitic carbon can be improv ed much as the search
for suitable substrates is continued.
Now that the carbon films grown on SiO
2
and glass
by MBE are identified as NCGs, it is informative to cal-
culate the crystallite size from Ferrari and Robertson’s
model applied to stage 2 [9]. According to the model,
Table 1 Fitting results of the Raman spectra for various samples
Substrate Peak (D) (cm
−1
) Peak (G) (cm
−1
) I
D
/I
G
I
2D
/I
G
FWHM (G) (cm
−1
) FWHM (2D) (cm
−1
)
SrTiO
3
1,372 1,603 0.8 - 70 -
YSZ 1,364 1,609 1.1 - 63 -
SiO
2
1,352 1,598 1.9 0.4 66 96
Glass 1,352 1,598 1.8 0.3 66 99
Mixed Gaussian and Lorentzian functions are used to fit D, G,and2D peaks. FWHM, full width at half maximum.
Figure 2 Raman spectra of carbon films. The film s were grown (a) at 900°C on amorphous TiO
2
and (b) a t 900 °C on amorphous Ta
2
O
5
.No
carbon-related peaks are observed. The peak near 1,000 cm
−1
is from Si substrate.
Jerng et al. Nanoscale Research Letters 2011, 6:565
/>Page 3 of 6
the average size L
a
is related to I
D
/I
G
as I
D
/I
G
= CL
a
2
,
where C = 0.0055 and L
a
in Å. From I
D
/I
G
=1.8~1.9
(Table 1), we get L
a
= 18.1~18.6 Å. In addition, the
position of G peak at 1,598 cm
−1
is in accordance with
the identification of NCG of insignificant doping [9].
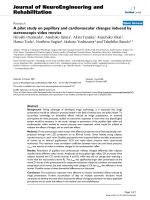
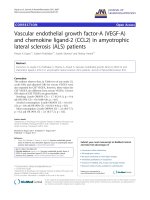
In order to clarify the carbon bonding nature, we per-
formed XPS measurements on the graphitic carbon
layer on SiO
2
.Figure4showstheC1sspectra,which
are decomposed into several Lorentzian peaks. Here, we
focus on the two strongest peaks centered at 284.6 eV
and 285.8 eV. The relative intensity ratios are 89.18%
(the peak at 284.6 eV) and 10.82% (the peak at 285.8
eV). In the literature, 284.7 ± 0.2 and 285.6 ± 0.2 eV
components are attributed to sp
2
and sp
3
hybridization
of C-C or C-H bonds, respectively [14]. In comb ination
with the Raman spectra, the XPS results demonstrate
that the sp
2
bonds are dominant in the carbon layer on
SiO
2
.
Another important result of this work is that the gra-
phitic carbon on amorphous oxide is very flat, which is
an important virtue for the integration with other mate-
rials. Figure 5 shows the AFM images of graphitic car-
bononSiO
2
and Eagle 2000™ glass. Like the NCG on
sapphire, no sign of island growth is observed. The
mean roughness parameters, R
a
,from1μm×1μm
scans are 0.224 nm (on SiO
2
)and0.089nm(onEagle
2000™ glass).Notably,theR
a
of NCG on Eagle 2000™
glass is almost the same as that of the substrate itself
which is famous for surface flatness.
Figure 3 Raman spectra of carbon films.Thefilmsweregrown
(a) at 950°C on amorphous SiO
2
and (b) at 900°C on Eagle 2000™
glass. In both cases, graphitic carbons of high crystallinity are
fabricated.
Figure 4 C1s XPS spectra of graphitic carbon on SiO
2
. The dashed line is a fit with four Lorentzians. The two strongest peaks (centered at
284.6 eV and 285.8 eV) are assigned to sp
2
and sp
3
hybridized carbon atoms, respectively.
Jerng et al. Nanoscale Research Letters 2011, 6:565
/>Page 4 of 6
Conclusions
In summary, we have grown graphitic carbon on crystal-
line and amorphous oxides by using carbon MBE. No ta-
bly, the graphitic carbons on amorphous SiO
2
and on
glass show a relatively high degree of graphitization, evi-
denced by well-developed D, G,and2D Raman peaks.
The C1s spectra from XPS measurements confirm the
dominance of sp
2
carbonbonding.Inaddition,thesur-
faces are almost as flat as the substrates, which may
play an important role in the integ ration with the exist-
ing technology.
Abbreviations
AFM: atomic force microscopy; CVD: chemical vapor deposition; MOS: metal-
oxide semiconductor; MBE: molecular beam epitaxy; NCG: nanocrystalline
graphite; XPS: X-ray photoelectron spectroscopy; YSZ: yttria-stabilized
zirconia.
Acknowledgements
This research was supported by the Priority Research Centers Program (2011-
0018395), the Basic Science Research Program (2011-0026292), and the
Center for Topological Matter in POSTECH (2011-0030046) through the
National Research Foundation of Korea (NRF) funded by the Ministry of
Education, Science and Technology (MEST). This work was also supported in
part by the General R/D Program of the Daegu Gyeongbuk Institute of
Science and Technology (DGIST) (Convergence Technology with New
Renewable Energy and Intelligent Robot).
Author details
1
Department of Physics and Graphene Research Institute, Sejong University,
Seoul 143-747, South Korea
2
Department of Physics, Ewha University, Seoul
151-747, South Korea
Authors’ contributions
SKJ carried out the carbon molecular beam epitaxy experiments and X-ray
photoelectron spectroscopy. DSY participated in the carbon molecular beam
epitaxy experiments. JHL carried out the atomic force microscopy
measurements. CK and SY characterized the thin films by Raman
spectroscopy. SHC designed the experiments and wrote the manuscript. All
authors read and approved the final manuscript.
Competing interests
The authors declare that they have no competing interests.
Received: 26 July 2011 Accepted: 26 October 2011
Published: 26 October 2011
References
1. Su CY, Lu AY, Wu CY, Li YT, Liu KK, Zhang W, Lin SY, Juang ZY, Zhong YL,
Chen FR, Li LJ: Direct formation of wafer scale graphene thin layers on
insulating substrates by chemical vapor deposition. Nano Lett 2011,
11:3612-6.
2. Scott A, Dianat A, Borrnert F, Bachmatiuk A, Zhang SS, Warner JH, Borowiak-
Palen E, Knupfer M, Buchner B, Cuniberti G, Rummeli MH: The catalytic
potential of high-kappa dielectrics for graphene formation. Appl Phys Lett
2011, 98:073110-1.
3. Kidambi PR, Bayer BC, Weatherup RS, Ochs R, Ducati C, Szabó DV,
Hofmann S: Hafnia nanoparticles - a model system for graphene growth
on a dielectric. physica status solidi (RRL) - Rapid Research Letters 2011,
5:341-343.
4. Hackley J, Ali D, DiPasquale J, Demaree JD, Richardson CJK: Graphitic
carbon growth on Si(111) using solid source molecular beam epitaxy.
Appl Phys Lett 2009, 95:133114.
5. Al-Temimy A, Riedl C, Starke U: Low temperature growth of epitaxial
graphene on SiC induced by carbon evaporation. Appl Phys Lett 2009,
95:231907.
6. Maeda F, Hibino H: Thin graphitic structure formation on various
substrates by gas-source molecular beam epitaxy using cracked ethanol.
Jpn J Appl Phys 2010, 49:04DH13.
7. Moreau E, Godey S, Ferrer FJ, Vignaud D, Wallart X, Avila J, Asensio MC,
Bournel F, Gallet JJ: Graphene growth by molecular beam epitaxy on the
carbon-face of SiC. Appl Phys Lett 2010, 97:241907.
8. Jerng SK, Yu DS, Kim YS, Ryou J, Hong S, Kim C, Yoon S, Efetov DK, Kim P,
Chun SH: Nanocrystalline graphite growth on sapphire by carbon
molecular beam epitaxy. J Phys Chem C 2011, 115:4491-4494.
9. Ferrari AC, Robertson J: Interpretation of Raman spectra of disordered
and amorphous carbon. Phys Rev B 2000, 61:14095-14107.
10. Ferrari AC, Robertson J: Resonant Raman spectroscopy of disordered,
amorphous, and diamondlike carbon. Phys Rev B 2001, 64:075414.
11. Ferrari AC: Raman spectroscopy of graphene and graphite: disorder,
electron-phonon coupling, doping and nonadiabatic effects. Solid State
Communications 2007, 143:47-57.
Figure 5 AFM imag es of graphitic carbon.1μm×1μm AFM images of graphitic carbon on (a)SiO
2
and (b) Eagle 2000™ glass. The mean
roughness parameters, R
a
, from 1 μm×1μm scans are (a) 0.224 nm and (b) 0.089 nm, respectively.
Jerng et al. Nanoscale Research Letters 2011, 6:565
/>Page 5 of 6
12. Cancado LG, Jorio A, Pimenta MA: Measuring the absolute Raman cross
section of nanographites as a function of laser energy and crystallite
size. Phys Rev B 2007, 76:064303.
13. Teweldebrhan D, Balandin AA: Modification of graphene properties due
to electron-beam irradiation. Appl Phys Lett 2009, 94:013101.
14. Ermolieff A, Chabli A, Pierre F, Rolland G, Rouchon D, Vannuffel C,
Vergnaud C, Baylet J, Semeria MN: XPS, Raman spectroscopy, X-ray
diffraction, specular X-ray reflectivity, transmission electron microscopy
and elastic recoil detection analysis of emissive carbon film
characterization. Surf Interface Anal 2001, 31:185-190.
doi:10.1186/1556-276X-6-565
Cite this article as: Jerng et al.: Graphitic carbon growth on crystalline
and amorphous oxide substrates using molecular beam epitaxy.
Nanoscale Research Letters 2011 6 :565.
Submit your manuscript to a
journal and benefi t from:
7 Convenient online submission
7 Rigorous peer review
7 Immediate publication on acceptance
7 Open access: articles freely available online
7 High visibility within the fi eld
7 Retaining the copyright to your article
Submit your next manuscript at 7 springeropen.com
Jerng et al. Nanoscale Research Letters 2011, 6:565
/>Page 6 of 6