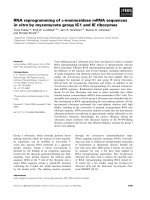
Báo cáo hóa học: " Nano-structure fabrication of GaAs using AFM tip-induced local oxidation method: different doping types and plane orientations" ppt
Bạn đang xem bản rút gọn của tài liệu. Xem và tải ngay bản đầy đủ của tài liệu tại đây (1.47 MB, 9 trang )
NANO EXPRESS Open Access
Nano-structure fabrication of GaAs using AFM
tip-induced local oxidation method: different
doping types and plane orientations
Jung-Joon Ahn
1
, Kyoung-Sook Moon
2
and Sang-Mo Koo
1*
Abstract
In this study, we have fabricated nano-scaled oxide structures on GaAs substrates that are doped in different
conductivity types of p- and n-types and plane orientations of GaAs(100) and GaAs(711), respectively, using an
atomic force microscopy (AFM) tip-induced local oxidation method. The AFM-induced GaAs oxide patterns were
obtained by varying applied bias from approximately 5 V to approximately 15 V and the tip loading forces from 60
to 180 nN. During the local oxidation, the humidity and the tip scan speed are fixed to approximately 45% and
approximately 6.3 μm/s, respectively. The local oxidation rate is further improved in p-type GaAs compared to
n-type GaAs substrates whereas the rate is enhanced in GaAs(100) compared to and GaAs(711), respectively, under
the identical conditions. In additio n, the oxide formation mechanisms in different doping types and plane
orientations were investigated and compared with two-dimensional simulation results.
Introduction
Atomic force microscopy (AFM) is considered as a pro-
mising tool to analyze and modify the nano-scaled struc-
tures and devices, and thus AFM-based lo cal oxidatio n
(AFM-LO) process has been intensively investigated to
fabricate and modulate nano-structures an d devices such
as field-effect transistors and single-electron transistors
with various samples including metals, semiconductors,
andeveninsulators[1,2].TheAFM-LOprocessisbasi-
cally an anodic oxidation, where the AFM tip and sub-
strate act as the cathode and anode, respectively. Thus, by
applying a negative bias to a conductive AFM tip, an
intense localized electric field is crea ted at t he substrate
close to the tip and the mechanism of AFM-LO has been
understood in terms of field-induced oxidation, which
requires larger local electric field than the critical electric
field of typical about 1 V/nm to dissolve the water mole-
cules to H+ and OH- ions in water bridge formed around
the tip [3,4] and the sample surface. Then, OH- ions are
transported to the positively biased sample surface in the
direction of the electric field and form the oxide structures
as reacting with atoms in the sample surface [3-6].
Recently, AFM-LO has been investigated primarily on Si
[5-8] and further extended to wide band gap semiconduc-
tors [9], graphene [10], and other compound semiconduc-
tors such as GaA s and AlGaAs [11-16]. In case of GaAs,
AFM-LO on heavily doped p-type GaAs has been studied
to improve aspect ratios and lateral resolutions of oxide
structures [16]. However, the AFM local oxidation studies
comparing different doping types and plane orientations
of GaAs have not been reported.
In this study, we systematically performed AFM-based
local oxidation on both n- and p-GaAs of different plane
orientations with (100) and (711), respectively. We used a
contact mode AFM for oxidation [17], which allows varying
the loading forces of the tip onto the sample surfaces as the
oxide structure is formed. The influence of the applied vol-
tages on the formation of local oxide was also investigated
and compared w ith numerical simulations [18,19].
Experimental
A commercial AFM (N8 A RGOS, Bruker AXS Inc.,
Madison, WI, USA) w as used to perform AFM-LO in
contact mode AFM and topography measurement in
non-contact mode AFM. A Si cantilever with a Pt-coated
conductive tip (ANSCM series, Appl Nano, Santa Clara,
CA, USA) having a diameter of approximately 100 nm
was used. The spring constant and the resonance
* Correspondence:
1
Department of Electronic Materials Engineering, Kwangwoon University,
Seoul 139-701, South Korea
Full list of author information is available at the end of the article
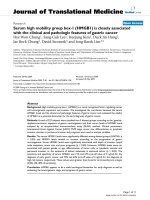
Ahn et al. Nanoscale Research Letters 2011, 6:550
/>© 2011 Ahn et al; licensee Springer. This is an Open Access article distributed under the terms of the Creative Commons Attribution
License ( which permits unrestri cted use, distribution, and reproduction in any med ium,
provided the original w ork is properly cited.
frequency were set to 3 N/m and 70 kHz, respectively.
Before performing AFM-LO, the GaAs samples were
cleaned by NH
4
OH/H
2
O mixtures to remove metal con-
taminations and native oxides. For environmental con-
trol, the microscope was placed into a cl osed box with
the relative humidity around 45%.The local oxide pat-
terns were generated on n- and p-type GaAs(100) and
GaAs(711), respectively, with a doping concentration of
approximately 10
19
cm
-3
, at room temperature during the
experiments. The oxide structures were formed electro-
chemically on the GaAs reactive surface by applying a
negative bias voltage between the sample surface and the
AFM probe. The electrical field was then created between
the native oxide layer and the substrate, which caused the
oxyanions (OH-) to drift thro ugh the oxide film [3-6].
During the AFM local oxidati on in contact mode, the tip
applied bias was varied in the range of 5 to 15 V and th e
tip loading force was modulated from approximately
60 nN to approximately 180 nN. The scan speed was
fixed to 6.028 μm/s, during the process.
During the AFM local oxidation i n contact mode, the
voltage was varied in the range of 5 to 15 V and the tip
loading force was modulated from approximately 60 nN
to approximately 180 nN. In addition, the chemical com-
position of the grown local oxides was a nalyzed by an
Auger electron spectroscopy (AES) system with a Schottky
field emission electron source. Numerical simulations
were performed by using COMSOL Multiphysics software
(FEMLAB, Burlington, MA, USA).
Results and discussion
The mechanism of local oxidation on the GaAs surface by
contact mode AFM using Pt-coated probe is described in
Figure 1. As an AFM probe is approaching to a GaAs, a
water bridge is developed around the tip-sample junction
due to the capillary force. The AFM probe performs as an
electrode at the sample surface which is anodically biased,
while the layer of absorbed water on the surface dissoci-
ates by a high electric field and acts as an electrolyte pro-
ducing this electroc hemical reaction. The chemical
reactions and charge transfer processes can be considered
as follows [12]:
1. Reactions at the GaAs surface:
2GaAs + 6H
2
O + 12h
+
hole
→ Ga
2
O
3
+As
2
O
3
+ 12H
+
6H
2
O + 12h
+
hole
→ 3O
2
↑ +12H
+
2. Reaction at an AFM probe:
12H
2
O + 12e
−
→ 6H
2
↑ +12OH
−
3. Reaction in water:
12H
+
+ 12OH
−
→ 6H
2
O
Figure 1 Schematics of the chemical reactions and species involved in the AFM local oxidation process. Induced by applying bias
voltage on AFM tip in air.
Ahn et al. Nanoscale Research Letters 2011, 6:550
/>Page 2 of 9
Here, h
+
hole
represents positively charged holes on the
GaAs surface. During the oxidation process, it is expected
that the H+ and OH- ions generated at the GaAs surface
and an AFM probe will recombine immediately according
to the recombination reaction in water and Ga
2
O
3
and
As
2
O
3
are formed on the reactive surf ace as Ga(A s)Ox is
formed.
The oxidation kinetics reported for Si [5-8] and GaAs
[12-14] indicate that regardless of the materials, the
observed self-limiting growth b ehavior is universal in
AFM tip-induced oxidation and its kinetics shows some
differences with the Cabrer a-Mott theory [20] for field-
induced oxidation. In 1997, Avouris et al. [8] propo sed
that the growth kinetics can be described as dh/dt ∝ exp
(-h/l
c
), where h is the oxide thickness at time t and l
c
is a
characteristic decay length depending on the anodization
voltage. This implies that lower scan rate can be more
effective in fabric ating oxide structures. Other than the
scan rate and anodization voltage, in performing AFM
local oxidation with contact mode AFM, we need to con-
sider the tip loading force. The height and aspect ratio of
oxide structures can be improved with a proper loading
force integrated with the tip-surface electric field.
Figure 2 depicts a cross section of AFM lo cal oxide
line patterns formed on p-GaAs(100), n-GaAs(100),
p-GaAs(711), and n-GaAs(711) substrates, respectively.
The patterns in Figure 2 were obtained by using a con-
stant negative tip voltag e of 5 V at the differ ent oxida-
tion loading forces of 60, 120, and 180 nN.
By varying the loading forces from 60 to 180 nN with a
fixed applied negative bias of 5 V, the height of modified
oxide structures was controlled in the range of approxi-
mately 3 nm to approximately 14 nm. As the loading force
increases from 60 to 180 nN, the height of the oxidation
pattern structures increases.
It i s interesting to note that the oxide structures th at
are formed in p-GaAs(100) is about doubled in height
to that of n-GaAs(100). We observed that increasing
Figure 2 An AFM images displaying the oxide lines.Formedat(a) p-type GaAs(100), (b) n-type GaAs(100), (c) p-type GaAs(711), and (d)n-
type GaAs(711) with varying loading forces of 60, 120, and 180 nN and applying tip voltage of 5 V.
Ahn et al. Nanoscale Research Letters 2011, 6:550
/>Page 3 of 9
loading force can result in larger and higher o xide pat-
terns on GaAs with each doping type. It has been
reported that increa sing applied v oltages can en hance
the electric field between AFM tip and sample surface
and cause larger oxide formation [5-7].
Figure 3 represents the he ight of oxide patterns gener-
ated on GaAs substrates with different doping types and
plane orientations, as a function of applied voltages from 5
to 15 V. During the local oxidation, tip loading forces in
the range of 60 to180 nN were induced. The oxide pat-
terns are formed at loading force of over 60 nN with an
applied voltage of 5 V, w hich is a threshold bias voltage
considering the circumstances.
The oxide heights of p-type GaAs(100) are varied from
approximately 3.2 nm to approximately 39 nm which is
clearly higher than that of n-GaAs(100). In the case of a
n-GaAs(711), the oxide is rarel y fo rmed to be around 1.6
to 2.8 nm. It is observed that the oxide height increases,
astheanodizationvoltageandastheloadingforceis
increased, as can also be seen from the linear fit to
experimental data. In order to control the size of oxide
patterns, the anodization voltages should also be modu-
lated in close relation to the tip loading forces.
In case of p-GaAs(100), the slope extracted from the
linear fit varies from 1.44 to 2.7, whereas the slope for
n-GaAs(100) increases from 0.28 to 1.03, which indi-
cates that the oxidation rate p-type GaAs is not only
high for but is also more sensitive to the bias change
than for n-type GaAs.
In order to investigate the impact of applied voltages
and loading forces on tip-i nduced electric field, w e per-
formed two-dimensional simulations (COMSOL Multi-
physics software, FEMLAB).
By combining the de finit ion of potential with Ga uss ’
law and the equation of continuity, it is possible to
derive the following Poisson’s equation:
−∇ · (ε
0
ε
r
∇V) = ρ
Figure 3 AFM local oxidation results.Of(a)p-GaAs(100),(b)n-GaAs(100),(c) p-GaAs(711), and (d) n-GaAs(711) as a function of the applied
bias voltages and the loading forces.
Ahn et al. Nanoscale Research Letters 2011, 6:550
/>Page 4 of 9
where ε
0
is the permittivity of free space, ε
r
is the relative
permittivity, and r is the space charge density. The basic
geometries are shown in Figures 4 and 5, and the regions
are coupled via boundary conditions; n(D1- D2) = 0 on
the surfaces of substrate as continuity condition and n·D =
0 on all outer boundaries as symmetry condition and V =
V
0
electric potential boundary condition, where n is the
outer normal vector to the boundary.
As shown in the electric field and potent ial distribu-
tions of Figure 4, an intense localized electric field maxi-
mum is created at the edge of the tip close to the
substrate for different bias conditions of -5, -10, and -15
V. The electric field is enhanced around the edge of AFM
tip and substrate region. Figure 4d compares the electric
field profile along the vertical cross-sectional lines for dif-
ferent bias conditions. As observed in the experiments,
the increased bias results in an increase in a local maxi-
mum electric field and thus improved local oxidation.
Figure 6 shows the loading force-dependent local
oxide height for GaAs with different doping types and
plane orientations. The loading f orces are changed from
60 to 180 nN. It can be seen that the oxide height
almost linearly increases as when the loading force is
increased. The slope, from the oxide height versus load-
ing force plots of Figure 6, varies from 0.96 to 2.3 for
p-GaAs, whereas the slope changes from 0.48 to 1.3 n-
GaAs, depending on the applied bias. This behavi or is
similar to the experimental results on bias dependence
shown in Figure 3. It is thus crucial to modulate the dis-
tance between AFM tip and oxide-substrate surf ace so
as to control the oxidation rate.
Figure5showstheelectricfielddistributionsand
equi-potential lines in the AFM tip and substrates struc-
tures with different tip-penetration depths of 0.5, 1.0,
and 2.0 nm, respectively. As shown in Figure 5d, the
maximum electric field forms around the edge of the tip
and the surface, and therefore the distance between the
maximum fields increases as the penetration depth
increases. Note that the level of maximum electric field
does not change much and still well above threshold
Figure 4 Contoured image of electric field between AFM probe and GaAs surface at different applied voltages.(a)-5V,(b) -10 V, ( c) -15
V, and (d) the electric field profile along the vertical cross-sectional lines for different bias conditions.
Ahn et al. Nanoscale Research Letters 2011, 6:550
/>Page 5 of 9
electric field of approximately 10
9
V/m. The penetration
depth, which is basically deformation of the formed
oxide or substrate through water layer, is dependent on
the applied loading force to the tip, which suggests
improved oxidation for a higher loading force.
Figure 7 summarizes the height of oxide patterns for the
GaAs samples with different doping types and plane orien-
tations, as a function of applied voltages (5 and 15 V) and
loading forces (60 and 180 nN). It can be observed that
the oxide height is further improved by adjusting the load-
ing force, for the same applied bias. Comparing the oxide
height of different doping type and plane orientation, it is
clearly shown that p-GaAs have higher oxidation rate in
both plane orientations of (100) and (711). On the other
hand, GaAs(100) shows higher oxidation rate than GaAs
(711) under the identical conditions.
In order to understand the behavior further and to
investigate the chemical composition of the oxide
structures, AES analysis was conducted on an oxidized
area of 5 × 5 μm
2
(35 nm to approximately 42 nm
oxide height). The Auger spectra taken from the GaAs
surface without any local oxidation are compared with
the local oxide patterned GaAs as shown in Figure 8a.
Both spectra have emission peaks of Ga-LMM at
approximately 1, 065 eV and As-LMM at approximately
1, 225 eV. The emission peak of O-KLL Auger electrons
having a kinetic energy of approximately 512 eV was
detected in patterned area. The atomic concen trati on at
Ga(As)Ox and GaAs is shown in Figure 8c. The compo-
sition ratio of Ga(As)Ox was as a function of depth by
sputtering into the oxidized area about 150 nm. Note
that the relative atomic concentration ratio of Ga
2
O
3
is
about two times larger than that of As
2
O
3
The result s
suggest that the predominant oxide is Ga
2
O
3
, and there-
fore improved oxidation on (100) plane orientation has
been explained by the different atomic density and
Figure 5 Contoured image of electric field between AFM probe and GaAs surface at different penetration depth.(a) 0.5 nm, (b) 1.0 nm,
(c) 2.0 nm, and (d) the electric field profile along the horizontal cross-sectional lines for different depth conditions.
Ahn et al. Nanoscale Research Letters 2011, 6:550
/>Page 6 of 9
surface states between Ga-rich GaAs(100) and As-rich
GaAs(711) faces.
Conclusions
To summarize, the AFM tip-induced local oxidation
technique has been used to investigate the oxidized
nano-structures on GaAs of different doping types and
plane orientations. The local oxide growth rate on GaAs
is found to be proportional to both applied voltages and
loading forc es. Two-dimensional simulation was carried
out to investigate the impact of applied voltages and
loading forces on tip-induced electric field between
AFM tip and GaAs surface.
The experimental results indicate that AFM local oxi-
dation on p-GaAs is further enhanced, compared to n-
GaAs, and this can be attributed to the predominant
oxideproportioninGa(As)Ox that is composed of
Ga
2
O
3
and As
2
O
3
. The atomic concentration in Ga(As)
Figure 6 AFM local oxidation results.Of(a)p-GaAs(100),(b)n-GaAs(100),(c) p-GaAs(711), and (d) n-GaAs(711) as a function of the applied
bias voltages and the loading forces.
Figure 7 Oxide height profiles of p-GaAs(100), n-GaAs(100), p-
GaAs(711), and n-GaAs(711). As a function of the applied bias
voltages and the loading forces.
Ahn et al. Nanoscale Research Letters 2011, 6:550
/>Page 7 of 9
Ox was analyzed by AES analysis, and the results indi-
cate that Ga(As)Ox cont ains both Ga
2
O
3
and As
2
O
3
and the atomic concentration of Ga is approximately
two times larger than that of As. It supports that the
predominant oxide is Ga
2
O
3
. In addition, the AFM local
oxidation on different plane orientations, GaAs(100) and
GaAs(711), was investigated. The improved oxidation on
(100) plane orientation has been explained by the differ-
ent atomic density and surface states between Ga-rich
GaAs(100) and As-rich GaAs(711) faces.
Acknowledgements
This work was supported by the Research Grant from Kwangwoon University
in 2011 and by the National Research Foundation Grant: 2011-0003298
Author details
1
Department of Electronic Materials Engineering, Kwangwoon University,
Seoul 139-701, South Korea
2
Department of Mathematics and Information,
Kyungwon University, Seongnam 461-701, South Korea
Authors’ contributions
JJA carried out the AFM local oxidation process and prepared the
manuscript initially. KSM participated in data analysis and performed two-
dimensional numerical simulations. SMK conceived the study and
participated in its design and coordination. All authors read and approved
the final manuscript.
Competing interests
The authors declare that they have no competing interests.
Received: 15 July 2011 Accepted: 6 October 2011
Published: 6 October 2011
References
1. Irmer B, Kehrle M, Lorenz H, Kotthaus JP: Nanolithography by non-contact
AFM-induced local oxidation: fabrication of tunnelling barriers suitable
for single-electron devices. Semicond Sci Technol 1998, 13:A79-A82.
2. Kremmer S, Peissl S, Teichert C, Kuchar F, Hofer H: Modification and
characterization of thin silicon gate oxides using conducting atomic
force microscopy. Mater Sci Eng B 2003, 102:88.
3. García R, Calleja M, Rohrer H: Patterning of silicon surfaces with
noncontact atomic force microscopy: field-induced formation of
nanometer-size water bridges. J Appl Phys 1999, 86:1898.
4. Gomez-Monivas S, Saenz J, Calleja M, Garcia R: Field-induced formation of
nanometer-sized water bridges. Phys Rev Lett 2003, 91:056101.
5. Snow ES, Jernigan GG, Campbell PM: The kinetics and mechanism of
scanned probe oxidation of Si. Appl Phys Lett 2000, 76:1782.
6. Dagata JA, Perez-Murano F, Abadal G, Morimoto K, Inoue T, Itoh J,
Yokoyama H: Predictive model for scanned probe oxidation kinetics. Appl
Phys Lett 2000, 76:2710.
7. Dagata JA, Inoue T, Itoh J, Matsumoto K, Yokoyama H: Role of space
charge in scanned probe oxidation. J Appl Phys 1998, 84:689.
Figure 8 AES profiles of (a) the former oxidized, (b) the oxide patterned intrinsi c GaAs(100) surface and (c) the atomic concentration
ratio of Ga, As, and O atoms in intrinsic GaAs.
Ahn et al. Nanoscale Research Letters 2011, 6:550
/>Page 8 of 9
8. Avouris PH, Martel R, Hertel T, Sandstrom R: AFM-tip-induced and current-
induced local oxidation of silicon and metals. Appl Phys A 1998, 66:
S659-S667.
9. Ahn JJ, Jo YD, Kim SC, Lee JH, Koo SM: Crystallographic plane-orientation
dependent atomic force microscopy-based local oxidation of silicon
carbide. Nanoscale Research Letters 2011, 6:235.
10. Masubuchi S, Ono M, Yoshida K, Hirakawa K, Machida T: Fabrication of
graphene nanoribbon by local anodic oxidation lithography using
atomic force microscope. Appl Phys Lett 2009, 94:082107.
11. Reinhardt F, Dwir B, Biasiol G, Kapon E: Atomic force microscopy of III-V
nanostructures in air. Appl Surf Sci 1996, 104/105:529-538.
12. Huang WP, Cheng HH, Jian SR, Chuu DS, Hsieh JY, Lin CM, Chiang MS:
Localized electrochemical oxidation of p-GaAs(100) using atomic force
microscopy with a carbon nanotube probe. Nanotechnology 2006,
17:3838-3843.
13. Jian SR, Fang TH, Chuu DS: Mechanisms of p-GaAs(100) surface by atomic
force microscope nano-oxidation. J Phys D: Appl Phys 2005, 38:2424-2432.
14. Okada Y, Iuchi Y, Kawabe M: Scanning probe microscope tip-induced
oxidation of GaAs using modulated tip bias. J Appl Phys 2000, 87:12.
15. Graf D, Frommenwiller M, Studerus P, Ihn T, Ensslin K, Driscoll DC,
Gossard AC: Local oxidation of Ga[Al]As heterostructures with modulated
tip-sample voltages. J Appl Phys 2006, 99:053707.
16. Shirakashi J, Matsumoto K, Konagai M: An AFM-based surface oxidation
process for heavily carbon-doped p-type GaAs with a hole
concentration of 1.5 × 10
21
cm
-3
. Appl Phys A 1998, 66:S1083-S1087.
17. Miyahara K, Nagashima N, Ohmura T, Matsuoka S: Evaluation of
mechanical properties in nanometer scale using AFM-based
nanoindentation tester. Nano Structured Materials 1999, 12:1049-1052.
18. Langehanenberg P, Bally G, Kemper B: Autofocusing in digital holographic
microscopy. 3D Res 2011, 02:01004.
19. Merola F, Miccio L, Coppola S, Vespini V, Paturzo M, Grilli S, Ferraro P:
Exploring the capabilities of digital holography as tool for testing optical
microstructures. 3D Res 2011, 02:01003.
20. Zhdanov VP, Kasemo B: Cabrera-Mott kinetics of oxidation of nm-sized
metal particles. Chemical Physics Letters 2008, 452:285-288.
doi:10.1186/1556-276X-6-550
Cite this article as: Ahn et al.: Nano-structure fabrication of GaAs using
AFM tip-induced local oxidation method: different doping types and
plane orientations. Nanoscale Research Letters 2011 6:550.
Submit your manuscript to a
journal and benefi t from:
7 Convenient online submission
7 Rigorous peer review
7 Immediate publication on acceptance
7 Open access: articles freely available online
7 High visibility within the fi eld
7 Retaining the copyright to your article
Submit your next manuscript at 7 springeropen.com
Ahn et al. Nanoscale Research Letters 2011, 6:550
/>Page 9 of 9