Báo cáo hóa học: " Diagnostic evaluation of three cardiac software packages using a consecutive group of patients" docx
Bạn đang xem bản rút gọn của tài liệu. Xem và tải ngay bản đầy đủ của tài liệu tại đây (1.19 MB, 7 trang )
ORIGINAL RESEARCH Open Access
Diagnostic evaluation of three cardiac software
packages using a consecutive group of patients
Lena Johansson
1
, Milan Lomsky
1
, Jens Marving
2
, Mattias Ohlsson
3
, Sven-Eric Svensson
2
and Lars Edenbrandt
1,2,4*
Abstract
Purpose: The aim of this study was to compa re the diagnostic performance of the three software packages
4DMSPECT (4DM), Emory Cardiac Toolbox (ECTb), and Cedars Quantitative Perfusion SPECT (QPS) for quantification
of myocardial perfusion scintigram (MPS) using a large group of consecutive patients.
Methods: We studied 1,052 consecutive patients who underwent 2-day stress/rest 99mTc-sestamibi MPS studies.
The reference/gold-standard classifications for the MPS studies were obtained from three physicians, with more
than 25 years each of experience in nuclear cardiology, who re-evaluated all MPS images. Automatic processing
was carried out using 4DM, ECTb, and QPS software packages. Total stress defect extent (TDE) and summed stress
score (SSS) based on a 17-segment model were obtained from the software packages. Receiver-operating
characteristic (ROC) analysis was performed.
Results: A total of 734 patients were classified as normal and the remaining 318 were classified as having
infarction and/or ischemia. The performance of the software packages calculated as the area under the SSS ROC
curve were 0.87 for 4DM, 0.80 for QPS, and 0.76 for ECTb (QPS vs. ECTb p = 0.03; other differences p < 0.0001). The
area under the TDE ROC curve were 0.87 for 4DM, 0.82 for QPS, and 0.76 for ECTb (QPS vs. ECTb p = 0.0005; other
differences p < 0.0001).
Conclusion: There are considerable differences in performance between the three software packages with 4DM
showing the best performance and ECTb the worst. These differences in performance should be taken in
consideration when software packages are used in clinical routine or in clinical studies.
Keywords: myocardial perfusion imaging, SPECT, automatic quantification, software, coronary artery disease
Introduction
Visual interpretation of myocardial perfusion scinti-
grams (MPS) is dependent on the experience and
knowledge of the physician, and subject to inter- and
intraobserver variability [1]. Software packages for auto-
mated quantification of MPS have been developed in
order to make the interpretations more standardized.
Modules of these packages for a utomatic assessment of
left ventricular function from a gated MPS have been
extensively compared [2-4]. The corresponding modules
for automatic quantification of the perfusion of the left
ventricle have only been compared in a limited number
of studies [5-7].
Themostwidelyusedapproachtoquantifyingperfu-
sion is to divide the left ventricular myocardium into 17
or 20 segments and to score each segment for perfusion
defects using a five-point scale [8]. The sum of the
scores in the segments for the stress images are defined
as the summed stress score (SSS). This standard para-
meter is provided in a consistent manner by the three
software packages 4D-MSPECT (4DM, Invia Medical
Imaging Solutions, Ann Arbor, MI, USA) [9], Emory
Cardiac Toolbox (ECTb, Emory University, Atlanta, GA,
USA) [10] and Quantitative Perfusion SPECT (QPS,
Cedars-Sinai Medical Center, Los Angeles, CA, USA)
[11] to mimic visual reading. Considerable variability
between SSS value s obtained with the different software
packages has been reported [5-7].
The total stress defect extent (TDE) of 3% or greater
has also been proposed as a criterion for abnormality by
* Correspondence:
1
Department of Molecular and Clinical Medicine, Clinical Physiology,
Sahlgrenska University Hospital, Gothenburg, Sweden
Full list of author information is available at the end of the article
Johansson et al. EJNMMI Research 2011, 1:22
/>© 2011 Johansson et al; licensee Springer. This is an Open Access article distribute d under the terms of the Creative Commons
Attribution License (http://creativecommons.o rg/licenses/by/2.0), which permits unrestricted use, distribution, and reproduction in
any medium, provided the original work is properly cited.
the group behind ECTb [10]. The extent of the left ven-
tricle being hypoperfused is provided by all three soft-
ware packages and also possible to compare.
Guner et al. found substantial differences in magni-
tudes of the SSS and TDE values produced by 4DM,
ECTb, and QPS, indicating that different thresholds
need to be applied to the different software packages
[7]. Receiver-operating characteristic (ROC) analysis as
well as comparisons of specificities of the software
packages at similar levels of sensitivity therefore needs
to be performed in order to compare the diagnostic
performances.
The purpose of this study was to compare the diag-
nostic performance of the three software packages 4DM,
ECTb, and QPS for quantification of MPS using a large
group of consecutive patients. All MPS studies were
classified by three physicians with long experience of
nuclear cardiology.
Materials and methods
Patients
The patients were selected from 1,245 consecutive
patients who underwent rest/stress (exercise/ adenosine)-
gated MPS from September 15, 2005 to September 14,
2007 at the Sahlgrenska University Hospital, Gothenburg,
Sweden. Patients with incomplete data (missing rest,
stress, or gated study) were not considered and only one
examination per patient was included. A total of 100
patients with left-bundle branch block, or paced rhythm
were excluded. Thirtu-four MPS studies of an insufficient
tech nical quality, e.g., arrhythmia and inadequate level of
exercise, and 59 studies o f an insufficient i mage quality,
e.g., high extra-cardiac uptake, were excluded. The study
group comprised the remaining 1,052 patients. The clini-
cal characteristics of these patients are summarized in
Table 1. The study was approved by the Research Ethics
Committee at Gothenburg University.
Stress testing
Patients were stressed using either pharmacological
stress with adenosine (57%) or maximal symptom lim-
ited exercise on a bicycle ergometer (43%). The pharma-
cological stress or exercise was continued for at least 2
min after injection of the tracer.
Imaging protocols
The gated single-photon emission computed tomography
(SPECT) studies were performed using a 2-day non-
gated stress/gated rest
99 m
Tc-sestamibi protocol. Stress
and rest acquisition began a bout 60 min after the injec-
tion of 600 MBq
99 m
Tc-se stamibi. Images were acquired
using two different dual-head SPECT cameras (Infinia or
Millenium VG, General Electric, Fairfield, CT, USA)
equipped with low-energy, high-resolution collimators.
Acquisition was carried out in the supine position in step
and shoot mode using circular acquisition and a 64 × 64
matrix, a zoom factor of 1.28 and a pixel size of 6.9 mm,
with 60 projections over 180° and 40 s per projection. In
patients weighing over 90 kg, the acquisition time per
projection was increased to 55 s. During the rest acquisi-
tion, the patient was monitored using a three-lead ECG.
The acceptance window was opened to ± 20% of the pre-
defined R-R interval. Other beats were rejected. Each R-R
interval was divided into eight equal time intervals.
Gated-SPECT acquisi tion was performed at the same
time as ungated routine SPECT acquisition. An auto-
matic motion-correction program was applied in studies
showing patient motion during acquisition.
Tomographic reconstruction
Tomographic reconstruction was performed using filtered
back-projection with a Butterworth filter for all studies.
During the study period, the critical frequency and order
were changed in from 0.40 to 0.52 cycles/cm and from
order 10 to 5. The reconstruction of gated data used fil-
tered back projection with a Butterworth filter with a criti-
cal frequency of 0.40 cycles/cm and order 10 for all
studies. No attenuation or scatter correction was used.
Reference classifications
The reference classifications for the MPS studies regard-
ing presence or absence of ischemia and/or infarction
Table 1 Patient characteristics (n = 1,052)
Characteristic Number
Age (years) mean ± SD 62 ± 10.3 (range 29 to 89)
Gender
Female 553 (53%)
Male 499 (47%)
Body mass index (kg/m
2
) mean ± SD 26.6 ± 4.4
Body mass index > 30 185 (18%)
Chest pain 293 (28%)
Hypertension 551 (52%)
Diabetes 185 (18%)
Hypercholesterolemia 475 (45%)
Smoker 144 (14%)
Family history 375 (36%)
Infarction 147 (14%)
PTCA 149 (14%)
CABG 101 (10%)
Stress
Adenosine 599 (57%)
Exercise 453 (43%)
Indication
Diagnosis 788 (75%)
Known CAD 252 (24%)
Other 12 (1%)
Johansson et al. EJNMMI Research 2011, 1:22
/>Page 2 of 7
were obtained from three physician s, each of whom had
over 25 years’ experience of nuclear cardiology. They re-
evaluated all MPS images separately. All cases were clas-
sified visually, and a custom display software was devel-
oped for this purpose, allowing the experts to view slice
images (short axis, horizontal and vertical long axis) of
the rest, stress, and gated-rest studies, polar plots (rest,
stress, rest-stress difference, stress/rest ratio, motion and
thickening) and 3D-images. Color scales and contrast
levels were adjustable. No quantitative results from any
software package were available during the re-evalua-
tion. The custom display software used images directly
from the reconstructed data, i.e., polar maps and 3D
images were not taken from any of the quantitation
software packages in order to avoid that a clinician’s
familiarity with interpreting data from a particular pack-
age could influence the results.
The following clinical information was available during
the re-evaluation process: age, gender, previous myocar-
dial infarction, previous re-vascularisation, present
smoking, presence of hypertension, hyperlipidemia, dia-
betes, peripheral vascular disease, positive family history,
and presence of typical chest pain. At the time of the
MPS, all patients were asked about clinical risk factors
and the presence of symptoms. Clinical information was
also collected from the referral cards.
The three experts classified each patient case sepa-
rately, and the majority rule was applied in cases of dis-
agreement, i.e. the reference classification of ischemia
required that at least two of the three experts classified
that case as ischemia. The experts also had the possibi-
lity of classifying an MPS as of insufficient quality, and
these cases were excluded.
Software packages
The following three software packages were used:
• 4D-MSPECT, Version 4.0, Universi ty of Michigan
Medical Center (4DM) [9];
• Emory Cardiac Toolbox, Version 3.0, Emory Uni-
versity Medical Center (ECTb) [10];
• Cedars Quantitative Perfusion SPECT, Version 4.0,
Cedars-Sinai Medical Center (QPS) [11].
Using the datab ase menu in each package, databases
that matched the described acquisition protocol were
selected. Quantitative analysis was performed on a
Xeleris workstation Version 2.0551 (General Electric,
USA) for the 4DM, ECTb, and QPS packages. The same
reconstructed short-axis images were loaded to all three
software packages. Experienced laboratory technologists,
blind to the reference clas sifications, processed the stu-
dies and manually corrected the automatic left ventricu-
lar positioning within each software package when
necessary. Corrections were made only fo r major discre-
pancies, to avoid any unnecessary manipulation of the
data. This approach was used in order to make the
results relevant to other MPS clinics and not influenced
by the opinion of our technologies.
The TDE and S SS values based on a 17-segment
model were obtained from the software packages. ROC
analysis was performed for the analysis of performance
regarding the classification of the MPS studies as nor-
mal vs. abnormal (infarction and/or ischemia).
A commonly used criterion for abnormality is an SSS
of 4 or greater. This criterion was originally used for 20-
segment analysis. In this study, we used the currently
recommended 17-segment model, which may produce
slightly lower SSS values. We therefore also included the
criterion SSS 3 or greater for abnormality. Furthermore,
ECTb has shown to produce higher SSS values and we
therefore also added a criterion SSS of 5 or greater.
ECTb proposes a c riterion for abnormality for TDE of
3% or greater [10]. All this criteria were evaluated.
Statistical analysis
The significance of the difference between two obtained
ROC areas was calcul ated using a permutat ion test [12].
The test is performed by repeatedly and randomly per-
muting the cases in the two lists. For each permutation
the difference of t he two resulti ng areas were calculated
(test statistic). The evidence against the null hypothesis,
of no difference between the two original ROC areas,
was given by the fract ion of area differences of the test
statistic larger than the actual difference.
The significance of a difference in specificity or sensi -
tivity between two software packages was tested, paying
particular attention to the fact that the same studies
were used, i.e., a McNemar type of statistic was used.
Results
The contours required adjustment in 21 (2.0%), 32
(3.0%), and 9 (0.9%) of th e 1,052 patients using the
4DM, ECTb, and QPS software packages, respectively.
The three experts’ classifications showed ischemia in
257 patients and infarction in 150 patients . Eighty-nine
of these patients had both ischemia and infarction, and
the number of patients with either ischemia or infarc-
tion or both was 318. The remaining 734 patients were
classified as normal. All three experts agreed regarding
ischemia/no ischemia in 748 (71%) and regarding infarc-
tion/no infarction in 872 (83%) of the 1,052 patients.
The performances for the three software packages cal-
culated as the areas under the ROC curves are pre-
sented in Ta ble 2. For both SSS and TDE, 4DM showed
better performance than QPS which showed better per-
formance than ECTb, with all differences being statisti-
cally significant. For QPS, the TDE performance was
Johansson et al. EJNMMI Research 2011, 1:22
/>Page 3 of 7
slightly better than for the SSS, but for 4DM and ECTb
there were no significant differences between TDE and
SSS.
The SSS criterion for abnormality of 3 or greater for
4DM and QPS showed ap proximately the same sensitiv-
ity as an SSS criterion of 5 or greater for ECTb (78.3%
for 4DM; 76.1% for ECTb; 75.2% for QPS; differences
not significant). The corresponding specificities were
80.2% for 4DM, 72.9 for QPS and 61.3% for ECTb (p =
0.0005 for QPS vs 4DM and p < 0.0001 for the other
differences).
The TDE criterion of 3% or greater showed sensitiv-
ities of 87.4% for ECTb, 80.8% f or 4DM, and 78.9% for
QPS (p = 0.004 for ECTb vs 4DM; p = 0.0003 for ECTb
vs QPS; not significant for 4DM vs QPS). Th e corre-
sponding specificities were 79.3% for 4DM, 66.6% f or
QPS, and 41.6% for ECTb (all differences p < 0.0001)
(Table 3).
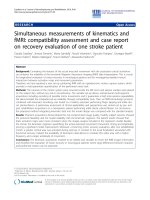
Figure 1 pro vides polar maps of three e xamples that
reflect our main findings. The abnormal case (A) is true
positive for all three packages but with differences in
SSS between 4 and 21. The first normal case (B) is true
negative for 4DM and QPS but clearly false positive for
ECTb (SSS = 11). The second normal case (C) is false
positive for both ECTb and QPS.
Discussion
The results of this study show significant differences in
diagnostic performance between the software packages
for quantitative MPS analysis. Differences between the
scores presented by 4DM, ECTb, and QPS have also
beenshowninpreviousstudies.InthestudyofWolak
et al., 4DM and QPS also showed significantly higher
performancethanECTbinthedetectionofcoronary
artery disease measured as area under the SSS ROC
curve[6].ECTbshowedanareaundertheSSSROC
curve of 0.76 both in this study and that of Wolak et al.
[6] and th e sensit ivity/specificity for the SSS criterion of
4 or greater for abnormality was similar in the two stu-
dies (82%/53% in this study; 85%/49% [6]). The relation
between 4DM and QPS was different in the two studies.
4DMshowedsignificantlyhigherareaundertheROC
curve than QPS while there was no significant difference
in the study of Wolak et al. [6].
Guner et al. also studied t he performance of 4DM,
ECTb, and QPS in detecting coronary artery disease
using MPS with
201
Tl [7]. They did not find significant
differences between the three software packages mea-
sured as area under the SSS or TDE ROC curves [7].
Patient population
To the best of our knowledge, this is the largest study to
compare MPS software packages based on material from
consecutive MPS patients. We only excluded patients
with paced rhythm or left-bundle branch block, or with
technically insufficient studies, leaving 84% of the
patients in the study population. The exclusion criteria
are also less likely to bias the material towards more
normal or abnormal cases. In contrast, Wolak et al. [6]
only included 13% of the study group (328 out of 2,450)
and Guner et al. [7] included 12% (283 out of 2,430) of
the patients referred for MPS. In both these studies,
they included MPS patients who had a coronary angio-
gram within 60 days or 3 months of the MPS study.
Wolak [6] also included a gr oup of MPS patients with a
low likelihood of coronary artery disease. This approach
may result i n a post-test referral bias as a result of pre-
ferential selection of patients with a clear positive MPS
examination for coronary angiography. Patients with
slightly abnormal MPS findings that are not severe
enough to justify motivate an angiogram will not be
included. The results of this study are likely to better
reflect the performance of the software packages in clin-
ical routine.
Reference classification
The use of corona ry angiography as a gold standard has
the advantage that it is an independent reference.
Table 2 The areas under the ROC curves for detection of perfusion abnormality
4DM ECTb QPS p
SSS 0.87 (0.85 - 0.89) 0.76 (0.73 - 0.79) 0.80 (0.77 - 0.82) ECTb vs QPS p = 0.03
All others p < 0.001
TDE 0.87 (0.85 - 0.89) 0.76 (0.73 - 0.79) 0.82 (0.79 - 0.84) All p < 0.001
Difference between SSS and TDE was significant (p = 0.03) for QPS and not significant for 4DM and ECTb.
Table 3 Comparison of the specificities and sensitivities
for different SSS and TDE criteria
4DM ECTb QPS
Specificity (n = 734)
SSS < 3 80.2% 44.4% 72.9%
SSS < 4 86.1% 52.6% 79.8%
SSS < 5 89.5% 61.3% 85.3%
TDE < 3 79.3% 41.6% 66.6%
Sensitivity (n = 318)
SSS ≥ 3 78.3% 85.5% 75.2%
SSS ≥ 4 72.3% 81.8% 66.7%
SSS ≥ 5 68.2% 76.1% 59.7%
TDE ≥ 3 80.8% 87.4% 78.9%
Johansson et al. EJNMMI Research 2011, 1:22
/>Page 4 of 7
Disadvantages include the patient-selection bias dis-
cussed above and the well-known lack of c orrespon-
dence between a reduction in perfusion and the degree
of coronary stenosis assessed from an angiogram in
many cases. We therefore decided to use expert readings
of the MPS images as our reference classifications, so as
to avoid these disadvantages. In order to have t he best
possible reference classifications, we used three very
Figure 1 Case illustration of three patients. The polar map for the 4DM software is shown at left, for the ECTb software at center, and for the
QPS software at right. (A) Abnormal case from a 58-year-old hypertensive man with typical chest pain. The summed stress score (SSS)/total stress
defect extent (TDE) = 21/47%, 4/7%, and 8/14% for 4DM, ECTb, and QPS, respectively. (B) Normal case from a 68-year-old hypertensive woman
with atypical chest pain. The SSS/TDE = 0/0%, 11/21%, and 0/0% for 4DM, ECTb, and QPS, respectively. (C) 74-year-old hypertensive woman with
atypical chest pain and no risk factors. The SSS/TDE = 3/2%, 9/22%, and 8/8% for 4DM, ECTb, and QPS, respectively. The boundaries of the left
ventricle automatically defined by the software packages are illustrated in the horizontal long axis slices. Note the different approach to define
the septal part.
Johansson et al. EJNMMI Research 2011, 1:22
/>Page 5 of 7
experienced experts, each of whom had over 25 years’
experience of nuclear cardiology. They separately classi-
fied all MPS images visually and did not use any quanti-
fication software in order not to be biased towards the
results of that specific program.
We used three observers and applied the majority rule
in order to minimize the effects of observer variability.
All three experts agreed regarding infarction and ische-
mia in 83% and 71% of the cases, respectively. This illus-
trates that visual interpretation is subject to inter-
observer variability, even for very experienced physi-
cians. This is the motivation for the development of
automatic software packages, to make the interpreta-
tions more standardized. In a study by Lindahl et al.,
three physicians separately classified 135 MPS studies
twice without a computer-assisted diagnosis (CAD) sys-
tem and thereafter twice using the advice of a CAD sys-
tem [1]. They used a four-grade scale to classify the
studies re garding presen ce of coronary artery disease in
the LAD and LCX/RCA territories. Without the advice
oftheCADsystem,theymadethesameclassification
for the same MPS study in 72% of the cases and with
the CAD system in 82% of the cases. Those results
showed that they improved their consistency with a
CAD system and this was a lso the case for the most
experienced of the three physicians, who had 20 years’
experience of interpreting MPS studies.
Interpretation of coronary angiograms is also subject to
observer variability. Banerjee et al. measured the agree-
ment between independent assessme nts by two cardiolo-
gists in 209 coronary angiograms [13]. They found
agreement regarding coronary disease to be 69% for the
left circumflex artery, 82% for the right coronary and 89%
for the left an terior descending arteries. This probl em of
variability needs to be addressed, regardless of whether
coronary angiography or MPS is used as the reference.
The gold standard was based on one experienced cardiolo-
gist for the angiographic evaluation in the study by Guner
[7], and experienced physicians, who interpreted all coron-
ary angiograms visually, in Wolak’sstudy[6].
Normal databases
We used the normal databases provided in the soft ware
packages. Both Wolak et al. [6] and Guner et al. [7]
found that the application of an institutional normal
database did not significantly improve the performance
of the software. Furthermore, to our knowledge, most
clinical users of the software packages use a normal
database provided by the vendor and not their own
institutional normal database. We wanted the results to
reflect the performance of the software packages in clin-
ical routine and we therefore used the same normal
databases that are available to other users of the soft-
ware packages.
The custom normal database used by Wolak et al.
consist ed of 50% patients with a body mass index (BMI)
of over 30 and in their angiographic group 45% had a
BMI greater than 30 [6]. In this study, 18% of the
patients had a BMI greater than 30. Thus, adopting an
American normal databa se for analyzing a patient popu-
lation with low prevalence of subjects with high BMI
may be cr itical, but that is again to our knowledge the
most common way to use these software packages. In
order to mimic the clinical routine of a European MPS
clinic, we evaluated the three software packages with
their American normal databases and a gold standard
based on a European team of physicians. We therefore
feel that this type of study is of interest to clinicians at
European MPS clinics.
Limitations
This study is focused on the diagnostic performance of
commonly used criteria for abnormality for the three
software packages 4DM, ECTb, and QPS. In clinical
practice, the SSS or TDE value and the location of the
blackout or the segments with abnormal scores is also
important for the physician interpreting the study. The
abnormal case in Figure 1A illustrates that the degree of
disease can differ substantially (SSS range from 4 to 21
and TDE from 7% to 47%) also in cases that are classi-
fied as true positive for all software packages. The nor-
mal case in Figure 1C illustrates that the location of
blackouts can differ. QPS indicates a septal defect, 4DM
indicates a lateral defect, and ECTb both a septal defect
and a lateral defect. The three software packages have
different approaches to handle the difficult basal region,
with different methods for delineation of the left ventri-
cle (Figure 1). Also, differences in the normal databases
and definitions of abnormal pixel values p robably
explain the different quantification results.
Thus there are clinically very important differences
between the software packages regarding the size and
location of the abnormalities that are not assessed in
this study or i n the studies of Wolak et al. [6] or Guner
et al. [7].
This study was conducted without attenuation correc-
tion. This is not routinely performed in our department,
but it is an essential tool in quantitative analysis and is
likely to become more widely used. Poss ible attenuation
artifacts mimicking a perfusion abnormality were pre-
sent both for the three experienced readers involved in
the reference classification and in the analysis of the
software packages. The accuracies of the software
packages presented in this study would therefore prob-
ably not be significantly influenced by attenu ation arti-
facts. This is more likely to happen if an independent
gold-standard method such as coronary angiography is
used. Thus, attenuation artifacts probably only had a
Johansson et al. EJNMMI Research 2011, 1:22
/>Page 6 of 7
minor influence on the results of this study, since both
the experts produced the reference classifications and
the software packages, used non-corre cted normal data-
bases, and analyzed non-corrected images.
Conclusion
There are considerable differences in performance
between the three software packages with 4DM showing
the best performance and ECTb the wo rst. These differ-
ences in performance should be taken in consideration
when software packages are used in clinical routine or
in clinical studies.
Author details
1
Department of Molecular and Clinical Medicine, Clinical Physiology,
Sahlgrenska University Hospital, Gothenburg, Sweden
2
Department of
Clinical Sciences, Malmö, Lund University, Lund, Sweden
3
Department of
Theoretical Physics, Lund University, Lund, Sweden
4
Department of Clinical
Physiology, Skåne University Hospital, Malmö, 205 02 Malmö, Sweden
Authors’ contributions
LJ participated in the design of the study, performed the analysis of the
toolboxes and drafted the manuscript. ML, JM, and SES performed the
reference classifications. MO performed the statistical analysis. LE conceived
of the study, and participated in its design and coordination and helped to
draft the manuscript. All authors read and approved the final manuscript.
Competing interests
Lars Edenbrandt is shareholder in EXINI Diagnostics AB, Lund, Sweden, a
company that provides decision support systems for myocardial perfusion
imaging.
Received: 25 May 2011 Accepted: 30 September 2011
Published: 30 September 2011
References
1. Lindahl D, Lanke J, Lundin A, Palmer J, Edenbrandt L: Improved
classifications of myocardial bull’s-eye scintigrams with computer-based
decision support system. J Nucl Med 1999, 40:96-101.
2. Lomsky M, Richter J, Johansson L, Høilund-Carlsen PF, Edenbrandt L:
Validation of a new automated method for analysis of gated-SPECT
images. Clin Physiol Funct Imaging 2006, 26:139-145.
3. Winz OH, Meyer PT, Knollmann D, Lipke DSA, Kuhl HP, Oelve C,
Schaefer WM: Quantification of left ventricular volumes and ejection
fraction from gated 99mTc-MIBI SPECT: MRI validation of the EXINI heart
software package. Clin Physiol Funct Imaging 2009, 29:89-94.
4. Hedeer F, Palmer J, Arheden H, Ugander M: Gated myocardial perfusion
SPECT underestimates left ventricular volumes and shows high
variability compared to cardiac magnetic resonance imaging - a
comparison of four different commercial automated software packages.
BMC Med Imaging 2010, 10:10.
5. Svensson A, Åkesson L, Edenbrandt L: Quantification of myocardial
perfusion defects using three different software packages. Eur J Nucl Med
Mol Imaging 2004, 31:229-232.
6. Wolak A, Slomka PJ, Fish MB, Lorenzo S, Acampa W, Berman DS,
Germano G: Quantitative myocardial-perfusion SPECT. Comparison of
three state-of-the-art software packages. J Nucl Cardiol 2008, 15:27-34.
7. Guner LA, Karabacak NI, Cakir T, Akdemir OU, Kocaman SA, Cengel A,
Unlu M: Comparison of diagnostic performances of three different
software packages in detecting coronary artery disease. Eur J Nucl Med
Mol Imaging 2010, 37:2070-2078.
8. Berman DS, Abidov A, Kang X, Hayes SW, Friedman JD, Sciammarella MG,
Cohen I, Gerlach J, Waechter PB, Germano G, Hachamovitch R: Prognostic
validation of a 17-segment score derived from a 20-segment score for
myocardial perfusion SPECT interpretation. J Nucl Cardiol 2004,
11:414-423.
9. Ficaro EP, Lee BC, Kritzman JN, Corbett JR: Corridor4DM: The Michigan
method for quantitative nuclear cardiology. J Nucl Cardiol 2007,
14:455-465.
10. Garcia EV, Faber TL, Cooke CD, Folks RD, Chen J, Santana C: The increasing
role of quantification in clinical nuclear cardiology: The Emory approach.
J Nucl Cardiol 2007, 14:420-432.
11. Germano G, Kavanagh PB, Slomka PJ, Van Kriekinge SD, Pollard G,
Berman DS: Quantitation in gated perfusion SPECT imaging: The Cedars-
Sinai approach. J Nucl Cardiol 2007, 14:433-454.
12. Wehrens RPH, Buydens LMC: The bootstrap: a tutorial. Chemom Intell Lab
Syst 2000, 54:35-52.
13. Banerjee S, Crook AM, Dawson JR, Timmis AD, Hemingway H: Magnitude
and consequences of error in coronary angiography interpretation (the
ACRE study). Am J Cardiol 2000, 85:309-314.
doi:10.1186/2191-219X-1-22
Cite this article as: Johansson et al.: Diagnostic evaluation of three
cardiac software packages using a consecutive group of patients.
EJNMMI Research 2011 1:22.
Submit your manuscript to a
journal and benefi t from:
7 Convenient online submission
7 Rigorous peer review
7 Immediate publication on acceptance
7 Open access: articles freely available online
7 High visibility within the fi eld
7 Retaining the copyright to your article
Submit your next manuscript at 7 springeropen.com
Johansson et al. EJNMMI Research 2011, 1:22
/>Page 7 of 7