Báo cáo hóa học: " The role of different methanogen groups evaluated by Real-Time qPCR as high-efficiency bioindicators of wet anaerobic co-digestion of organic waste" ppt
Bạn đang xem bản rút gọn của tài liệu. Xem và tải ngay bản đầy đủ của tài liệu tại đây (325.59 KB, 7 trang )
ORIGINAL Open Access
The role of different methanogen groups
evaluated by Real-Time qPCR as high-efficiency
bioindicators of wet anaerobic co-digestion of
organic waste
Deborah Traversi
1*
, Silvia Villa
1
, Marco Acri
2
, Biancamaria Pietrangeli
3
, Raffaella Degan
1
and Giorgio Gilli
1
Abstract
Methanogen populations and their domains are poorly understood; however, in recent years, research on this topic
has emerged. The relevance of this field has also been enhanced by the growing econ omic interest in
methanogen skills, particularly the production of methane from organic substrates. Management attention turned
to anaerobic wastes digestion because the volume and environmental impact reductions. Methanogenesis is the
biochemically limiting step of the process and the industrially intere sting phase because it connects to the amount
of biogas production. For this reason, several studies have evaluated the structure of methanogen communities
during this process. Currently, it is clear that the methanogen load and diversity dep end on the feeding
characteristics and the process conditions, but not much data is available. In this study, we apply a Real-Time
Polymerase Chain Reaction (RT-PCR) method based on mcrA target to evaluate, by speci fic probes, some
subgroups of methanogens during the mesophilic anaerobic digestion process fed wastewater sludge and organic
fraction of the municipal solid waste with two different pre-treatments. The obtained data showed the prevalence
of Methanomicrobiales and significantly positive correlation between Methanosarcina and Methanosaetae and the
biogas production rate (0.744 p < 0.01 and 0.641 p < 0.05). Methanosarcina detected levels ar e different during the
process after the two pre-treatment of the input materials (T-test p < 0.05). Moreover, a role as diagnostic tool
could be suggested in digestion optimisation.
Keywords: methanogen, anaerobic digestion, biogas production, Methanosarcina, Archaea communities
Introduction
Methanogenesis is a cha racteristic unique to the Archaea
(Woese 2007). Biological methane production involves 25
genes and numerous specific p roteins and coenzymes.
However, the gene number involved in the different
aspects of methane production is much higher (Galagan
et al. 2002). Methane can be produced through different
pathways, each of which has a different substrate. Among
the precursor organic molecules, we find CO
2
, forma te,
acetate an d methyl groups. The CO
2
,withH
2
as an elec-
tron donor, is reduced to m ethane via the hydrogeno-
trophic mechanism. A cetate is involved in the aceticlastic
pathway, and the methyl group acts as the starting
point of the methylotrophic pathway (Ferry 2010a, b).
Anaerobic digestors are one typical habitat, especially
for the following genera: Methanobacte rium, Met ha-
nothermobacter, Methanomicrobium, Methanoculleus,
Methanofollis, Methanospirillum, Met hanocorpusculum,
Methanosarcina and Methanosaeta (Liu and Whitman
2008). Two genera of Archaea, Methanosarcina and
Methanosaeta, are methane produci ng from acetate, and
this acetoclastic mechani sm produces higher proportions
of biogenic methane. These two genera are also the m ost
studied in recent years with the advent of the complete
genome sequencing of some strains (Barber et al. 2011).
Methanogenesis is the final step of the anaerobic diges-
tion process in the reactor. Other microorganisms, such
as hydrolytic acidogens and acetogens, are involved in
* Correspondence:
1
Department of Public Health and Microbiology, University of the Study of
Turin, via Santena 5 bis, 10126, Turin, Italy
Full list of author information is available at the end of the article
Traversi et al. AMB Express 2011, 1:28
/>© 2011 Traversi et al; licensee Springer. This is an Open Access article distributed under the terms of the Creative Commons Attribution
License ( which permits unrestricted use, distribution, and reproduction in any medium,
provided the original w ork is properly cited.
the previous s teps. These mic roorganisms prepare the
substrates for methanogenesis, which is co nsidered to be
the rate-limiting step (Rozzi and Remigi 2004). Anaerobic
digestion technologies vary throughout Europe. For
example, Germany has more than 4000 digesters (Dolan
et al. 2011) and there are numerous examples of inte-
grated management of waste and biomethane fuel pro-
duction to provide public transport in Sweden and
France (Lantz et al. 2007; Dolan et al. 2011). Recently,
other count ries have begun promo tional projects to
encourage anaerobic digest ion methodolog y (Dolan et al.
2011). In Italy, the number of anaerobic digestion reac-
tors is growing rapidly, especially farm-scale digesters
(De Baere 2006). T he fermentation of other organic
waste is also financially appraised (Schievano et al. 2009a;
Schievano et al. 2009b) in urban aggregation, where
organic waste, such as the organic fraction of municipal
solid organic waste (OFMSW) and wastewater sludge,
are p roduced (Tambone et al. 2009; Pognani et al. 2009).
To optimize the digestion benefits in terms of biogas pro-
duction, waste volume reduction and waste impact on
the environment, many research projects have b egun in
the past 10 years (Mata-Alvarez et al. 2011). The main
results concern the parameters controlling the anaerobic
process in technology configurations (Amani et al. 2010;
Boe et al. 2010). Moreover, with recent tec hnological an d
financial a chievements, the microbiological aspects of
anaerobic digestion have become relevant topics (Weiss
et al. 2008; Cardinali- Rezende et al. 2009). This attention
has led to the o ptimization of this process, which has
paid for itself. Among the many microo rganisms present
in the reactor, methanogens are the mo st sensitive; how-
ever, they are difficult to study in culture-based methods,
despite their critical role (Liu and Whitman 2008). In
recent years, culture-independent techniques have been
developed (Sekiguchi et al. 1998). These techniques are
based on phylogenetic markers such as the 16S rRNA or
methyl coenzyme M reductase (Mcr) genes (Nunoura et
al. 2008; Rastogi et al. 2008). The 16S rRNA gene is the
most widely used target for gene surveys (Nayak et al.
2009), whereas the Mcr is exclusive to the methanogens,
with the e xception of the methane-oxidising Archaea
(Knittel and Boetius 2009; Whitman et al. 2006). The pri-
mary aim of this work is to study methanogen popula-
tions in order to find a bioind icator of a productive
digestion process. To achieve this purpose, we deter-
mined, during anaerobic co-digestions, the abundance of
methanogen sub groups utilising Real-Time qualitative
PCR (RT -qPCR) with specific probes targeting the mc rA
gene (additional file 1).
Materials and methods
Two pilot reactors were fed pre-treated organic fractions
of municipal solid waste (OFMSW) and wastewater
sludge. The pre-treated methods used in this study
included a pressure-ext rusion (A) and a turbo mixing (B)
system. In method A, the separation was achieved through
a specially designed extruder press (280 bar) that separated
the input waste into two fractions: a dry one to be sent to
thermal conversion and a semi-solid one. The pressure-
extruded dry fraction of t he OFMSW was then diluted
with wastewater sludge. By contrast, method B (the turbo-
mixing system) was a wet process that works with a total
solids (TS) content lower than 8%. The mixing and treat-
ing actions are performed by a rotating plate with hum-
mers placed at the bottom of the turbo-mixing chamber
that, when rotating at high velocity, induce the suspension
to shear and crush. The particles weighing mo re than
water precipitate to the bottom, where they are picked up
by a screw and collected in an external vessel. The organic
fraction remains in suspension and is pumped into a sto-
rage basin after passing through a shredding pump. In this
case, OFMSW was directly turbo-mixed with wastewater
sludge (about 1:3 proportion). The main physical-chemical
characteristics of each kind of feed used in this work, just
before entrance into the reactor, are shown in Table 1.
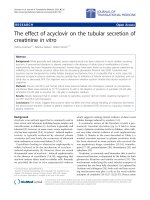
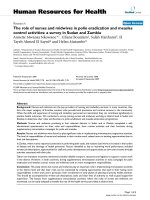
The anaerobic co-digestion tests were conducted using a
reactor with a total volume capacity of 15 L and a working
volume of 10 L (Figure 1). The temperature was mesophi-
lic and maintained at 38 ± 2°C using a water recirculation
system connected to a thermostatic valve. The biogas pro-
duced was collected and measured in a calibrated gas-
ometer and a mixing system containing the recirculated
biogas produced during the anaerobic dig estion process.
The reactors were equipped with two openings, one at the
top for feeding and one below to collect effluent discharge,
as showed on Figure 1. Every day, 500 ml of digestate was
removed from each reactor before adding another 500 ml
of fresh feed. The parameters analysed three times a week
in accordance with standard methods (APHA, 1995)
included pH, total solids (TS), total volatile solids (TVS),
alkalinity, a cidity, n itrogen (N), and total carbon. Daily
biogas production was measured using a liquid displace-
ment system t hat was connected to the digester. The
Table 1 Characteristics of the pretreated inputs with the
two different method used in the anaerobic co-digestion
processes
Pre-treatment A Pre-treatment B
pH 4.4 ± 0.3 6.0 ± 0.7
TS (%) 9.9 ± 0.7 4.6 ± 1.1
TVS (%) 8.7 ± 0.7 3.3 ± 1.1
TSV/TS (%) 86.8 ± 0.2 70.6 ± 4.9
C (%TS) 46.0 ± 0.9 37.0 ± 3.4
N (%TS) 3.1 ± 0.2 3.5 ± 0.3
C/N 15.2 ± 1.1 10.4 ± 1.5
Traversi et al. AMB Express 2011, 1:28
/>Page 2 of 7
biogas volume was correct ed using standard temperatu re
and pressure conditions. The biogas composition (in
terms of methane and carbo n d ioxide percentage) was
analysed once a week with a portable analyser and con-
firmed by gas chromatography analysis.
The reactors were operated at a constant organic load-
ing rate of 4 ,5 ± 0,3 kg TVS/m
3
per day when OFMSW
pressure-e xtruded was used and at an average organic
loading rate of 1,7 ± 0,5 kg TVS/m
3
per day when
OFMSW with pulper pretreatment was used. The tests
were run over two cons ecutive hydraulic retention times
of 20 days for each organic l oading rat e: one to e nsure
the highest replacement parts of the material inside the
reactors and the other to analyse the process in a stable
condition once all the feed had replaced the inoculum
content. The main control parameters for pretreatments
A and B are displayed in Table 2. Methanogen subgroups
were determined using samples with the h ighest biogas
production rate. These included 15 from pretreatment A
and 10 from pretreatment B. The samples were collected
during 2009 in 50 ml sterile tube and frozen at -20°C
until the extraction session.
DNA extraction and purification
The digestate al iquots were thawed at 4°C overnight and
cent rifuged at 4000 g for 10 minutes. Af ter removing the
supernatant, semi-dry aliquots were used for the follow-
ing steps. Total DNA was extracted from 0.25 g of this
particulate matter (residue humidity was equal to 31 ±
5%) using the PowerSoil DNA Isolation Kit following by
UltraClean Soil DNA Kit (MoBio Laboratories). The
average DNA quantity extracted was 3.51 ± 1.53 ng/μl,
and DNA quality was evaluated b y gel electrophoresis
before the chain reaction. Only samples with a DNA
quantity above 1 ng/μl and of sufficient quality were used
for the following step.
Figure 1 The pilot hardware description is illustrated. The same reactor, in different six-month fermentation sessions, with two different pre-
treated feedings was used during this research study.
Table 2 Main relevant evaluation parameters of the co-
digestion processes divided by pre-treatment method
Parameters Pre-treatment A Pre-treatment B
Daily biogas production (L/die) 27.08 ± 3.01 4.87 ± 2.46
Specific Biogas production
(m
3
/kg VS
added
)
0.64 ± 0.07 0.30 ± 0.13
TS reduction (%) 64.44 ± 7.57 31.67 ± 6.23
TSV reduction (%) 73.84 ± 5.87 38.13 ± 6.70
pH 7.36 ± 0.34 6.82 ± 0.52
Ac./Alc. ratio 0.37 ± 0.18 2.47 ± 2.41
CH
4
(%) 60.60 ± 2.90 57.50 ± 6.10
CO
2
(%) 37.70 ± 3.20 41.00 ± 6.44
Traversi et al. AMB Express 2011, 1:28
/>Page 3 of 7
qRT-PCR analysis
After DNA extraction and purification, different metha-
nogens were quantified using methanogen-specific short
primers for a mcrA sequence (Steinberg and Regan
2008) and synthesised by ThermoBiopolymer and pre-
viously described specific probes (Steinberg and Regan
2009).
Methanosarcina, Methanobacterium, Methanocorpus-
culum and Meth anosaeta were determined with the
respective following probes: msar, mrtA, mcp an d msa
(Steinberg and Regan 2009). The reaction s were con-
ducted in singleplex with a standard super mix (Bio-Rad
iQ™ Multiplex Powermix) using RT-PCR Chromo4
(Bio-Rad) and Opticon Monitor 3 Software. The reaction
conditions have been previously described (Steinberg and
Regan 2009, 2008).
Standard references were available only for the Metha-
nosarcina and Methanobacterium. The references were a
Methanosarcina acetivorans mcrA sequence and a Metha-
nobacterium thermoautotrophicum mrtA sequence. Each
plasmid is included in pCR21 vector (Invitrogen) supplied
by L.M. Steinberg and J.M. Regan, Pennsylvania State
University. These plasmids were amplified, transforming
Escherichia coli Top10 cells according to the manufac-
turer’s instructions. Transformed cells were selected on
LB agar with ampicillin, and the plasmid was extracted
using a plasmid DNA purification kit (NucleoSpin Plas-
mid, Macherey-Nagel). The standard curve had six points,
and it was calculated using the threshold cycle method
with the highest standard amplified being 2.3 ng of p las-
mid (~4.5*10
8
plasmid copies). Between each following
standard curve point, there is a 1:10 dilution. Standards
and samples were tested in triplicates. The triplicate
averages were accepted only if the coefficient of variation
was below 20%. Example of regression curves with correla-
tion coefficient and PCR efficiency were showed on Table
3. Resolution limit of the method was settled to 4.5*10
3
copies of mcrA. The PCR products a re about 500 base
pairs long.
For Methanocorpusculaceae and Methanosa etaceae,
there was no standard reference available; therefore,
quantification could onl y be considered between samples
in the same analytical session. The efficiency of the PCR
reactions was determined wi th serial 1:10 dilution of a
sample and are showed on Table 3. The results for these
groups were expressed as cycle threshold (Ct) or as 1/Ct,
where relative a bundance was discussed for each rea c-
tion, instead of real quantification, a s for the Methano-
sarcinaeae and Methanobacterium,whereresultscould
be expressed as gene copies per microliter of DNA
extract.
We used 2 μlofa1:5dilutionofDNAextractsfor
amplification. This quantity of sample was evaluated as
the best among various tested quantities for obtaining
quantificati ons within the standard curve range and with
acceptable PCR efficiency. The 1:5 dilution is sufficient to
avoid the effect of inhibition substances present in this
kind of sample. Only a percentage of the 25 total samples
were acceptable as detailed on the table 3, and values
ranged by methanogen group from 4 to 88. In many sam-
ples, evaluation of the Ct was n ot determinable ( above
40).
To evaluate precision, we began with the same two
samples re-extracted 10-fold. The results of the succes-
sive PCR-determination showed a variation coefficient
below6%formsar amplification and below 15% for
msa, mrtA and mcp amplifications.
Statistics
Statistical analyses were performed using the SPSS Pack-
age, version 17.0, for Windows. A Spearman correlation
coefficient was used to assess the relationships between
variables. A T- test o f indepe ndent v ariables was used to
test mean evaluations. The differences and correlations
were considered significant at p < 0.05 and highly signifi-
cant at p < 0.01.
Results
The detected level of va rious methanogen groups is dis-
played in Table 4. Groups varied largely in quantity dur-
ing the digestion processes and were often not presen t at
all. Methanosarcina was not detected in some samples,
this happened when the pH was around 6.5 and the pro-
duction rate was lower than 0.5 m
3
/kg VS
added
. The num-
ber of msar copies in the sample can be explained by the
relevant level of acetate, the substrate of this group, and
the high biogas production rate recorded from the reac-
tor. As described in the literature, an anaerobic digester
Table 3 qRT-PCR probe and reaction descriptions
Target group Probe name target Example of regression curve r
2
PCR efficiency (%) Acceptable data (%)
Methanosarcina msar y = -0.2547x +11.34 0.997 80 75
Methanobacteriaceae mrtA y = -0.2691x+12.21 0.995 86 4
Methanocorpusculaceae mcp y = -0.2627x+12.38 0.987 83 88
Methanosaetaceae msa y = -0.2380x+10.27 0.943 73 52
There is a standard reference curve only for the Methanosarcina and Methanobatecteriaceae, making it possible to establish the gene copies in the extracted
DNA. The last column indicates the percentage of determinable sample on the total 25 tested samples.
Traversi et al. AMB Express 2011, 1:28
/>Page 4 of 7
typically contain s more than 10
12
cells/μl with an average
of 10
8
methanogens (Amani et al. 2010). Methanobacter-
iaceae mrtA resulted undetectable nearly in all the sam-
ples (table 3) while the Methanomicrobiales resulted
prevalent, in particular acetoclastic methanogens (Metha-
nosarcinaandMethanosaeta). Furtherm ore, th eir p re-
sence increased along with the specific biogas production
rate (Table 5). Methanocorpusculaceae seemed to have a
similar behaviour as showed in table 5 and their presence
is highly correlated both to Methanosarcina and Metha-
nosaeta. Methanosarcina was significantly correlated
with all the control parameters (positively with the pH,
specific biogas production and % TSV; negatively with
the acidity/alkalinity ratio) as showed on table 4. With
increases in the TVS, there was also an increase in
Methanocorpusculaceae and Methanosaetaceae. A signif-
icant, positive correlation with the pH was also observed
for the other acetoclastic group, Methanosaetaceae
(Table 4).
The significant correlations among the various metha-
nogen groups and control parameters are displayed on
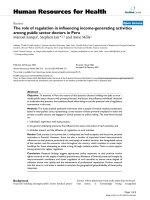
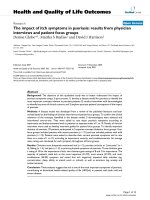
Table5.InFigure2,theMethanosarcina loads were dif-
ferentiated in relation to the pre-treatment of the input
material (A and B). The difference between the mean of
the Methanosarcina levels, during the digestion with the
pressure-extrusion input, is significantly higher than the
turbo-mixing one (1.68E7 vs 2.55E5, F = 6.821, p = 0.018).
Moreover the figure 2 illustrates as all the samples, col-
lected during the process conducing after pressure-estru-
sion pre-treatment, showed a biogas production rate
above or near to 0.6 m
3
/kg TSV
added
. This cut-off is a sui-
table division between optimal and suboptimal digestion
conditions as has b een documented in the literature
(Amani et al. 2010).
Discussion
Anaero bic digest ion is a mong the most complicated and
unknown biological processes in the environment
(Schin k 1997). Different aspects attra ct operational, che-
mical and biological criticisms. M oreover, these aspects
are strictly interconnected with one another. A wide
number of papers in this field ha ve been published in
recent years (Khalid et al. 2011). Most of these studies,
however, didn’t include methanogens characterization or
they have been based on a metagenomic approach in
which a small subunit of ribosomal RNA was used
(Pycke et al. 2011; Supaphol et al. 2011). Methanogen
studies using the mcrA-based method have become more
common in recent years (Narihiro and Sekiguchi 2011).
Over 90% of the detected methanogenic Archaea in
the mesophilic reactor fed swine slurry belonged to the
hydrogenotrophic methanogens. These were predomi-
nantly Methanobacteriales followed by Methanomicro-
biales (Zhu et al. 2011). On the other hands always in
mesophilic biogas plant but fed with cattle manure, 84%
of all detected methanogens were affiliated with the
Methanomicrobiales, whereas only 14% belonged to the
Methanosarcinales and 2% to the Methanobacteriales
(Bergmann et al. 2010a, b) and in other plant always
running on cattle manure, the methanogen community
presented the following composition: 41.7% of clones
were affiliated with Methanomicrobiales,30%with
Methanosarcinales, and 19% with Methanobacteriales; at
temperatures lower than 25°C, the Methanomicrobiales
became most prevalent (> 90%) (Rastogi et al. 2008).
In reactor fed leachate and OFMSW, various orders of
hydrogenotrophic methanogens belonging to Methano-
microbiales and Methanobacteriales were identified
(Cardinali-Rezende et al. 2009). However, during meso-
philic digestion of wastewater sludg e, Methanosarcina
and Methanosaeta were most abundant, comprising up
to 90% of the total Archaea present or more (Narihiro
et al. 2009; Das et al. 2011). This data confirms the
results of our work and the ability of Methanosarcina
species t o form multicellular aggregates that may resist
inhibitions in the reactor (Vavilin et al. 2008).
Table 4 Descriptive analysis of the acceptable data by each probe
Target (measure unit) Min Max Mean Dev. std.
Methanosarcina (gene copies/μl) 4.77E+04 6.03E+07 1.19E+07 1.51E+07
Methanobacteriaceae (gene copies/μl) 1.52E+05 1.52E+05 1.52E+05 -
Methanocorpusculaceae (1/Ct) 2.52E-02 3.98E-02 2.966E-02 3.6E-03
Methanosaetaceae (1/Ct) 2.56E-02 3.74E-02 2.969E-02 3.7E-03
Table 5 Spearman’s rho correlation between the detected methanogen groups and the monitored control parameters
pH Ac/Alc ratio % TVS added Biogas production (m
3
/kg VS
added
) msar (gene copies/μl) msa (1/Ct)
msar (gene copies/μl) 0.630** -0.589** 0.744** 0.673** 1 0.782**
msa (1/Ct) 0.847** - 0.641* 0.576* 0.782** 1
mcp (1/Ct) - - 0.449* - 0.719** 0.868**
Significant correlation at p < 0.05 is identified with a single asterisk while highly significant at p < 0.01 with a double asterisk. The hyphen is introduced when no
significant correlations (n.c.) were observed.
Traversi et al. AMB Express 2011, 1:28
/>Page 5 of 7
Despite the data variability such bio-molecular approach
can improve the available knowledge of anaerobic diges-
tion, as demonstrated in this work, the biogas production
efficiency i s significant ly and positively correlated to two
methanogen groups (Methanosarcina and Methanosaeta-
ceae). Most importantly, this method can represent a way
to introduce useful bioindicators into the reactors for early
diagnosi s of an unba lance or a sufferance situation in the
micro biologic community. Establishing an efficiency cut-
off during the anaerobic digestion process - optimal pro-
duction that for our s et up is around 0.6 C H
4
m
3
/kg
SV
added
- it makes possible to observe a role for certain
groups of methanogens, primarily the Methanosarcina as
useful Archaea bioindicators in the digestion process. On
the other ha nds the produced data shows a clear advan-
tage in the pressure-extrusion respect to turbo-mixing
pre-treatment as production rate moreover also the cost
of the two pre-treatment plants are very different, against
the pressure-extrusion. After a validation process with dif-
ferent digestion processes, the definition of a threshold of
alarm seems to be possible.
Finally, it is critical that this kind of approach be uti-
lised and that knowledge in this scientific field be
increased. The methanogen diversity in the reactor is
widely influenced by the feeding. During anaerobic diges-
tion in which input is mainly cattle manure, the presence
of hydrogenotrop h methanogens is favoured. Ho wever,
when other feedings are involved, as in this experimental
activity, the methanogen community structure differs in
terms of the prevalence of Methanosarcineae such as
Methanosarcina and Methanosaeta. This family presents
a prev alent acetoclastic methane production. A closer
examination is needed for substrate and product analysis.
A profile of the substrates, such as butyrate, propionate,
H
2
and CO
2
, could be useful in understanding the micro-
biologic dynamics and the consequent methanogen
modulations.
Additional material
Additional file 1: Graphical abstract. During mesophilic anaerobic co-
digestion, biomolecular methanogen determinants in the reactor vary
among groups in different biochemical pathways, indicating that
variation in biogas yield suppl ies early bioindicators of methane
production.
Acknowledgements
The authors wish to thank the Piedmont Region and ISPESL for funding
support. The work was part of a large project called DigestedEnergy, which
was founded in response to the 2006 call for pre-competitive development
and industrial research. It includes ten different public and private
organisations. Special acknowledgments are due to L. Steinberg and J.
Regan for the plasmid standard supply. Finally the authors thank all the
numerous collaborators employed in each of the involved institutions:
Università degli Studi del Piemonte Orientale “A. Avogadro ”, Politecnico di
Torino, SMAT S.p.A., Amiat S.p.A., Ansaldo FC S.p.A., Acsel Susa S.p.A., VM-
press s.r.l., Federsviluppo, E.R.A.P.R.A Piemonte, and Università degli Sudi di
Torino.
Author details
1
Department of Public Health and Microbiology, University of the Study of
Turin, via Santena 5 bis, 10126, Turin, Italy
2
SMAT S.p.A., corso XI Febbraio 14,
10152, Turin, Italy
3
ISPESL, via Urbana 167, 00184, Rome, Italy
Competing interests
The authors declare that they have no competing interests.
Received: 6 September 2011 Accepted: 7 October 2011
Published: 7 October 2011
Figure 2 The quant ific at ion o f Methanosarcina during the two monitored processes in relationtospecificbiogasproductionrate
subdivided by pre-treatment.
Traversi et al. AMB Express 2011, 1:28
/>Page 6 of 7
References
Amani T, Nosrati M, Sreekrishnan TR (2010) Anaerobic digestion from the
viewpoint of microbiological, chemical, and operational aspects - a review.
Environ Rev 18:255–278. doi:10.1139/A10-011.
Barber RD, Zhang L, Harnack M, Olson MV, Kaul R, Ingram-Smith C, Smith KS
(2011) Complete genome sequence of Methanosaeta concilii, a specialist in
aceticlastic methanogenesis. J Bacteriol 193(14):3668–3669. doi:10.1128/
JB.05031-11.
Bergmann I, Mundt K, Sontag M, Baumstark I, Nettmann E, Klocke M (2010a)
Influence of DNA isolation on Q-PCR-based quantification of methanogenic
Archaea in biogas fermenters. Sys Appl Microbiol 33(2):78–84. doi:10.1016/j.
syapm.2009.11.004.
Bergmann I, Nettmann E, Mundt K, Klocke M (2010b) Determination of
methanogenic Archaea abundance in a mesophilic biogas plant based on
16S rRNA gene sequence analysis. Can J Microbiol 56(5):440–444.
doi:10.1139/W10-021.
Boe K, Batstone DJ, Steyer JP, Angelidaki I (2010) State indicators for monitoring
the anaerobic digestion process. Water Res 44(20):5973–5980. doi:10.1016/j.
watres.2010.07.043.
Cardinali-Rezende J, Debarry RB, Colturato LFDB, Carneiro EV, Chartone-Souza E,
Nascimento AMA (2009) Molecular identification and dynamics of microbial
communities in reactor treating organic household waste. Appl Microbiol
Biot 84(4):777–789. doi:10.1007/s00253-009-2071-z.
Das KC, Garcia SL, Jangid K, Whitman WB (2011) Transition of microbial
communities during the adaption to anaerobic digestion of carrot waste.
Bioresource Technol 102(15):7249–7256. doi:10.1016/j.biortech.2011.04.098.
De Baere L (2006) Will anaerobic digestion of solid waste survive in the future?
Water Sci Technol 53(8):187–194. doi:10.2166/wst.2006.249.
Dolan T, Cook MB, Angus AJ (2011) Financial appraisal of wet mesophilic AD
technology as a renewable energy and waste management technology. Sci
Total Environ 409(13):2460–2466. doi:10.1016/j.scitotenv.2011.03.011.
Ferry JG (2010a) The chemical biology of methanogenesis. Planet Space Sci
58(14-15):1775–1783. doi:10.1016/j.pss.2010.08.014.
Ferry JG (2010b) CO in methanogenesis. Ann Microbiol 60(1):1–12. doi:10.1007/
s13213-009-0008-5.
Galagan JE, Nusbaum C, Roy A, Endrizzi MG, Macdonald P, FitzHugh W, Calvo S,
Engels R, Smirnov S, Atnoor D, Brown A, Allen N, Naylor J, Stange-
Thomann N, DeArellano K, Johnson R, Linton L, McEwan P, McKernan K,
Talamas J, Tirrell A, Ye WJ, Zimmer A, Barber RD, Cann I, Graham DE,
Grahame DA, Guss AM, Hedderich R, Ingram-Smith C, Kuettner HC,
Krzycki JA, Leigh JA, Li WX, Liu JF, Mukhopadhyay B, Reeve JN, Smith K,
Springer TA, Umayam LA, White O, White RH, de Macario EC, Ferry JG,
Jarrell KF, Jing H, Macario AJL, Paulsen I, Pritchett M, Sowers KR, Swanson RV,
Zinder SH, Lander E, Metcalf WW, Birren B (2002) The genome of M-
acetivorans reveals extensive metabolic and physiological diversity. Genome
Res 12(4):532–542. doi:10.1101/gr.223902.
Khalid A, Arshad M, Anjum M, Mahmood T, Dawson L (2011) The anaerobic
digestion of solid organic waste. Waste Manag 31(8):1737–1744. doi:10.1016/
j.wasman.2011.03.021.
Knittel K, Boetius A (2009) Anaerobic Oxidation of Methane: Progress with an
Unknown Process. Annu Rev Microbiol 63:311–334. doi:10.1146/annurev.
micro.61.080706.093130.
Lantz M, Svensson M, Bjornsson L, Borjesson P (2007) The prospects for an
expansion of biogas systems in Sweden - Incentives, barriers and potentials.
Energ Policy 35(3):1830–1843. doi:10.1016/j.enpol.2006.05.017.
Liu YC, Whitman WB (2008) Metabolic, phylogenetic, and ecological diversity of
the methanogenic archaea. Ann Ny Acad Sci 1125:171–189. doi:10.1196/
annals.1419.019.
Mata-Alvarez J, Dosta J, Mace S, Astals S (2011) Codigestion of solid wastes: A
review of its uses and perspectives including modeling. Crit Rev Biotechnol
31(2):99–111. doi:10.3109/07388551.2010.525496.
Narihiro T, Sekiguchi Y (2011) Oligonucleotide primers, probes and molecular
methods for the environmental monitoring of methanogenic archaea.
Microb Biotechno l4(5):585–602
Narihiro T, Terada T, Ohashi A, Wu JH, Liu WT, Araki N, Kamagata Y, Nakamura K,
Sekiguchi Y (2009) Quantitative detection of culturable methanogenic
archaea abundance in anaerobic treatment systems using the sequence-
specific rRNA cleavage method. Isme Journal 3(5):522–535. doi:10.1038/
ismej.2009.4.
Nayak BS, Levine AD, Cardoso A, Harwood VJ (2009) Microbial population
dynamics in laboratory-scale solid waste bioreactors in the presence or
absence of biosolids. J Appl Microbiol 107(4):1330–1339. doi:10.1111/j.1365-
2672.2009.04319.x.
Nunoura T, Oida H, Miyazaki J, Miyashita A, Imachi H, Takai K (2008)
Quantification of mcrA by fluorescent PCR in methanogenic and
methanotrophic microbial communities. Fems Microbiol Ecol 64(2):240–
247.
doi:10.1111/j.1574-6941.2008.00451.x.
Pognani M, D’Imporzano G, Scaglia B, Adani F (2009) Substituting energy crops
with organic fraction of municipal solid waste for biogas production at farm
level: A full-scale plant study. Process Biochem 44(8):817–821. doi:10.1016/j.
procbio.2009.03.014.
Pycke BF, Etchebehere C, Van de Caveye P, Negroni A, Verstraete W, Boon N
(2011) A time-course analysis of four full-scale anaerobic digesters in relation
to the dynamics of change of their microbial communities. Water Sci
Technol 63(4):769–775. doi:10.2166/wst.2011.307.
Rastogi G, Ranade DR, Yeole TY, Patole MS, Shouche YS (2008) Investigation of
methanogen population structure in biogas reactor by molecular
characterization of methyl-coenzyme M reductase A (mcrA) genes.
Bioresource Technol 99(13):5317–5326. doi:10.1016/j.biortech.2007.11.024.
Rozzi A, Remigi E (2004) Methods of assessing microbial activity and inhibition
under anaerobic contitions: a literature review. Rev Environ Sci Biotechnol
3:93–115. doi:10.1007/s11157-004-5762-z.
Schievano A, D’Imporzano G, Adani F (2009a) Substituting energy crops with
organic wastes and agro-industrial residues for biogas production. J Environ
Manage 90(8):2537–2541. doi:10.1016/j.jenvman.2009.01.013.
Schievano A, Scaglia B, D’Imporzano G, Malagutti L, Gozzi A, Adani F (2009b)
Prediction of biogas potentials using quick laboratory analyses: Upgrading
previous models for application to heterogeneous organic matrices.
Bioresource Technol 100(23):5777–5782. doi:10.1016/j.biortech.2009.05.075.
Schink B (1997) Energetics of syntrophic cooperation in methanogenic
degradation. Microbiol Mol Biol R 61(2):262–280
Sekiguchi Y, Kamagata Y, Syutsubo K, Ohashi A, Harada H, Nakamura K (1998)
Phylogenetic diversity of mesophilic and thermophilic granular sludges
determined by 16S rRNA gene analysis. Microbiol-Sgm 144:2655–2665.
doi:10.1099/00221287-144-9-2655.
Steinberg LM, Regan JM (2008) Phylogenetic Comparison of the Methanogenic
Communities from an Acidic, Oligotrophic Fen and an Anaerobic Digester
Treating Municipal Wastewater Sludge. Appl Environ Microb
74(21):6663–6671. doi:10.1128/AEM.00553-08.
Steinberg LM, Regan JM (2009) mcrA-Targeted Real-Time Quantitative PCR
Method To Examine Methanogen Communities. Appl Environ Microb
75(13):4435–4442. doi:10.1128/AEM.02858-08.
Supaphol S, Jenkins SN, Intomo P, Waite IS, O’Donnell AG (2011) Microbial
community dynamics in mesophilic anaerobic co-digestion of mixed waste.
Bioresource Technol 102(5):4021–4027. doi:10.1016/j.biortech.2010.11.124.
Tambone F, Genevini P, D’Imporzano G, Adani F (2009) Assessing amendment
properties of digestate by studying the organic matter composition and the
degree of biological stability during the anaerobic digestion of the organic
fraction of MSW. Bioresource Technol 100(12):3140–3142. doi:10.1016/j.
biortech.2009.02.012.
Vavilin VA, Qu X, Mazeas L, Lemunier M, Duquennoi C, He PJ, Bouchez T (2008)
Methanosarcina as the dominant aceticlastic methanogens during
mesophilic anaerobic digestion of putrescible waste. Antonie Van
Leeuwenhoek Int J Gen Mol Microbiol 94(4):593–605. doi:10.1007/s10482-
008-9279-2.
Weiss A, Jerome V, Freitag R, Mayer HK (2008) Diversity of the resident
microbiota in a thermophilic municipal biogas plant. Appl Microbiol Biot
81(1):163–173. doi:10.1007/s00253-008-1717-6.
Whitman WB, Bowen TL, Boone DR (2006) The Methanogenic Bacteria.
Prokaryotes 3(Chapter 9):165–207
Woese CR (2007) The Archaea: an invitation to evolution. Archaea: molecular and
cellular biology. Washington: ASM press
Zhu CG, Zhang JY, Tang YP, Xu ZK, Song RT (2011) Diversity of methanogenic
archaea in a biogas reactor fed with swine feces as the mono-substrate by
mcrA analysis. Microbiol Res 166(1):27–35. doi:10.1016/j.micres.2010.01.004.
doi:10.1186/2191-0855-1-28
Cite this article as: Traversi et al.: The role of different methanogen
groups evaluated by Real-Time qPCR as high-effi ciency bioindicators of
wet anaerobic co-digestion of organic waste. AMB Express 2011 1:28.
Traversi et al. AMB Express 2011, 1:28
/>Page 7 of 7