Báo cáo hóa học: " Spatial and temporal dynamics of cellulose degradation and biofilm formation by Caldicellulosiruptor obsidiansis and Clostridium thermocellum" ppt
Bạn đang xem bản rút gọn của tài liệu. Xem và tải ngay bản đầy đủ của tài liệu tại đây (7.45 MB, 10 trang )
ORIGINAL Open Access
Spatial and temporal dynamics of cellulose
degradation and biofilm formation by
Caldicellulosiruptor obsidiansis and Clostridium
thermocellum
Zhi-Wu Wang
1
, Seung-Hwan Lee
2
, James G Elkins
1
and Jennifer L Morrell-Falvey
1*
Abstract
Cellulose degradation is one of the major bottlenecks of a consolidated bioprocess that employs cellulolytic
bacterial cells as catalysts to produce biofuels from cellulosic biomass. In this study, we investigated the spatial and
temporal dynamics of cellulose degradation by Caldicellulosiruptfor obsidiansis, which does not produce
cellulosomes, and Clostridium thermocellum, which does produce cellulosomes. Results showed that the
degradation of either regenerated or natural cellulose was synchronized with biofilm formation, a process
characterized by the formation and fusion of numerous crater-like depressions on the cellulose surface. In addition,
the dynamics of biofilm formation were similar in both bacteria, regardless of cellulosome production. Only the
areas of cellulose surface colonized by microbes were significantly degraded, highlighting the essential role of the
cellulolytic biofilm in cellulose utilization. After initial attachment, the microbial biofilm structure remained thin,
uniform and dense throughout the experiment. A cellular automaton model, constructed under the assumption
that the attached cells divide and produce daughter cells that contribute to the hydrolysis of the adjacent
cellulose, can largely simulate the observed process of biofilm formation and cellulose degradation. This study
presents a model, based on direct observation, correlating cellulolytic biofilm formation with cellulose degradation.
Keywords: biofilm, thermophile, cellulosome, cellulose
Introduction
Biofuels provide a number of environmental advantages
over fossil fuels, especially in greenhouse gas reduction
(Hromadko et al. 2010). Cellulosi c biomass is often
recognized as one of the best resources for biofuel pro-
duction based on its cost, abundance, and cleanliness
(Lynd et al. 2008). The hydrolysis of cellulosic biomass
into soluble sugar, however, is re garded as a rate-limit ing
step in cellulosic biofuel production (Lynd et al. 2002).
Consolidated bioprocessing (CPB) which utilizes cellulo-
lytic bacteria to directly convert bioma ss into biofuel has
the potential to cost significantly less compared to meth-
ods using enzymes (Lynd et al. 2008). Despite numerous
studies showing biofilm involvement in cellulosic
biomass hydrolysis (Cheng et al. 1984; Mooney and
Goodwin 1991; Weimer et al. 1993; Miron et al. 2001;
Burrell et al. 2004; Song et al. 2005, Lynd et al. 2006), few
details are known regarding the dynamic interaction
between biofilm formation and cellulose degradation.
Some cellulolytic bacteria, such as Clostridium,produce
cellulosomes which are protein complexes that facilitate
cell attachment to cellulose and provide docking sites for
extracellular enzymes involved in biomass hydrolysis
(Miron et al. 2001). Yet, not all cellulolytic bacteria pro-
duce cellulosomes and very little is known regarding the
mechanisms by which these non-cellulosome producing
microbes attach to and degrade cellulose (Lynd et al.
2006). Caldicellulosiruptor obsidiansis is an anaerobic
non-cellulosome produc ing bacterium isolated from Yel-
lowstone National Park with an optimal temperature for
growth at 78°C (Hamilton-Brehm et al. 2009). This
organism hydrolyzes both cellulose and hemicellulose
* Correspondence:
1
BioEnergy Science Center, Biosciences Division, Oak Ridge National
Laboratory, Oak Ridge, TN 37831, USA
Full list of author information is available at the end of the article
Wang et al. AMB Express 2011, 1:30
/>© 2011 Wang et al; licensee Springer. This is an O pen Access article dis tributed under the terms of the Creative Commons Attribution
License ( which permits unre stricted use, distribution, and reproduction in any medium,
provided the original work is properly cited.
while fermenting hexose and pentose sugars to produce
hydrogen, organic acids and ethanol. In this study, the
temporal and spatial interactions of C. obsidiansis with
cellulose were visualized and compared to C. thermocel-
lum. This study was undertaken with the goal of provid-
ing insights into the mechanisms of microbial cellulose
utilization, especially in high temperature environments.
Materials and methods
Microbial growth
Commercially available regenerated cellulose membranes
with 0.2 μm pore size (Whatman RC58, Maidstone,
Kent, UK) or flat-surface cellulose membrane made of
natural cotton linter nanofiber (Celish KY-100G, Daicel
Chemical Industries, LTD, Osaka, Japan) were used as
cellulose substrates in this study. The linter cellulose
was microfibrillated by high-pressure homogenization
and showed nanoscopic morpho logy, with a crystallini ty
index (Segal et al., 1959) of 82%.
Identical chads with a mean diameter of 7 .37 ± 0.03 mm
were stamped from both types of cellulose membrane and
used as the sole carbon source to support the growth of
C. obsidiansis (ATCC BAA2073) or C. thermocellum
(ATCC27405) in liquid culture. Serum bottles, each con-
taining one cellulose chad and 50 ml nutrient media, were
inoculated with 2 × 10
5
ml
-1
cells and incubated under
anaerobic conditions at 75°C for C. obsidiansis and 60°C
for C. thermocellum with moderate shaking (100 rpm) and
nitrogen gas headspace. Nutrient media for C. obsidiansis
was prepared according to Hamilton-Brehm et al. (2009),
with the exception that no yeast extract was added. Nutri-
ent media for C. thermocellum was same as that used by
Zhang and Lynd (2005). This experimental design gives an
equ ivalent initial subst rate concentrati on of 0.03 g cellu-
lose L
-1
. Replicate serum bottles were prepared and 3 bot-
tles were harvested every four hours for analysis.
Microscopy
Sampled cellulose chads were stained with Syto9 (Invi-
trogen, Carlsbad, CA) to visualize the distrib ution of
bacterial cells on the cellulose cha d surface using confo-
cal laser scanning microsc opes (Leica TCS SP2, Ma n-
nheim, Germany or Zeiss LSM 710, Jena, Germany).
The m ean thickness of each regenerated cellulose chad
was determined by measuring the change in the Z-
dimension by focusing the confocal microscope on the
top and bottom of the chad at 10 randomly chosen
positions. The planktonic cell count was determined
using a Thoma cell counting chamber (Blaubrand,
Wertheim, Germany) and an Axioskop2 Plus micro-
scope (Zeiss, Thornwood, NY, USA) with phase contrast
illumination. ImageJ software (Version 1.42q, NIH,
Bethesda, MD) was used for image analyais. The ImageJ
3D viewer plug-ins were installed to reconstruct the bio-
film in three dimensions.
Biofilm cell density determination
The cell density in the biofilm was determined using the
object counter3D plug-in installed in ImageJ. Briefly, the
software counts the number of objects scattered in a 3D
space, which can be converte d to cell density within the
space volume. For this study, the number of objects
within five randomly selected biofilm internal subspaces
with dimension of 30 × 30 × 30 μm
3
were averaged to
calculate cell density. For comparison with this study, the
minimum cell density of biofilms reported in the litera-
ture was estimated using the following calculation.
Because most published images show only monolayer
biofilms, the cell density per area, namely r
a
(cells cm
-2
),
was first calculated by counting the number of cells in a
given area of the published image and converting this
result to the minimum volumetric density, namely r
v
(cells cm
-3
). To do this, a maximum biofilm thickness
can be estimat ed from the mean intercellular distance (d)
calculated from,
d=
1
√
ρ
a
(1)
And then, the minimum volumetric biofilm cells den-
sity can be approximated by,
ρ
v
=
ρ
a
d
(2)
Results
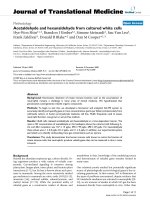
Temporal and spatial dynamics of C. obsidiansis biofilm
formation
To visualize the process of biofilm formation by C. obsi-
diansis on a model cellulose substrat e, cells were grown
in serum bottles containing a regenerated cellulose chad
as the sole carbon source. Based on imaging data, the
dynamic process of biofilm formation and growth can
be differentiated into multiple steps, including: i) initial
cell attachment to the substrate; ii) cell growth and divi-
sion and iii) inverted colony formation; iv) crater-like
depression formation due to degradation of the cellulose
substrate by the microbial colony; v) fusion of the
depressions due to continued growth and substrate
degradation, leading to vi) a biofilm of uniform
thickness.
Initial microbial attachment and growth
Initial attachment by C. obsidiansis to the cellulose sub-
strate occurred during the first 16 h of incubation in the
serum bottles. By 8 h after inoculation, single cells were
Wang et al. AMB Express 2011, 1:30
/>Page 2 of 10
observed randomly attaching to the cellulose surface
(Figure 1b). These cells a ppeared to grow by cell divi-
sion on the surface, forming small c lusters of cells
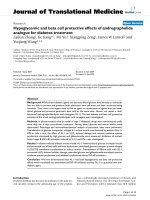
(Figure 1c). A three-dimensional reconstruction of one
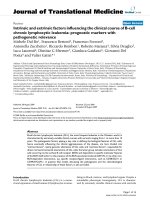
representative cluster is shown in Figure 2a. These data
suggest that the cells are likely distributed as a mono-
layer on the cellulose surface. This observation is
supported by a cross-sectional view of the cluster
(Figure 3a). Intere stingly, it appears that many of the
cells are positioned vertically on the cellulose surface
(Figures 2a and 3a). Whether this positioning is due to
physical crowding of the cells on the surface or is the
result of a specific attachment mechanism is the f ocus
of ongoing studies.
Inverted colony formation
By 24 h after inoculation, the formation of C. obsidiansis
colonies was observed on the cellulose substrate (Figure
1d). The diamet ers of the colonies varied in size. Three-
dimensional reconstructions of co lony morpholo gy
revealed that these colonies were inverted; that is, the
colonies were growing into the cellulose substrate rather
than on the surface (Figure 2b). This inverted colony
morphology can be seen clearly in the cross-sectional
view (Figure 3b, Additional file 1). Measurements taken
from this pe rspective indicate that the radius of the col-
ony is larger than its height, with the width at 35 μm
but the maximum depth at 10 μm. The formation of
inverted colonies is likely due to cellulose hydrolysis by
C. obsidiansis.
Formation and fusion of crater-like depressions
As the experiment continued, the dimensions of the
colonies continued to grow. By 44 h after inoculation,
large depressions about 50 μm in wid th were obse rved
on the cellulose substrate with adjacent depressions
beginning to fuse (Figure 1e). Smaller depressions were
also seen at this stage ( Figure 1e). Three-dimensional
reconstructions indicated depressions in the cellulose
substrate were lined by C. obsidiansis cells (Figure 2c,
Additional file 2). Measurements from a cross-sectional
view indicate that the maximum biofilm thickness in the
depression was about 10 μm (Figure 3c). By 48 h, multi-
ple individual depressions had fused (Figure 1f) and by
56 h, the cellulose substrate was dominated by larg e,
irregular (approximately 200 μm) depressions i nto the
substratum (Figure 1g). From this point on, individual
depressions could not be distinguished and the surface
of the cellulose substrate was covered with a thin bio-
film (Figure 1h). A three dimensional reconstruction of
the cellulose substrate after 68 h incubation shows a
rather uniform surface without any prominent cavities
or depressions as seen in earlier time points (Figure 2d).
The cross-sectional view shows that the biofilm thick-
ness remains constant at approximately 10 μmafter
68 h growth on the substrate (Figure 3d). At this point,
it appears that a dynamic equilibrium was reached
between biofilm growth and detachment, stabilizing the
biofilm thickness at a constant value. Moreover, the cell
density measured in this mature biofilm is about 1.69 ×
10
11
cells cm
-3
, which is much greater than the cell
Figure 1 Distribution of C. obsidiansis cells on a cellulose surface after incubation for a) 0 h, b) 8 h, c) 16 h, d) 24 h, e) 44 h, f) 48 h, g)
56 h and h) 68 h.
Wang et al. AMB Express 2011, 1:30
/>Page 3 of 10
density typically found in a biofilm grown on a soluble
substrate (Zhang and Bishop 1994; Ito et al. 2002).
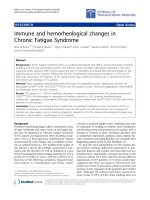
Cellulose hydrolysis
It should be emphasized that the regenerated cellulose
chad provides the sole carbon source for C. obsidiansis
growth in this study. Hence, the hydrolysis of the cellulose
chad occurs concurrently with biof ilm formation. The
change in chad thickness can be used as an indicator of
cellulose hydrolysis and was measured throughout the
experiment. The first measurable reduction in chad
thickness was observed after 24 h incubation, which corre-
sponds to the formation of inverted colonies (Figure 4a).
From this point on, the cellulose chad thickness decreased
at a nearly constant rate (Figure 4a). After 72 h incubation,
the cellulose chad displayed significant degradation with
irregular holes being visib le (Figure 4c) in com parison
with the new chad at the 0 h time point (Figu re 4b). Our
previous work indicated that a C. obsidiansis biofilm grow-
ing on cellulose generates more hydrolysate than it can
utilize in order to establish an intra-biofilm substrate
Figure 2 Three-dimensional reconstruction of C. obsidiansis biofilm structure formed on cellulose surface after a) 16 h, b) 24 h, c) 44 h
and d) 68 h incubation.
Wang et al. AMB Express 2011, 1:30
/>Page 4 of 10
Figure 3 Cross-sectional view of C. obs idia nsis biofilm formed on a cellulose surface after a) 16 h, b) 24 h, c) 44 h and d) 68 h
incubation.
0 20406080
0
50
100
150
200
0
5.0×10
06
1.0×10
07
1.5×10
07
2.0×10
07
2.5×10
07
Time (h)
Cellulose chad thickness (μm)
Planktonic cells (ml
-1
)
b
ͳǤͷ
c
a
Figure 4 Cellulose hydrolysis, a) reduction of cellulose chad thickness (’black circle’ ) and measurement of planktonic cell
concentration (’white circle’) over time; and the cellulose chad morphology b) before and c) after 72 h incubation.
Wang et al. AMB Express 2011, 1:30
/>Page 5 of 10
concentration high enough to support growth (Wang et al.
2011). The excess hydrolysate diffuses through the biofilm
and is released into the bulk liquid where it can support
planktonic cell growth (Wang et al. 2011).
Biofilm formation on linter cellulose
Although regenerated cellulose chads provide an ideal
platform to image the process of biofilm formation and
cellulose utilization (Figures 1, 2 and 3), it was unknown
whether biofilm formation and degradation on natural
cellulose occurred in the same manner. To address this
question, a similar experiment was performed using lin-
ter cellulose, which is a natural cotton fiber containing
higher crystallinity than regenerated cellulose (Gümüs-
kaya et al. 2003). In order to create a flat surface for
microscopy, linter cellulose chads were fabricated
through a h igh-pressure homogenization method and
used as the sole carbon source to culture C. obsidiansis.
As with re generated cellulose, biofilm growth on linter
cellulose was characterized by the formation and fusion
of depressions on the surface (Figure 5). C. obsidiansis
biofilm formation on linter cellulose, however, was
much slower than on regenerated cellulose, requiring
four days to reach a growth stage comparable to 24 h
growth on regenerated cellulose (compare Figure 3b
with Figure 5). The higher crystallinity of linter cellulose
likely accounts for this slower biofilm formation and cel-
lulose degradation.
Biofilm formation by C. thermocellum
In C. thermocellum, the cellulosome is thought to p lay
important roles in promoting bacterial attachment to
cellulose and in cellulose hydrolysis (Adams et al. 2006).
C. thermocellum was used as a model cellulosome-pro-
ducing organism to compare whether the presence of
cellulosomes altered the dynamics of biofilm formation
on cellulose compared to non-cellulosome producing
bac teria. In this study, C. thermocellum was grown with
regenerated cellulose chads as the sole carbon source.
Results showed a very similar biofilm formation process
to that of the C. obsidiansis, characterized by the forma-
tion of depressions in the cellulose substrate (Figure 6).
Discussion
In this study, the spatial and temporal dynamics of biofilm
formation by two different microorganisms on two differ-
ent cellulose substrates were investigated and correlated to
cellulose degradation. Previous studies of bacterial degra-
dation of biomass in sheep rumen using electron micro-
scopy showed the presenc e of bacteria within cavities on
the plant wall, leading to the hypothesis that the celluloly-
tic bacteria used a tunneling mechanism to degrade the
plant (Dinsdale et al. 1978). Similarly, after incubation
with the ruminal cellulolytic bacteria Ruminococcus flave-
faciens,cell-sizedpitswereobservedonleafsheathswhich
were presumed to be due to bacterial degradation (Shinkai
and Kobayashi, 2007). In another study, Gehin et al.
(1996) observed the attachment of Clostridium cellulolyti-
cum on Whatman No. 1 filter paper after 30 minutes incu-
bation, although colony formation was not observed
during this short experiment.
The use of flat cellulose substrates coupled with sam-
pling the biofilm structure at multiple stages of develop-
ment allowed dissection of the multi-step process o f
biofilm formation and cellulose degradation (Figure 7).
The process started with the random attachment of
individual cells on the cellulose surface. These ce lls
appear to grow and divide, forming colonies that grow
into the substrate. The depressions formed by microbial
hydrolysis of cellulose eventually fuse, resulti ng in a
thin biofilm that covers the entire cellulose substrate.
This biofilm formation and cellulose degradation pro-
cess was observed not only on regenerated cellulose
surface but also on natural linter cellulose surface (Fig-
ures 2 and 5). These data also confirm that cellulo-
somes are not required for the attachment of
cellulolytic bacteria on cellulose surfaces, since the cra-
ter-like biofilm structure was observed for both cellulo-
some-producing and non-cellulosome producing
cellulolytic bacteria (Figures 2 and 6 ). It is tempting to
speculate that this colony development process repre-
sents a common cellulose degradation mechanism for
cellulolytic bacteria, although additional bacteria and
substrates should be tested.
The key steps in cellulolytic biofilm formation were
simulated with cellular automata. We used a “nine-neigh-
bor square” model for a two-dimensional cellular auto-
mata in which both the nearest and next-nearest cells are
considered. The cell ulose substrate is represented by a 30
× 15 grid upon which a single cell is attached (Figure 8a),
which is similar to the distribution of cells at the 8 h time
point (Figure 1b). Using the doubling time reported for
C. obsidiansis with Avicel as substrate (Hamilton-Brehm
et al. 2009) and a horizontal division rule, a monolayer of
cells is observed at 16 h (Figure 8b). Again, this distribu-
tion of cells is similar to the distribution observed experi-
mentally (Figure 3a). By restricting the maximum biofilm
thickness to the experimentally observed 10 μmthrough
the cell detachment simulation and t he application of
both horizontal and vertical division rules, the model
produced depressions in the cellulose surface (Figures 8c,
d) that closely matched the dynamics of C. obsidiansis
biofilm formation (Figures 3b, c). This simple simul ation
in Figure 8 further demonstrates the synchronized
dynamics between biofilm formation and cellulose degra-
dation. The reason why C. obsidiansis cells did not grow
into the cellulose at 8 h and earlier might be attributable
to the available peripheral substrate at the early stage. At
Wang et al. AMB Express 2011, 1:30
/>Page 6 of 10
later stages (16 h), the cells in the center of the colony
have to move downward into the substrate in order to
access carbon.
Judging from the correlation between C. cellulyticum
activity and adhesion to cellulose, Lynd et al. (2006) pre-
dicted biofilm formation might facilitate cellulose degra-
dation. The direct observation and measurement of
biofilm formation and cellulo se degradation in this study
suggests that only the portions o f the cellulose substrate
colonized by the biofilm were effectively hydrolyze d.
These data emphasize the critical role of biofilm forma-
tion in cellulose degradation. Hence, a rapid startup of
cellulose hydrolysis is theoretically achievable by increas-
ing the number of ba cteria attached on the cellulose sub-
strate during the initial phase until the maximum rate of
hydrolysis is reached, correlating to complete substrate
coverag e by the biofilm. This saturation hydrolysis rate is
about 5.33 × 10
-5
gh
-1
cm
-2
as measured from the linear
degradation profile in Figure 4a. This kind of constant
hydrolysis rate has been widely reported and thought to
Figure 5 Top and cross-sectional views of inverted colony formation by C. obsidiansis into the structure of linter cellulose chad aft er
four days incubation.
Wang et al. AMB Express 2011, 1:30
/>Page 7 of 10
Figure 6 Crater-like depression formed by C. thermocellum at 39 h. a) top view, b) cross-sectional view.
ͳ
ʹ
͵
Ͷ
ͷ
Figure 7 Schematic illustration of the six stages of cellulolytic biofilm formation on cellulose surface observed from this study. i.e., 1)
single cell attachment to the substrate; 2) cell growth and division 3) inverted colony formation; 4) crater-like depression formation due to
degradation of the cellulose substrate; 5) fusion of the depressions; and 6) homogenous biofilm formation.
Wang et al. AMB Express 2011, 1:30
/>Page 8 of 10
be the result of microbial attachment to all accessible
substrate (Batstone et al. 2001). Consistent with this
assumption, even a 3-fold increase in the number of
planktonic cells did not increase the cellulose hydrolysis
rate (Figure 4a), suggesting that cellulose hydrolysis is
performed mainly by attached cells.
This study provides new information on the growth
and structure of cellulolytic biofilms. After the initial
attachment phase when the bacteria form inverted
colonies and depressions in the substrate, the biofilm
maintains a thin and uniform profile (approximately 10
μm) with a high cell concentration (between 10
11
to
10
12
cells cm
-3
) for the remainder of the experiment.
These properties are in line with the cellulolytic bio-
film morphologies analyzed in other studies, regardless
ofthetypeoffeedstockororganism(Table1).How-
ever, the cellulolytic biofilm morphology observed in
thisstudyaswellasothersappearsquitedifferent
from the morphology of biofilms grown on soluble
substrates which tend to display a heterogeneous
structure with internal porosity (van Loosdrecht et al.
2002). Biofilms grown on soluble substrates typically
displayathicknessonthescaleof100μm to 1000 μm
and a cellular density under 10
11
cells cm
-3
(Zhang
and Bishop 1994; Ito et al. 2002). It is worth mention-
ing that the biofilm thickness and cellular density are
usually believed to be positively and negatively corre-
lated with substrate availability, respectively (Park et al.
1998). High soluble substrate concentrations tend to
promote growth of thick biofilms which are then sub-
jected to mass diffusion limitations, leading to the for-
mation of porous structures with fewer cells to
facilitate substrate transfer (van Loosdrecht et al.
2002). Such a mass diffusion limitation results in an
uneven growth rate within the soluble substrate feed-
ing biofilm and leads to a heterogeneous biofilm mor-
phology. In contrast, low soluble s ubstrate availability
supports only thin biofilms because mass diffusion is
no longer a rate-limiting step, and thus dense and uni-
form biofilms are formed (Park et al. 1998). Our pre-
vious work on the modeling of hydrolysate diffusion
and utilization in cellulose feeding biofilms are consis-
tent with this inference (Wang et al. 2011). These
modeling studies predicted that the hydrolysate con-
centration profile is quite uniform throughout th e cel-
lulolytic biofilm and that the growth of the biofilm is
limited by hydrolysate utilization rates, rather than
hydrolysate diffusion rates (Wang et al. 2011).
15 m
d
10 m
c
10 m
b
10 m
a
Figure 8 Model of biofilm formation simulated by cellular automata. a) initial bacteria attachment at 0 h; b) horizontal monolayer cluster
development at 16 h, c) inverted colony formation at 24 h and d) crater-like depression formation at 44 h.
Table 1 Thickness and cell density of cellulolytic biofilms cultivated with various types of feedstock and
microorganisms
No. Substrate Culture Thickness r
a
(cells
cm
-2
)
d
(μm)
Microscope r
v
(cells
cm
-3
)
Reference
1 Alfalfa leave Mixed rumen bacteria Monolayer 2.12 × 10
8
0.77 TEM 2.74 × 10
12
(Cheng et al. 1984)
2 Forage Fibrobacter succinogenes Monolayer 9.68 × 10
7
1.15 SEM 8.43 × 10
11
(Weimer et al. 1993)
3 Wheat straw Fibrobacter succinogenes Butyrivibrio
fibrisolvens
Monolayer 6.85 × 10
7
1.36 SEM 5.02 × 10
11
(Miron et al. 2001)
4 Cellulose Land fill mixed culture Monolayer 2.02 × 10
7
2.51 Confocal 8.05 × 10
10
(Burrell et al. 2004)
5 Wheat
embryo
Agrobacterium tumefaciens Monolayer 5.29 × 10
7
1.55 SEM 3.41 × 10
11
(Mooney and Goodwin
1991)
6 Cellulose Mixed leachate Monolayer 2.53 × 10
7
2.25 SEM 1.13 × 10
11
(Song et al. 2005)
7 Cellulose C. obsidiansis ~10μm 1.69 × 10
8
1.80 Confocal 1.69 × 10
11
This study
Wang et al. AMB Express 2011, 1:30
/>Page 9 of 10
Additional material
Additional file 1: C. obsidiansis biofilm formation at 24 h.
Visualization of the three-dimensional structure of an inverted colony of
C. obsidiansis growing into regenerated cellulose substrate at 24 h
Additional file 2: C. obsidiansis biofilm formation at 44 h.
Visualization showing the three-dimensional structure of crater-like
depressions formed by C. obsidiansis on regenerated cellulose at 44 h
Acknowledgements
This work was supported by the BioEnergy Science Center (BESC), which is a
U.S. Department of Energy Bioenergy Research Center supported by the
Office of Biological and Environmental Research in the DOE Office of
Science. Oak Ridge National Laboratory is managed by UT-Battelle, LLC, for
the U.S. Department of Energy under contract DE-AC05-00OR22725.
Author details
1
BioEnergy Science Center, Biosciences Division, Oak Ridge National
Laboratory, Oak Ridge, TN 37831, USA
2
National Institute of Advanced
Industrial Science and Technology, Biomass Technology Research Center,
Hiroshima, Japan
Competing interests
The authors declare that they have no competing interests.
Received: 26 September 2011 Accepted: 7 October 2011
Published: 7 October 2011
References
Adams JJ, Pal G, Jia ZC, Smith SP (2006) Mechanism of bacterial cell-surface
attachment revealed by the structure of cellulosomal type II cohesin-
dockerin complex. Proc Natl Acad Sci USA 103:305–310. doi:10.1073/
pnas.0507109103.
Batstone DJ, Keller J, Angelidaki I, Kalyuzhnyi SV, Pavlostathis SG, Rozzi A,
Sanders WTM, Siegrist H, Vavilin VA (2001) The IWA Anaerobic Digestion
Model No. 1 (ADM1). IWA Publishing, London, U.K
Burrell PC, O’Sullivan C, Song H, Clarke WP, Blackall LL (2004) Identification,
detection, and spatial resolution of Clostridium populations responsible for
cellulose degradation in a methanogenic landfill leachate bioreactor. Appl
Environ Microbiol 70:2414–2419. doi:10.1128/AEM.70.4.2414-2419.2004.
Cheng KJ, Stewart CS, Dinsdale D, Costerton JW (1984) Electron-microscopy of
bacteria involved in the digestion of plant-cell walls. Anim Feed Sci Technol
10:93–120. doi:10.1016/0377-8401(84)90002-6.
Dinsdale D, Morris EJ, Bacon JSD (1978) Electron microscopy of the microbial
populations present and their modes of attack on various cellulosic
substrates undergoing digestion in the sheep rumen. Appl Environ Microbiol
36:160–168
Gehin A, Gelhaye E, Petitdemange H (1996) Adhesion of Clostridium cellulolyticum
spores to filter paper. J Appl Bacteriol 80:187–190. doi:10.1111/j.1365-
2672.1996.tb03208.x.
Gümüskaya E, Usta M, Kirci H (2003) The effects of various pulping conditions on
crystalline structure of cellulose in cotton linters. Polym Degrad Stability
81:559–564. doi:10.1016/S0141-3910(03)00157-5.
Hamilton-Brehm SD, Mosher JJ, Vishnivetskaya T, Podar M, Carroll S, Allman S,
Phelps TJ, Keller M, Elkins JG (2009) Caldicellulosiruptor obsidiansis sp. nov.,an
anaerobic, extremely thermophilic, cellulolytic bacterium isolated from
Obsidian Pool, Yellowstone National Park. Appl Environ Microbiol
76:1014–1020
Hromadko J, Hromadko J, Miler P, Honig V, Cindr M (2010) Technologies in
second-generation biofuel production. Chem Listy 104:784–790
Ito T, Okabe S, Satoh H, Watanabe Y (2002) Successional development of sulfate-
reducing bacterial populations and their activities in a wastewater biofilm
growing under microaerophilic conditions. Appl Environ Microbiol
68:1392–1402. doi:10.1128/AEM.68.3.1392-1402.2002.
Lynd LR, Weimer PJ, van Zyl WH, Pretorius IS (2002) Microbial cellulose
utilization: Fundamentals and biotechnology. Microbiol Mol Biol Rev
66:506–577. doi:10.1128/MMBR.66.3.506-577.2002.
Lynd LR, Weimer PJ, Wolfaardt G, Zhang Y (2006) Cellulose hydrolysis by
Clostridium thermocellum: A microbial perspective. In: Uversky V, Kataeva IA
(eds) Cellulosome. Nova Science Publishers, New York pp 95–117
Lynd LR, Laser MS, Brandsby D, Dale BE, Davison B, Hamilton R, Himmel M,
Keller M, McMillan JD, Sheehan J, Wyman CE (2008) How biotech can
transform biofuels. Nat Biotechnol 26:169–172. doi:10.1038/nbt0208-169.
Miron J, Ben-Ghedalla D, Morrison M (2001) Invited review: Adhesion
mechanisms of rumen cellulolytic bacteria. J Dairy Sci 84:1294–1309.
doi:10.3168/jds.S0022-0302(01)70159-2.
Mooney PA, Goodwin PB (1991) Adherence of Agrobacterium tumefaciens to the
Cells of Immature Wheat Embryos. Plant Cell Tiss Org Cult 25:199–208
Park YS, Yun JW, Song SK (1998) Biofilm properties under different substrate
loading rates in a rotating biological contactor. Biotechnol Tech 12:587–590
Segal L, Creely J, Martin A, Conrad C (1959) An empirical method for estimating
the degree of crystallinity of native cellulose using the X-ray diffractometer.
Text Res J 29:786–794. doi:10.1177/004051755902901003.
Song H, Clarke WP, Blackall LL (2005) Concurrent microscopic observations and
activity measurements of cellulose hydrolyzing and methanogenic
populations during the batch anaerobic digestion of crystalline cellulose.
Biotechnol Bioeng 91:369–378. doi:10.1002/bit.20517.
van Loosdrecht MCM, Heijnen JJ, Eberl H, Kreft J, Picioreanu C (2002)
Mathematical modelling of biofilm structures. Anton Leeuw Int J G
81:245–256. doi:10.1023/A:1020527020464.
Wang ZW, Hamilton-Brehm SD, Lochner A, Elkins JG, Morrell-Falvey JL (2011)
Mathematical modeling of hydrolysate diffusion and utilization in cellulolytic
biofilms of the extreme thermophile Caldicellulosiruptor obsidiansis
. Bioresour
Technol 102:3155–3162. doi:10.1016/j.biortech.2010.10.104.
Weimer PJ, Hatfield RD, Buxton DR (1993) Inhibition of ruminal cellulose
fermentation by extracts of the perennial legume cicer milkvetch (Astragalus
cicer). Appl Environ Microbiol 59:405–409
Zhang TC, Bishop PL (1994) Density, porosity, and pore structure of biofilms.
Water Res 28:2267–2277. doi:10.1016/0043-1354(94)90042-6.
Zhang YHP, Lynd LR (2005) Regulation of cellulase synthesis in batch and
continuous cultures of Clostridium thermocellum. J Bacteriol 187:99–106.
doi:10.1128/JB.187.1.99-106.2005.
doi:10.1186/2191-0855-1-30
Cite this article as: Wang et al.: Spatial and temporal dynamics of
cellulose degradation and biofilm formation by Caldicellulosiruptor
obsidiansis and Clostridium thermocellum. AMB Express 2011 1:30.
Submit your manuscript to a
journal and benefi t from:
7 Convenient online submission
7 Rigorous peer review
7 Immediate publication on acceptance
7 Open access: articles freely available online
7 High visibility within the fi eld
7 Retaining the copyright to your article
Submit your next manuscript at 7 springeropen.com
Wang et al. AMB Express 2011, 1:30
/>Page 10 of 10