Báo cáo hóa học: " Comparative transcriptomic profile analysis of fed-batch cultures expressing different recombinant proteins in Escherichia coli" doc
Bạn đang xem bản rút gọn của tài liệu. Xem và tải ngay bản đầy đủ của tài liệu tại đây (1.17 MB, 12 trang )
ORIGINAL Open Access
Comparative transcriptomic profile analysis of
fed-batch cultures expressing different
recombinant proteins in Escherichia coli
Ashish K Sharma, Shubhashree Mahalik, Chaitali Ghosh, Anuradha B Singh and Krishna J Mukherjee
*
Abstract
There is a need to elucidate the product specific features of the metabolic stress response of the host cell to the
induction of recombinant protein synthesis. For this, the method of choice is transcriptomic profiling which
provides a better insight into the changes taking place in complex global metabolic networks. The transcriptomic
profiles of three fed-batch cultures expressing different proteins viz. recombinant human interferon-beta (rhIFN-b),
Xylanase and Green Fluorescence Protein (GFP) were compared post induction. We observed a depression in the
nutrient uptake and utilization pathways, which was common for all the three expressed proteins. Thus glycerol
transporters and genes involved in ATP synthesis as well as aerobic respiration were severely down-regulated. On
the other hand the amino acid uptake and biosynthesis genes were significantly repressed only when soluble
proteins were expressed under different promoters, but not when the product was expressed as an inclusion body
(IB). High level expression under the T7 promoter (rhIFN-b and xylanase) triggered the cellular degradation
machinery like the osmoprotectants, proteases and mRNA degradation genes which were highly up-regulated,
while this trend was not true with GFP expression under the comparatively weaker ara promoter. The design of a
better host platform for recombinant protein production thus needs to take into account the specific nature of the
cellular response to protein expression.
Keywords: Transcriptomic profiling, recombinant, fed-batch, Escherichia coli
Introduction
The wide variability in the expression levels of recombi-
nant proteins in Escherichia coli remains a major challenge
for biotechnologists. While some proteins are routinely
expressed at 30-40% of total cellular protein (TCP) (Joly
and Swartz 1997; Kim et al. 2003; Suzuki et al. 2006),
others may reach a maximum of only 5% of TCP (Kiefer
et al. 2000). The uses of strong promoters, removal o f
codon bias and media d esign are favored strategies for
improving recombinant protein yield (Acosta-Rivero et al.
2002 ; Hale and Thompson 1998). It is important to note
that most scale up strategies involving high cell density
cultures tend to increase biomass concentrations and
hence volumetric product conce ntrations rather than the
specific product yield in terms of product formed per unit
biomass (Y
p/x
). This yield remains an intrinsic property of
the host-vector-gene combination used for expression.
Improvements in host vector systems has tended to focus
on developing high copy number plasmids with strong
tightly regulatable promoters (Bowers et al. 2004; Jones et
al. 2000; Wild and Szybalski 2004) along with protease
free and recombination deficient strains (Meerman and
Georgiou 1994; Ratelade et al. 2009). The focus has thus
primarily been on enhancing the metabolic flux of the
recombinant protein expression pathway, with few studies
on analyzing how the gene products interact with the host
cell machinery to depress its own expression.
It has been routinely observed that the specific growth
rate of recombinant cultures declines post induction. Ear-
lier authors had correlated this decline to be a measure of
the metabolic burden associated with recombinant pro-
duc tion (Bentley et al. 1990; Seo and Bailey 1985). It was
postulated that the availability of critical metabolites was
reduced since they were diverted to product formation,
leading to a concomitant decline in the specific growth
rate (Babaeipour et al. 2007). It is therefore to be
* Correspondence:
School of Biotechnology, Jawaharlal Nehru University, New delhi-67, India
Sharma et al. AMB Express 2011, 1:33
/>© 2011 Sharma et al; licensee Springer. This is an Open Access article distributed under the terms of the Creative Commons Attribution
License ( which permits unrestricted use, distribution, and reproduction in any medium,
provided the original work is properly cited.
expected that the decline in growth should be most
severe when expressio n levels are maximum. However in
most cases there seems to be no such correlation since
severe growth retardation is observed when some pro-
teins are expressed in fairly low amounts (Bhattacharya
et al. 2005) whereas high level expression of other pro-
teins cause little or no growth retardation (Srivastava and
Mukherjee 2005; Vaiphei et al. 2009). The metabolic bur-
den hypothesis is also unable to explain the large variabil-
ity observed in the levels of recombinant protein yield.
Recent studies on the transcriptomic profiling of recom-
binant cultures has improved our understanding on the
nature of cellular stress associated with over-expression of
recombinant proteins (Haddadin and Harcum 2005).
Global regulators are triggered in response to induction
and these in turn up/down-regulate sets of genes involved
in a range of cellular functions (Perez-Rueda and Collado-
Vides 2000; Perrenoud and Sauer 2005). These include
genes for central carbon metabolism glycolysis, Entner-
Doudoroff pathway, pentose phosphat e pathway (PPP),
tricarboxylic acid (TCA) pathway, glyoxylate shunt (GS),
respiration, transport, anab olism, catab olism and macro-
molecular degradation, protein biosynth esis, cell division,
stress response, flagellar and chemotaxis system. This
coordinated response of the host mimics many features of
the heat shock, osmotic shock, oxidative stress and strin-
gent responses (Gill et al. 2000; Kurland and Dong 1996).
This results in the decline of both growth and product for-
mation rates. Thus transcriptomic data reveals a more
complex picture of the host response where the cell dyna-
mically reacts to the stress associated with recombinant
protein expression. In this work we have tried to extend
this analysis by two ways. Firstly we have mimicked indus-
trial scale fermentation where complex m edia is used to
obtain a combination of high cell densities along with high
specific growth rates. The latter allows high specific pro-
duct formation rates and thus product yields are signifi-
cantly higher in complex media. The transcriptomic
profiling of such cultures could provide a more meaning-
ful picture of the cellular physiology under conditions of
hyper-expression. We have also attempted to overcome
the problems of monitoring cultures grown in complex
media by online measurement of metabolic activity like
OUR, CER, etc. Secondly we have looked at the variability
in cel lular str ess responses as a f unction of the nature of
the expressed protein. For this we choose three proteins
viz. rhIFN-b, Xylanase and GFP, where the bioprocess
parameters for high lev el expression has been previ ously
optimized in our lab. A primary reason for choosing these
three proteins was to analyse the difference in the tran-
scriptomic profile when two soluble proteins were
expressed under different expression systems and also to
see the variability in the cellular response when expression
is in the form of inclusion bodies (rhIFN-b) or as a soluble
protein (xylanase). In all these cases there is a large diver-
sion of the metabolic flux towards recombinant protein
synthesis and thus according to the ‘ metabolic burden’
hypothesis the cellular stress response should be similar.
However we observed significant difference in the up/
down regulation of gene s demonstrating that the cellular
response is a function of the gene product and the expres-
sion system used.
Materials and methods
Chemicals and reagents
Media and bulk chemicals were purchased from local
manufacturers, Himedia, Qualigens, and Merck. Media
used were LB (Luria-Bertani media containing yeast
extract 5 g, tryptone 10 g, and NaCl 10 g/L, pH 7.2), TB
(Terrifc broth containing yeast extract 24 g, tryptone 12
g/L, and 0.4% glycerol, pH 7.2). IPTG (1 mM), ampicil-
lin and chloramphenicol were from Sigma, USA.
Restriction and modifying enzymes were purchased
from MBI Fermentas. All other chemicals were of analy-
tical grade and obtained from local manufacturers.
Strains and plasmids
Escherichia coli strain BL-21 (DE3) [(F
-
ompT hsdSB(rB
-
mB
-
) recA1 gal dcm _(DE3)(lacI lac UV5-T7 gene 1ind1
Sam7 nin5)] was obtained from Novagen, USA. Strain
DH5a (supE44_lacU169 (_80 lacZ _M15) hsdR17 recA1
endA1 gyrA96 thi-1 relA1) was obtained from Amer-
sham Biosciences, USA. Plasmid pET22b (Amp
R
)was
from Novagen, USA, pRSET B (Amp
R
) from Invitrogen,
Netherland and pBAD33 (Chloramphenicol
R
)fromJ.
Beckwith, USA.
Cloning & expression of Representative proteins
rhIFN-b gene was inserted downstream of the T7 pro-
moter in a pET22b expression vector and transformed
into E.coli BL-21(DE3) cells. rhIFN-b gene was synthe-
sized using SOEing PCR where all the non optimal
codons were replaced with optimal codons.
The complete xylanase gene f ragment was amplified
using M13 forward and XylR primers and a hexahisti-
dine fused xylanase was cloned into the pRSET B vector.
This construct was named pRSX and showed soluble
cytoplasmic expression.
Cloning of GFP gene into pBAD33 was done by
digesting pET14b-GFP (obtained from ICGEB, India)
with enzymes XbaI and HindIII and ligating it into plas-
mid pBAD33 (which does not contain any ribosome
binding site). GFP was cloned under the ara promoter
which is a tightly regulated promoter.
High cell density cultivation
A freshly transformed single colony of each clone was
inoculated in 10 ml Terrific Broth (TB) containing
Sharma et al. AMB Express 2011, 1:33
/>Page 2 of 12
100 μg/ml (1×) ampicillin and grown over night. This
culture was used to inoculate 200 ml TB having the
same antibiotic concentration and grown further for 8 h
(OD~ 7). This was used as an inoculum for the fermen-
ter (Sartorius Biostat B Plus) containing TB medium &
1× antibiotic. Temperature, pH and initial Dissolved
Oxygen (DO) were set at 37°C, 7.0 and 100% respec-
tively with the initial stirrer at 250 rpm. DO was cas-
caded with stirrer and maintained at 40%. The airflow
ratewaskeptat2l/m.ThemediumpHwassetat7.0
and controlled by automatic addition of 1 N HCl or
NaOH. Sigma Antifoam 289 was added when required.
The feeding solution which comprises 12% peptone,
12%YeastExtractand18%Glycerolwasfedsoasto
maintai n the pre-inductio n μ at 0.3 h
-1
. The culture was
initially grown in a batch mode till 10-12 OD and then
the feed was attached. In order to support the growth at
a constant specific growth rate of 0.3 h
-1
, the feed rate
was increased exponentially using the equation F =
F
o
e
μt
,whereF
o
is the initial flow rate, F is the flow rate
at any given time, μ isthespecificgrowthrateandtis
time in hours. Simultaneously, the metabolic activity of
the cultures was estimated indirectly by observing the
Oxygen Uptake Rate (OUR) and Carbon Emission Rate
(CER) which was measured by an exit gas analyser (Fer-
Mac 368, Electrolab Ltd, Tewkesbury, UK). RPM is also
a useful online indicator of the oxygen transfer rate
which matches the oxygen uptake rate (OUR) when dis-
solved oxygen is at steady state. Since throughout the
experiment, dissolved oxygen was maintained at 40% by
cascading RPM with dissolved oxygen, we could corre-
late these parameters with the metabolic activity of the
culture ( Gupta et al. 1999). Thus a plot of OUR versus
RPM
2
, gave a straight line (Additional File 1) and this
provided us with a cross check o n the measured values
of OUR. This was used to estimate the online metabolic
activity of the culture post induction which allowed us
to design the post induction feeding strategy without
allowing substrate buildup in the media. From the pH
profile it was ensured that there was no acetate accumu-
lation and both acetate and glycerol levels were moni-
tored using the Megazyme Acetic Acid kit (KACETRM;
Megazyme International Ireland Limited) and using the
Megazyme Glycerol kit (K-GCROL; Megazyme Interna-
tional Ireland L imited) respectively, to confirm that
there was no overflow metabolism.
Transcriptomic Profiling
Samples from fed batch fermentations of rhIFN-b, Xyla-
nase and GFP were collected at four time points (0 h, 2 h,
4 h, and 6 h) after induction. 0 h (uninduced) samples
were taken as a control for every run. The cDNA synth-
esis, labelling (biotin) and hybridization (Affymetrix Gene-
Chip E.coli genome 2.0 array) were perform ed according
to the Affymetrix GeneChip expression analysis protocols.
Washing, staining and amplification were carried out in an
Affymetrix Gene Chip
®
Fluidics Station 450. Affymetrix
GeneChip
®
scanner 3000 was used to scan the microar-
rays. Quantification and acquisition of array images were
done using Affymetrix Gene Chip Operating Software
(GCOS) version 1.4. Three types of detection call (i.e., pre-
sent, absent, or marginal) were calculated using statistical
expression algorithm and average normalization was per-
formed. Hybridization and spike controls were used.
Subsequent data analysis was performed using Gene-
Spring GX11.5 software (Agilent Technologies, USA).
RMA algorithm was used for data summarization (Bol-
stad et al. 2003) and quality control of samples was
assessed by principle component analysis (PCA). Fold
change was calc ulated as time point/uninduced control
(0 h). Normalized signal intensities of each gene on
chips were conve rted to log2 values, and compared
between experiments.
The microarray data series of fed batch runs have been
deposited to the Gene Expression Omnib us database at
NCBI under the accession number GSE28412 for rhIFN-b
(GEO; />acc=GSE28412), GSE29439 for xylanase (GEO; h ttp://
www.ncbi.nlm.nih.gov/geo/query/acc.cgi?acc=GSE29439)
and GSE29440 for GFP (GEO; .
gov/geo/query/acc.cgi?acc=GSE29440).
Experimental design for data analysis
Thedatasetwasfilteredandgeneswith≥ 2foldchange
were selected for further analysis. The comparison was
done across all time points f or all 3 sets of recombinant
protein and the common set of up/down-regulated gene
were used for further analysis. The comparison set is
shown as a Venn diagram in Additional file 2a.
To analyze the similarities in the response to rhIFN-b,
Xylanase and GFP produc tion, common genes in all the
three gene sets were extracted and shown in Additional
file 2b, e and Additional file 3.
Next, to analyse the effect of hyper-expression of
recombinant protein under a strong promoter, the list of
genes that were exclusively up/down-regulated in the
time course profiles of rhIFN-b a nd Xylanase but not in
GFP were extracted from the Venn diagram as shown in
Additional file 2.c, f and Additional file 4.
Similarly to analyse the effect of heterologous soluble
protein expression on host cells the time course expres-
sion profile of X ylanase and GFP were analysed and the
genes that were solely up/down-regulated in these two
sets and not in rhIFN-b (expressed as inclusion body)
were picked up (Additional file 2d, g and Additional file
5) for further studies. Gene expression values of the
above three sets are represented in the form of heat
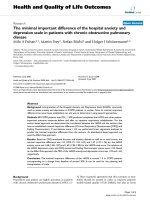
map in Figure 1.
Sharma et al. AMB Express 2011, 1:33
/>Page 3 of 12
ƌŚ/&EͲȕ yLJůĂŶĂƐĞ
'&W
ƌŚ/&EͲȕ yLJůĂŶĂƐĞ '&W
Ă
ď
Đ
Figure 1 Heat maps comparing the expression profiles. a) Set of genes present during expression of rhIFN-b, xylanase and GFP. b) S et of
genes affected during rhIFN-b and xylanase production but not in GFP. c) Set of common genes present during expression of GFP and xylanase
but not in rhIFN-b.
Sharma et al. AMB Express 2011, 1:33
/>Page 4 of 12
Results
In this work rhIFN-b was expressed as an inclusion body
whereas xylanase and GFP were expressed as soluble pro-
teins. While rhIFN-b and xylanase were expr essed under
a strong promoter (T7) in E.coli BL21 (DE3) cells, GFP
was expressed under the ara promoter in an E.coli DH5a
strain. Cells were grown exponentially in the bioreactor
at a spe cific growth rate of 0.3 h
-1
by using an exponen-
tial feed of complex media and indu ction was done at an
OD between 20-25. At this point the feed rate was ~40
ml/h and the OUR was 0.27 moles/l/h, with a Respiratory
Quotient (RQ) of 1.1. Since the biomass yield (Y
x/s
)on
glycerol, while using complex nitrogen sources had been
previously determined to be between 1-1.1 g/g. The
above results matched stoichiometrically and demon-
strated complete c onsumption of substrate feed. A con-
tinuous fall in the specific growth rate was observed
which dropped to zero within 4 hours of induction. In
the post induction phase continuous increase in the OUR
was observed which necessitated oxygen supplement of
the inlet air after 1 h of induction. From the o n-line
metabolic activity measurement we could identify 3
phases in the metabolic activity of the culture. In the first
phase from the point of induction till 2 hours the activity
as measured by OUR, CER a nd RPM
2
kept increasing,
even though there was continuous decline in specific
growth rate. Clearly a large part of this metabolic activity
was diverted towards maintenance (Russell and Cook
1995). The specific product formation rate was high dur-
ing this period. Since the metabolic activity doubled in
this period, the post-induction feed was also increased
concomitantly (Ramalingam et al. 2007). In the second
phase between 2 to 4 hours the feed was kept constant
since the on-line measurement indicated a constant
metabolic activity. Finally after 4 hours there was a
decline in metabolic activity and the specific product for-
mation rate declined to reach zero in 6 hours. Samples
were collected to represent these three p hases 2, 4 and
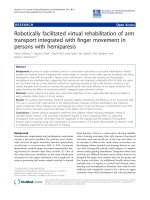
6 hour (post-induction). Figure 2 shows the SDS-PAGE
gel picture of rhIFN-b, xylanase and GFP expression pro-
file post induction.
Identifying the similarities in the cellular stress response
The transcriptomic profiles of three different fermenter
runs with rhIFN-b/BL21 (DE3), Xylanase/BL21 (DE3) and
GFP/DH5a were analyze d post induct ion and genes with
an expression fold change ≥2 with respect to the point of
induction were chosen for further analysis. From these,
the comm on li st of genes with a high fold change across
all time points and across all three fermenter runs was
identified (Additional file 3). We observed that in all the
three cases, the genes associated with metabolic activity in
terms of carbon utilization and energy generation path-
ways were severely down-regulated. This was similar to
earlier reports, where the expression of plasmid based pro-
teins caused a down- regulat ion of genes involved in bio-
synthetic pathway, energy metabolism and central carbon
metabolism (Ow et al. 2010).
Among the existing transport systems involved in
nutrient uptake in E.coli,twomajorcomponentsofthe
glycerol uptake sy stem are glpT (Glycerol-3-phosphate
transporter) and glpK (Glycerol kinase). Both these were
down-regulated 3.7 and 5.6 folds respectively. Oh and
Liao (2000) have also reported that when glycerol was
used as a carbon source, under nutrition limitation,
genes involved in glycerol catabolism were down-regu-
lated. We also observed that maltose transporters malT,
malE and malK were repressed with a concomitant up-
regulation of mlc which negatively regulates the ATP-
binding component of the maltose ABC transporter
(Plumbridge 2002) similar to observations of Lemuth
et.al. (2008), which indicates that transport of carbon
sources were significantly affected.
The transcript levels of a number of aerobic respiration
proteins involved in ATP synthesis were found to be rela-
tively lower. The genes of the nuo operon encoding for
Figure 2 SDS-PAGE gel picture showing total cellular protein from fed-batch culture in TB medium. a) rhIFN-b. b) GFP c) Xylanase. Same
marker lane has been used for 1(a) and 2(b).
Sharma et al. AMB Express 2011, 1:33
/>Page 5 of 12
components of NADH dehydrogenase-I were down-regu-
lated. NADH: ubiquinone oxidoreductase-I (NDH-1) is an
NADH dehydrogenase which is part of both the aerobic
and anaerobic respiratory chain of the cell (Hua et al.
2004). It was found that the ndh and genes of the atp
operon were down-regulated in line with previous obser-
vations (Durrschmid et al. 2008; Haddadin and Harcum
2005). In addition, expression of two main aerobic term-
inal oxidases, cytochrome bd (cydAB) and cytochrome bo
(cyoABCD genes) were also reduced (Oh and Li ao 2000).
Concomitantly we observed a severe down-reg ulation of
genes inv olved in TCA cycle (icdA, aceBAK, acs)and
amino acid synthesis which can be attributed to the cellu-
lar stress associated with the over-expression of recombi-
nant proteins. sucABCD operon of TCA cycle was down-
regulated and this may be due to the repressor activity of
ArcA/ArcB, which is known to act on aerobic central
metabolism pathway during oxidative stress (Vemuri et al.
2005). Both glpD, which catalyses the conversion of gly-
cerol-3-phosphate to dihydroxyacetone phosphate, and
prpE, a key enzyme in propionate degradation were up-
regulated 10.4 fold and 5.4 fold respectively. This indicates
that alternative pathways for substrate utilization are active
during stress, and act as anapleurotic reactions to replen-
ish TCA cycle metabolites. gatZ is involved in galactitol
degradation which catalyze the dissociation of D-tagatose
1, 6-biphosphate to glycolytic intermediates (Nobelmann
and Lengeler 1996). This gene was observed to be down-
regulated, indicating that potential anapleurotic pathways
which are energy consuming are down-regulated in order
to conserve energy . Interestingly there w as also down-
regulation of tnaA which breaks down L- tryptophan and
L- cysteine to pyruvate. This shows that while the overall
flux in the glycolytic pathway is decreased, a cascade of
events also t akes place to maint ain the pool of critical
intermediaries inside the cell. We can therefore hypothe-
size that the cell ensures its supply of nodal metabolites
while it reprogrammes its machinery upon induction of
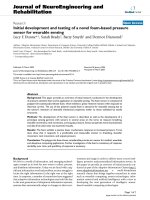
metabolic stress. The schematic of the processes and reac-
tions catalyzed by this common set of differentially
expressed genes is given in Figure 3.
Analysis of differential expression due to hyper-
expression
The set of genes which were found to be up/down-regu-
lated (fold change ≥ 2) during high level expression of
rhIFN-b and xylanase under the T7 promoter, but not in
the relatively lowe r ’ara’ based expression of GFP were
analysed to understand the host response towards hyper-
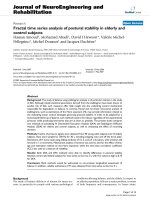
expression of proteins (Figure 4, Additional file 4).
The processes of cell growth and expression of foreign
gene products both compete for the use of various intra-
cellular resources for the biosynthesis, of amino acids,
nucleotid es as well as m etabolic ener gy. When
recombinant proteins are over-expressed under strong
promoters, a major chunk of the flux of the precursors
are diverted towards heterologous gene expression
(Chou 2007). This gross imbalance in the resource dis-
tribution leads to degradation of cellular health and the
cellular physiology is significantly reprogrammed. We
thus observed that this list contained the maximum
number of up/down-regulated genes. This included the
maj or channels of precursor molecu les like transporters
(artJ, mglB, hisJ, ybeJ, ptsH, sufC, ycdO, gatA, gatB, gatC,
fepA, ompA, actP and mrdB), central intermediary meta-
bolism (pdhR, aceE, aceF, lpdA, and gltA), amino acid
metabolism (argE, argH, entA, entB, entE, entF, aspA
and ubiF) and energy generation pathways genes which
were down-regulated.
glpF, the glycerol facilitator, which helps in facilitated
diffusion of glycerol across the inner membrane of the cell
was found to be down-regulated 3 fold. Down-regulation
of glycerol transport and utilization pathway is a major
bottleneck in achieving high yield of recombinant protein,
and co expression of glpF with target protein has been
reported to increase productivity (Choi et al. 2003). This is
in agreement with the hypothesis that the cell restricts the
supply of precursor molecules in order to slowdown meta-
bolic fluxes and thus restricts foreign protein expression.
We observed that the whole atp operon was down-regu-
lated, supporting the fact that energy generation pathway
are repressed during metabolic stress. Simultaneously the
flagellar motility (fliL, fliN, fliS, fliT) genes were also found
to be down-regulated. A steep proton gradient is required
for flagellar motility between the periplasmic space and
the cytoplasm; decreased motility could indicate energy
deficiency. Probably, the cell strategically also down-regu-
lates genes related to flagellar motility to minimize energy
expenditure, which is in agreement with earlier data
(Jozefczuk et al. 2010). The genes proW and proP help in
maintaining osmotic homeostasis, prevent cell dehydration
and restore membrane turgor (Gunasekera et al. 2008;
Mellies et a l. 1995). These were found to be 6.0 fold and
5.3 fold up-regulated respectively, which is in agreement
with the fact that hyper-expression of recombinant pro-
teins not only affects the biosynthetic pathways but also
leads to the disruption of cellular integrity. Similarly, yaeL
was up-regulated which is activated in responses to
unfolded protein stress (Alba et al. 2002; Be tton et al.
1996; Jones et al. 1997; Mecsas et al. 1993; Missiakas et al.
1996). The pnp gene which encodes for PNPase and has a
role in mRNA degradation during carbon starvation
(Kaplan and Apirion 1974, 1975), was observed to be up-
regulated. Interestingly t hese proteases and genes for
mRNA degradation were not differentially expressed in
case of GFP expression indicating that under lower levels
of recombinant protein expression these stringent
responses were not generated.
Sharma et al. AMB Express 2011, 1:33
/>Page 6 of 12
Comparing soluble and insoluble forms of expression
An interesting comparison of the transcriptomic profile
could be made by looking at those genes which were up
or down-regulated, when xylanase and GFP were
expressed as soluble pr oteins but not during the e xpres-
sion of rhIFN-b (as IBs). In both cases there is a metabolic
flux diversion t owards product formation. How ever with
soluble protein expression, an additional stress is imposed
by the interaction of the soluble protein with the cellular
constituents, which is absent when the product gets
sequestered as IBs. This list of genes is given in Additional
file 5 and a schemati c representing the reactions and
'ůLJĐĞƌŽůͲϯͲƉŚŽƐƉŚĂƚĞ 'ůLJĐĞƌŽů
ŐůƉd ŐůƉ&
dƌĂŶƐƉŽƌƚ
DĂů
DĂůŽƚŽƐĞ
ƚƌĂŶƐƉŽƌƚĞƌ
'Ăƚ ŽƉĞƌŽŶ
'ĂůĂĐƚŝƚŽů
ƚƌĂŶƐƉŽƌƚ
'ůLJĐĞƌŽůнWŝ
'ůLJĐĞƌŽůͲϯͲƉŚŽƐƉŚĂƚĞ
ŐůƉ<
ŐůƉ
ŐůƉ
,W
'ůLJĐĞƌĂůĚĞŚLJĚĞͲϯͲƉŚŽƐƉŚĂƚĞ
'ůƵĐŽƐĞͲϲͲƉŚŽƐƉŚĂƚĞ
&ƌƵĐƚŽƐĞͲϲͲƉŚŽƐƉŚĂƚĞ
WŚŽƐƉŚŽĞŶŽůƉLJƌƵǀĂƚĞ
WLJƌƵǀĂƚĞ
ĐĞƚLJůŽ
'ůLJŽdžĂůĂƚĞ
ĂĐĞ
ĂĐĞ
E,
E
ͺ
Y
K
Ϯ
,
Ϯ
K
^ŽdžZ^
KdžLJZ
,
Ϯ
K
Ϯ
K
Ϯ
ͺ
&,
Ϯ
ŶĚŚ
LJŽͲ
&ŽƌŵĂƚĞ
,
Ϯ
нK
Ϯ
DY
ĂĐĞ&
EƵŽ ŽƉĞƌŽŶ
ƚƉ ŽƉĞƌŽŶ
ƚŶĂ
>ͲĐLJƐƚĞŝŶĞ >ͲdƌLJƉƚŽƉŚĂŶ
/ĐĚ
^ƵĐ
^ƵĐ
LJĚ
WƌŽƉŝŽŶLJů ŽͲ
ƉƌƉ
WƌŽƉŝŽŶĂƚĞ
Figure 3 Schematic diagram showing common genes which were up/down-regulated (fold change ≥ 2) during rhIFN-b, xylanase and
GFP production, along with the processes and reactions they are involved. Red and green colour letters represent up-regulated and
down-regulated genes respectively.
Sharma et al. AMB Express 2011, 1:33
/>Page 7 of 12
processes which are up/down-regulated a re shown in
Figure 5.
The amino acid biosynthetic genes, aroC coding for
chorismate synthase, which is the key branch-point
intermediate in aromatic biosynthesis, leuB and ileS
were among the significantly down-regulated group.
Genes involved in the anapleurotic pathways of TCA
cycle intermediates astD, as well as the glycerol degrada-
tion genes encoded by glpABC operon which provides
intermediaries to the glycolytic pathways were also
down-reg ulated. The rate limiting steps of both glyco ly-
sisaswellasTCAcycleweredown-regulatedwhich
would result in retarded substrate utilization and energy
generation pathways.
sapA is well known as a peptide transporter which is
part of the defence degradation system in E.coli (Parra-
Lopez et al. 1993). Along with this ATP binding to SapD
has also been shown to be sufficient for restoring K
+
uptake in E. coli via its two Trk potassium transporters
(Harms et al. 2001). There was a significant down-regula-
tion of sapA involved in potassium uptake in E. coli indi-
cating that there is a decline in nutrient uptake and
oxygen consumption rate of the cell (Harms et al. 2001).
Similarly the fadJ gene which is a part of the anaerobic b-
oxidation of fatty acids was also down-regulated suggest-
ing that the cells were not able to use fatty acids as car-
bon and energy source (Campbell et al. 2003). In E. coli,
fpr participates in the synthesis of methionine,
'ůLJĐĞƌŽůͲϯͲƉŚŽƐƉŚĂƚĞ 'ůLJĐĞƌŽů
ŐůƉd ŐůƉ&
Wd^dƌĂŶƐƉŽƌƚ
ƉƚƐ,
ŵĂŶ
Ɛƌů
^ŽƌďŝƚŽů
ŐĂƚ
'ĂůĂĐƚŝƚŽů
ĂĐƚW
ĐĞƚĂƚĞͬ'ůLJĐŽůĂƚĞ
ƚƌĂŶƐƉŽƌƚĞƌ
dƌĂŶƐƉŽƌƚĞƌ
ŚŝƐ:
,ŝƐƚŝĚŝŶĞƚƌĂŶƐƉŽƌƚĞƌ
Őůƚ
'ůƵƚĂŵĂƚĞƚƌĂŶƐƉŽƌƚĞƌ
ĐLJƐt
^ƵůƉŚĂƚĞͬƚŚŝŽƐƵůƉŚĂƚĞ
ƚƌĂŶƐƉŽƌƚĞƌ
Ăƌƚ:
ƌŐŝŶŝŶĞƚƌĂŶƐƉŽƌƚĞƌ
ŵŐů
zŝĨ
WƌŽz
WƌŽůŝŶĞWƚƌĂŶƐƉŽƌƚĞƌ
WƌŽW
KƐŵŽƐĞŶƐŽƌLJ
D&^ƚƌĂŶƐƉŽƌƚĞƌ
WƌŽt
WƌŽůŝŶĞƚƌĂŶƐƉŽƌƚĞƌ
ŵĂƌZ
DƵůƚŝƉůĞŶƚŝďŝŽƚŝĐ
ƌĞƐŝƐƚĂŶĐĞ
'ůLJĐĞƌŽůнWŝ
'ůLJĐĞƌŽůͲϯͲƉŚŽƐƉŚĂƚĞ
ŐůƉ<
'ůLJĐĞƌŽƉŚŽƐƉŚŽ
ĚŝĞƐƚĞƌ
ŐůƉY
ŐůƉ
ŐůƉ
,W
'ůLJĐĞƌĂůĚĞŚLJĚĞͲϯͲƉŚŽƐƉŚĂƚĞ
'ůƵĐŽƐĞͲϲͲƉŚŽƐƉŚĂƚĞ
&ƌƵĐƚŽƐĞͲϲͲƉŚŽƐƉŚĂƚĞ
WŚŽƐƉŚŽĞŶŽůƉLJƌƵǀĂƚĞ
WLJƌƵǀĂƚĞ
ĐĞƚLJůŽ
'ůƵĐŽƐĞͲϭͲƉŚŽƐƉŚĂƚĞ
ƉŐŵ
ͲŐůƵĐŽƐĞ
LJŝŐ>
&ĂƚƚLJĐŝĚ
ǺͲKdžŝĚĂƚŝŽŶ
ŽͲ&ĂƚƚLJĂĐŝĚ
ƉƉƐ
^ŽƌďŝƚŽůͲϲͲ
ƉŚŽƐƉŚĂƚĞ
Ɛƌů
'ůLJŽdžĂůĂƚĞ
ƚŚLJůĞŶĞ
ŐůLJĐŽů
'ůLJĐŽůĂƚĞ
ĂĐĞ
ĂĐĞ
ĂĐƐ
ͲƌŝďƵůŽƐĞ
ͲϱͲƉŚŽƐƉŚĂƚĞ
ĂĐƐ
ĂůĚ
>ͲůĂĐƚĂůĚĞŚLJĚĞ
ĂůĚ
ŵŝŶŽĂĐŝĚDĞƚĂďŽůŝƐŵ
ĂƌŐ'
ŝůǀ/
ŝůǀz
LJďĞ:
WƌŽƉŝŽŶĂƚĞ
E,
E
ͺ
Y
K
Ϯ
,
Ϯ
K
^ŽdžZ^
KdžLJZ
,
Ϯ
K
Ϯ
K
Ϯ
ͺ
&,
Ϯ
ŶĚŚ
LJŽͲ
Ɛ
Ž
Ě
&ŽƌŵĂƚĞ ,
Ϯ
нK
Ϯ
DY
ŐŶĚ
Őůƚ
Figure 4 Schematic diagram showing common g enes which are up/down-regulated (fold change ≥ 2) durin g rhIFN-b and xylanase
but not in GFP, along with the processes and reactions they are involved. Red and green colour letters represent up-regulated and down-
regulated genes respectively. (In Fig 4 and Fig 5, Black colour genes are those genes which are not present in the common gene list or does
not pass the fold change cut off criteria but shown only to maintain the continuity of the steps in the important pathways)
Sharma et al. AMB Express 2011, 1:33
/>Page 8 of 12
dissimilation of pyruvate, and synthesis of deoxyribonu-
cleotides. The latter two reactions are anaerobic pro-
cesses. In all cases, fpr functions together with flavodoxin
in the transfer of electrons from NADPH to an acceptor
(Bianchi et al. 1995; Ow et al. 2006) and this was also
found to be down-regu lated. atpC component of ATP
Synthase F1 complex was down-regulated. These results
indicate that the expression of a soluble protein leads to
an enhanced suppression of key metabol ic pathways,
adversely affecting the cellular health and productivity of
the host.
Discussion
It was observed that the cellular response to the diver-
sion of metabolites for product formation, is at multiple
levels directed both at growth rate and protein produc-
tion. Since growth rate and protein synthesis share com-
mon pathways, this stress response hits both processes
simultaneously, affirming previous reports on the
growth associated nature of recombinant protein pro-
duction (Bentley et al. 1990; Shin et al. 1998). The stress
response first affects the carbon uptake by down-regu-
lating various transporters and this phenomenon was
'ůLJĐĞƌŽůͲϯͲƉŚŽƐƉŚĂƚĞ 'ůLJĐĞƌŽů
ŐůƉd ŐůƉ&
ŐŶƚW h͕ŝĚŶd
'ůƵĐŽŶĂƚĞ
ƚƌĂŶƐƉŽƌƚĞƌ
ƐĂƉ
WĞƉƚŝĚĞ
ƵƉƚĂŬĞ
'ůLJĐĞƌŽůнWŝ
'ůLJĐĞƌŽůͲϯͲƉŚŽƐƉŚĂƚĞ
ŐůƉ<
ŐůƉ
ŐůƉ
,W
'ůLJĐĞƌĂůĚĞŚLJĚĞͲϯͲƉŚŽƐƉŚĂƚĞ
'ůƵĐŽƐĞͲϲͲ
ƉŚŽƐƉŚĂƚĞ
&ƌƵĐƚŽƐĞͲϲͲƉŚŽƐƉŚĂƚĞ
WŚŽƐƉŚŽĞŶŽůƉLJƌƵǀĂƚĞ
WLJƌƵǀĂƚĞ
ĐĞƚLJůŽ
'ůLJŽdžĂůĂƚĞ
ĂĐĞ
ĂĐĞ
ƚƉ ŽƉĞƌŽŶ
/ĐĚ
^ƵĐ
^ƵĐ
'ůƵĐŽŶĞŽŐĞŶĞƐŝƐ
ŵĂůĂƚĞ
ŵĂĞ ůĞƵ
ůĞƵĐŝŶĞ
ĐLJƐtͬĐLJƐ:
^ƵůĨĂƚĞͬdŚŝŽƐƵůĨĂƚĞ
ƚƌĂŶƐƉŽƌƚ
ŵĂů
DĂůƚŽƐĞ
ƚƌĂŶƐƉŽƌƚ
ŽͲ
&ĂƚƚLJĂĐŝĚ
ĨĂĚ:
ŵŝŶŽĐŝĚ
ŵĞƚĂďŽůŝƐŵ
ĂƌŽ
ůĞƵ
ŝůĞ^
ĂƌŐŝŶŝŶĞ
ĂƐƚ
Figure 5 Schematic diagram showing common genes which are up/down-regulated (fold change ≥ 2) during GFP and xylanase but
not in rhIFN-b, along with the processes and reactions they are involved. Red and green colour letters represent up-regulated and down-
regulated genes respectively.
Sharma et al. AMB Express 2011, 1:33
/>Page 9 of 12
observed for all the conditions irrespective of the nature
and level of recombinant protein expression. Simulta-
neously the carbon utilization and energy generation
pathways starting from Glycolysis, TCA to electron
transport chain were severely repressed resulting in
decreased growth yield, product formation and viability
of the cell population as has been shown by Hardiman
et al. (2007).
Interestingly, there was a significant time lag between
this transcriptomic down regulation and its resultant
phenotype. Thus the metabolic activity which is linked
to substrate uptake rate fell only after 4 hours post-
induction. The down-regulation of energy generating
pathways also lead s to a drop in growth rate (Kasimoglu
et al. 1996; Troein et al. 2007) which was also observed
in the present case. It has been previously reported that
in complex medium, several genes of energy generating
pathways such as hycB, cyoA, cydA, and ndh,were
down-regulated, along with the ATP synthase gene (Oh
and Liao 2000), which is similar to our observations.
The addition targets of this metabolic stress response
were the amino acid uptake, peptide uptake and amino
acid biosynthetic pathways. Interestingly amino acid
uptake and biosynthesis was significantly repressed only
when soluble proteins were expressed under different
promoters, whereas these pathways were not signifi-
cantly affected when the recombinant protein was
expressed as an inclusion body.
We observed that hyper-expression of recombinant pro-
tein tends to generate a very strong response where several
pathways are affected, most import antly the transporters
and the cellular degradation machinery like the osmopro-
tectants (proP and proW), proteases (yaeL)andmRNA
degradation (pnp). All these genes were highly up-regu-
lated during protein production with the T7 promoter
(rhIFN-b and xylanase), whereas these were not signifi-
cantly affected during protein production with the weaker
ara promoter. The large fold changes in the genes asso-
ciated with transport is an indication of cellular shutdown.
Simultaneously the cell loses its osmotolerant property
along with an increase in protease and mRNA degradation
activity.
We can there fore conclude that both the nature and
level of recombinant protein expression leads to the
generation of a common as well as a differential stress
response. Host cell engineering should take into account
the nature of protein to be expressed for designing
improved platforms for over-expression.
Additional material
Additional file 1: Pre-induction graphs for fed-batch fermentation
of GFP.OD
600
Vs Time. OUR(mol/l/h) Vs Time. CER(mol/l/h) Vs Time. OUR
(mol/l/h) Vs RPM
2
. CER(mol/l/h) Vs RPM
2
Additional file 2: Experimental design for data analysis. a) Set of up/
down-regulated gene across different time points (2 h, 4 h and 6 h). b)
Set of genes up -regulated in rhIFN-b, xylanase and GFPpe) Set of genes
down-regulated in rhIFN-b, xylanase and GFP.pc) Set of genes up
-regulated in rhIFN-b and xylanase but not in GFP.pf) Set of genes down-
regulated in rhIFN-b and xylanase but not in GFP. d) Set of genes up
-regulated in xylanase and GFP but not in rhIFN-b. g) Set of genes
down-regulated in xylanase and GFP but not in rhIFN-b.
Additional file 3: List of common genes present during expression
of rhIFN-b, xylanase and GFP with their log2 fold change values
(fold change ≥ 2).
Additional file 4: List of common genes present during expression
of rhIFN-b and xylanase but not in GFP, along with their log2 fold
change values (fold change ≥ 2).
Additional file 5: List of common genes present during expression
of GFP and xylanase but not in rhIFN-b, along with their log2 fold
change values (fold change ≥ 2).
Acknowledgements
Financial support by Department of Biotechnology, Department of Science
and Technology Purse, Council of Scientific and Industrial Research,
Government of India is deeply acknowledged.
Competing interests
The authors declare that they have no competing interests.
Received: 26 June 2011 Accepted: 22 October 2011
Published: 22 October 2011
References
Acosta-Rivero N, Sanchez JC, Morales J (2002) Improvement of human interferon
HUIFNalpha2 and HCV core protein expression levels in Escherichia coli but
not of HUIFNalpha8 by using the tRNA(AGA/AGG). Biochemical and
biophysical research communications 296(5):1303–1309. doi:10.1016/S0006-
291X(02)02056-9.
Alba BM, Leeds JA, Onufryk C, Lu CZ, Gross CA (2002) DegS and YaeL participate
sequentially in the cleavage of RseA to activate the sigma(E)-dependent
extracytoplasmic stress response. Genes & development 16(16):2156–2168.
doi:10.1101/gad.1008902.
Babaeipour V, Shojaosadati SA, Robatjazi SM, Khalilzadeh R, Maghsoudi N (2007)
Over-production of human interferon-[gamma] by HCDC of recombinant.
Escherichia coli. Process Biochemistry 42(1):112–117
Bentley WE, Mirjalili N, Andersen DC, Davis RH, Kompala DS (1990) Plasmid-
encoded protein: the principal factor in the “metabolic burden” associated
with recombinant bacteria. Biotechnol Bioeng 35(7):668–681. doi:10.1002/
bit.260350704.
Betton JM, Boscus D, Missiakas D, Raina S, Hofnung M (1996) Probing the
structural role of an alpha beta loop of maltose-binding protein by
mutagenesis: heat-shock induction by loop variants of the maltose-binding
protein that form periplasmic inclusion bodies. Journal of molecular biology
262(2):140–150. doi:10.1006/jmbi.1996.0504.
Bhattacharya P, Pandey G, Srivastava P, Mukherjee K (2005) Combined effect of
protein fusion and signal sequence greatly enhances the production of
recombinant human GM-CSF in Escherichia coli. Molecular Biotechnology
30(2):103–115. doi:10.1385/MB:30:2:103.
Bianchi V, Haggard-Ljungquist E, Pontis E, Reichard P (1995) Interruption of the
ferredoxin (flavodoxin) NADP+ oxidoreductase gene of Escherichia coli does
not affect anaerobic growth but increases sensitivity to paraquat. Journal of
bacteriology 177(15):4528–4531
Bolstad BM, Irizarry RA, Astrand M, Speed TP (2003) A comparison of normalization
methods for high density oligonucleotide array data based on variance and
bias. Bioinformatics 19(2):185–193. doi:10.1093/bioinformatics/19.2.185.
Bowers LM, Lapoint K, Anthony L, Pluciennik A, Filutowicz M (2004) Bacterial
expression system with tightly regulated gene expression and plasmid copy
number. Gene 340(1):11–18. doi:10.1016/j.gene.2004.06.012.
Sharma et al. AMB Express 2011, 1:33
/>Page 10 of 12
Campbell JW, Morgan-Kiss RM, Cronan EJ (2003) A new Escherichia coli metabolic
competency: growth on fatty acids by a novel anaerobic β-oxidation
pathway. Mol Microbiol 47(3):793–805. doi:10.1046/j.1365-2958.2003.03341.x.
Choi JH, Lee SJ, Lee SY (2003) Enhanced production of insulin-like growth factor
I fusion protein in Escherichia coli by coexpression of the down-regulated
genes identified by transcriptome profiling. Appl Environ Microbiol
69(8):4737–4742. doi:10.1128/AEM.69.8.4737-4742.2003.
Chou CP (2007) Engineering cell physiology to enhance recombinant protein
production in Escherichia coli. Appl Microbiol Biotechnol 76(3):521–532.
doi:10.1007/s00253-007-1039-0.
Durrschmid K, Reischer H, Schmidt-Heck W, Hrebicek T, Guthke R, Rizzi A, Bayer K
(2008) Monitoring of transcriptome and proteome profiles to investigate the
cellular response of E. coli towards recombinant protein expression under
defined chemostat conditions. J Biotechnol 135(1):34–44. doi:10.1016/j.
jbiotec.2008.02.013.
Gill RT, Valdes JJ, Bentley WE (2000) A comparative study of global stress gene
regulation in response to overexpression of recombinant proteins in
Escherichia coli. Metab Eng 2(3):178–189. doi:10.1006/mben.2000.0148.
Gunasekera TS, Csonka LN, Paliy O (2008) Genome-wide transcriptional responses
of Escherichia coli K-12 to continuous osmotic and heat stresses. Journal of
bacteriology 190(10):3712–3720. doi:10.1128/JB.01990-07.
Gupta JC, Jaisani M, Pandey G, Mukherjee KJ (1999) Enhancing recombinant protein
yields in Escherichia coli using the T7 system under the control of heat inducible
λPL promoter. J Biotechnol 68(2-3):125–134. doi:10.1016/S0168-1656(98)00193-X.
Haddadin FT, Harcum SW (2005) Transcriptome profiles for high-cell-density
recombinant and wild-type Escherichia coli. Biotechnol Bioeng 90(2):127–153.
doi:10.1002/bit.20340.
Hale RS, Thompson G (1998) Codon optimization of the gene encoding a
domain from human type 1 neurofibromin protein results in a threefold
improvement in expression level in Escherichia coli. Protein Expression and
Purification 12(2):185–188. doi:10.1006/prep.1997.0825.
Harms C, Domoto Y, Celik C, Rahe E, Stumpe S, Schmid R, Nakamura T, Bakker EP
(2001) Identification of the ABC protein SapD as the subunit that confers ATP
dependence to the K+-uptake systems Trk(H) and Trk(G) from Escherichia coli
K-12. Microbiology 147(Pt 11):2991–3003
Hua Q, Yang C, Oshima T, Mori H, Shimizu K (2004) Analysis of gene expression
in Escherichia coli in response to changes of growth-limiting nutrient in
chemostat cultures. Appl Environ Microbiol 70(4):2354–2366. doi:10.1128/
AEM.70.4.2354-2366.2004.
Joly JC, Swartz JR (1997) In vitro and in vivo redox states of the Escherichia coli
periplasmic oxidoreductases DsbA and DsbC. Biochemistry
36(33):10067–10072. doi:10.1021/bi9707739.
Jones CH, Danese PN, Pinkner JS, Silhavy TJ, Hultgren SJ (1997) The chaperone-
assisted membrane release and folding pathway is sensed by two signal
transduction systems. The EMBO journal 16(21):6394–6406. doi:10.1093/
emboj/16.21.6394.
Jones KL, Kim SW, Keasling JD (2000) Low-copy plasmids can perform as well as
or better than high-copy plasmids for metabolic engineering of bacteria.
Metab Eng 2(4):328–338. doi:10.1006/mben.2000.0161.
Jozefczuk S, Klie S, Catchpole G, Szymanski J, Cuadros-Inostroza A, Steinhauser D,
Selbig J, Willmitzer L (2010) Metabolomic and transcriptomic stress response
of Escherichia coli
. Molecular systems biology 6:364
Ka
plan R, Apirion D (1974) The involvement of ribonuclease I, ribonuclease II, and
polynucleotide phosphorylase in the degradation of stable ribonucleic acid
during carbon starvation in Escherichia coli. The Journal of biological chemistry
249(1):149–151
Kaplan R, Apirion D (1975) Decay of ribosomal ribonucleic acid in Escherichia coli cells
starved for various nutrients. The Journal of biological chemistry
250(8):3174–3178
Kasimoglu E, Park SJ, Malek J, Tseng CP, Gunsalus RP (1996) Transcriptional
regulation of the proton-translocating ATPase (atpIBEFHAGDC) operon of
Escherichia coli: control by cell growth rate. Journal of bacteriology
178(19):5563–5567
Kiefer H, Vogel R, Maier K (2000) Bacterial expression of G-protein-coupled
receptors: prediction of expression levels from sequence. Receptors &
channels 7(2):109–119
Kim YS, Seo JH, Cha HJ (2003) Enhancement of heterologous protein expression
in Escherichia coli by co-expression of nonspecific DNA-binding stress
protein, Dps. Enzyme and Microbial Technology 33(4):460–465. doi:10.1016/
S0141-0229(03)00148-0.
Kurland CG, Dong H (1996) Bacterial growth inhibition by overproduction of
protein. Mol Microbiol 21(1):1–4. doi:10.1046/j.1365-2958.1996.5901313.x.
Mecsas J, Rouviere PE, Erickson JW, Donohue TJ, Gross CA (1993) The activity of
sigma E, an Escherichia coli heat-inducible sigma-factor, is modulated by
expression of outer membrane proteins. Genes & development
7(12B):2618–2628. doi:10.1101/gad.7.12b.2618.
Meerman HJ, Georgiou G (1994) Construction and characterization of a set of E.
coli strains deficient in all known loci affecting the proteolytic stability of
secreted recombinant proteins. Bio/technology 12(11):1107–1110.
doi:10.1038/nbt1194-1107.
Mellies J, Wise A, Villarejo M (1995) Two different Escherichia coli proP promoters
respond to osmotic and growth phase signals. Journal of bacteriology
177(1):144–151
Missiakas D, Betton JM, Raina S (1996) New components of protein folding in
extracytoplasmic compartments of Escherichia coli SurA, FkpA and Skp/
OmpH. Mol Microbiol 21(4):871–884. doi:10.1046/j.1365-2958.1996.561412.x.
Nobelmann B, Lengeler JW (1996) Molecular analysis of the gat genes from
Escherichia coli and of their roles in galactitol transport and metabolism.
Journal of bacteriology 178(23):6790–6795
Oh MK, Liao JC (2000) DNA microarray detection of metabolic responses to
protein overproduction in Escherichia coli. Metab Eng 2(3):201–209.
doi:10.1006/mben.2000.0149.
Ow DS-W, Nissom PM, Philp R, Oh SK-W, Yap MG-S (2006) Global transcriptional
analysis of metabolic burden due to plasmid maintenance in Escherichia coli
DH5[alpha] during batch fermentation. Enzyme and Microbial Technology
39(3):391–398. doi:10.1016/j.enzmictec.2005.11.048.
Ow DS, Lim DY, Nissom PM, Camattari A, Wong VV (2010) Co-expression of Skp
and FkpA chaperones improves cell viability and alters the global expression
of stress response genes during scFvD1.3 production. Microb Cell Fact 9:22.
doi:10.1186/1475-2859-9-22.
Parra-Lopez C, Baer MT, Groisman EA (1993) Molecular genetic analysis of a locus
required for resistance to antimicrobial peptides in Salmonella typhimurium.
The EMBO journal 12(11):4053–4062
Perez-Rueda E, Collado-Vides J (2000) The repertoire of DNA-binding
transcriptional regulators in Escherichia coli K-12. Nucleic Acids Res
28(8):1838–
1847. doi:10.1093/nar/28.8.1838.
Pe
rrenoud A, Sauer U (2005) Impact of global transcriptional regulation by ArcA,
ArcB, Cra, Crp, Cya, Fnr, and Mlc on glucose catabolism in Escherichia coli.
Journal of bacteriology 187(9):3171–3179. doi:10.1128/JB.187.9.3171-3179.2005.
Plumbridge J (2002) Regulation of gene expression in the PTS in Escherichia coli:
the role and interactions of Mlc. Current opinion in microbiology
5(2):187–193. doi:10.1016/S1369-5274(02)00296-5.
Ramalingam S, Gautam P, Mukherjee KJ, Jayaraman G (2007) Effects of post-
induction feed strategies on secretory production of recombinant
streptokinase in Escherichia coli. Biochemical Engineering Journal 33(1):34–41.
doi:10.1016/j.bej.2006.09.019.
Ratelade J, Miot MC, Johnson E, Betton JM, Mazodier P, Benaroudj N (2009)
Production of recombinant proteins in the lon-deficient BL21(DE3) strain of
Escherichia coli in the absence of the DnaK chaperone. Appl Environ
Microbiol 75(11):3803–3807. doi:10.1128/AEM.00255-09.
Russell JB, Cook GM (1995) Energetics of bacterial growth: balance of anabolic
and catabolic reactions. Microbiological reviews 59(1):48–62
Seo JH, Bailey JE (1985) Effects of recombinant plasmid content on growth
properties and cloned gene product formation in Escherichia coli. Biotechnol
Bioeng 27(12):1668–1674. doi:10.1002/bit.260271207.
Shin CS, Hong MS, Kim DY, Shin HC, Lee J (1998) Growth-associated synthesis of
recombinant human glucagon and human growth hormone in high-cell-
density cultures of Escherichia coli. Appl Microbiol Biotechnol 49(4):364–370.
doi:10.1007/s002530051183.
Srivastava P, Mukherjee KJ (2005) Kinetic studies of recombinant human interferon-
alpha (rhIFN-[alpha]) expression in transient state continuous cultures.
Biochemical Engineering Journal 26(1):50–58. doi:10.1016/j.bej.2005.06.004.
Suzuki M, Roy R, Zheng H, Woychik N, Inouye M (2006) Bacterial bioreactors for
high yield production of recombinant protein. The Journal of biological
chemistry 281(49):37559–37565. doi:10.1074/jbc.M608806200.
Troein C, Ahren D, Krogh M, Peterson C (2007) Is transcriptional regulation of
metabolic pathways an optimal strategy for fitness? PLoS One 2(9):e855.
doi:10.1371/journal.pone.0000855.
Vaiphei ST, Pandey G, Mukherjee KJ (2009) Kinetic studies of recombinant human
interferon-gamma expression in continuous cultures of E. coli J Ind Microbiol
Biotechnol 36(12):1453–1458. doi:10.1007/s10295-009-0632-x.
Sharma et al. AMB Express 2011, 1:33
/>Page 11 of 12
Vemuri GN, Minning TA, Altman E, Eiteman MA (2005) Physiological response of
central metabolism in Escherichia coli to deletion of pyruvate oxidase and
introduction of heterologous pyruvate carboxylase. Biotechnol Bioeng
90(1):64–76. doi:10.1002/bit.20418.
Wild J, Szybalski W (2004) Copy-control tightly regulated expression vectors
based on pBAC/oriV. Methods in molecular biology 267:155–167
doi:10.1186/2191-0855-1-33
Cite this article as: Sharma et al.: Comparative transcriptomic profile
analysis of fed-batch cultures expressing different recombinant proteins
in Escherichia coli. AMB Express 2011 1:33.
Submit your manuscript to a
journal and benefi t from:
7 Convenient online submission
7 Rigorous peer review
7 Immediate publication on acceptance
7 Open access: articles freely available online
7 High visibility within the fi eld
7 Retaining the copyright to your article
Submit your next manuscript at 7 springeropen.com
Sharma et al. AMB Express 2011, 1:33
/>Page 12 of 12