Great Predators in the Political Economy of Development_8 pptx
Bạn đang xem bản rút gọn của tài liệu. Xem và tải ngay bản đầy đủ của tài liệu tại đây (283.47 KB, 20 trang )
bridge the equity gap through public funds. But even if true, the argu-
ment only runs to suggesting that the IFC provides indirect support for
the other more mercenary partners!
The Great Predators also seek to differentiate themselves and estab-
lish developmental credentials by claiming to be trustworthy and
reputable, which in turn reduces risk for others. Their publications are
replete with references to status, experience, expertise and worldwide
contacts. They also claim to have important friends, not least the home
‘creditor’ government who can wade in to remind the hosts of their
obligations, should the need arise. This has meant, over time, that DFI
investments have become clustered in countries where purposive
promises on the macroeconomic environment are in place, such as a
structural adjustment programme or more latterly poverty reduction
strategy (PRS), or in countries which have gone furthest in signing up
to voluntary treaties and codes of practice which tie countries in to the
governance modalities of the neoliberal order. An example would be
the Financial Action Task Force recommendations, and the OECD
‘Convention on Combating the Bribery of Foreign Public Officials in
International Business Transactions’ of 1999.
These more recent trends in the codification of neoliberalism illus-
trate some fundamental problems with the business principles as
outlined above. Globally now, there is little new, embryonic or catalytic
to be invented or discovered: frontiers to global capitalism just do not
exist to justify the IFIs in their promise to not displace someone. In fact
their habit of clustering investments in managed climates suggests just
the opposite, that nice middle-income countries with a relatively
advanced investment climate are preferred. Altenburg (2005) claims
that public–private partnerships for development (and DFIs often
head these) have three potential positive effects: increased resources;
deployment of extra (private sector, often) expertise in development;
and innovative approaches that would not occur to traditional aid
organisations. However, Altenburg also notes the risk of public
resources being wasted on viable projects which commercial banks
would have financed anyway, which is sometimes termed the ‘wind-
fall waste’ problem (as in Storey and Williams 2006: 12, who cited
Altenburg 2005). Conversely, and in contradistinction to the windfall
waste problem, is that the potential investment has no private interest
because it is dumb or unprofitable.
Taking just one example from chapter 7 – the Asian Development
Bank (ADB) fund support for mobile telephony in Afghanistan – illus-
trates how many of the benefits of development assistance to the
private sector can be refuted. The telephone loan was an intervention
in an already developing marketplace, where there were already two
other mobile network suppliers and a government-run fixed line
MONEY AND POWER
[ 146 ]
Bracking_09_cha08.qxd 13/02/2009 10:56 Page 146
supplier, which suggests it might be a example of the windfall waste
problem. In fact under European regulations which regulate ‘state aid’
such a subsidy would face problems in the EU as market distorting,
privileging as it does just one participant. In this case the company in
question was offering village phone services to meet the needs of the
rural poor, and also cash transfer services through the network to allow
Afghans to use the phones to make remittances, or cash transfers, to
relatives (which, not uncoincidently, allows informal remittance trans-
fers to be regulated and monitored) (ADB 2006). These elements of
added value could be used in defence of public support, a ‘public good
value added’, but the question doesn’t go away of why this particular
loan is ‘developmental’, or why this particular company is more
deserving than its rivals and nor does the suspicion, in this particular
case, that security interests also played a role in the selection. Storey
and Williams’s (2006) summary of the problems of DFIs remains: they
either pick up losers in the market or they generate market distortions.
The European Development Finance Institutions
A Monopolies and Mergers Commission (MMC) report of 1992
provides an interesting exercise on measuring private sector develop-
ment more widely, as well as a rare insight on the profitability of the
Great Predators. The MMC ranked the profitability of the CDC and
other bilateral equivalents in terms of the gross income that each
organisation received on its investments, expressed as a percentage of
its investments for the financial year 1990–91 (MMC 1992: 147). The
German DEG (German Finance Company for Investments in Devel-
oping Countries) was the most profitable at 10.3 per cent, followed by
3i (10.3%); EDESA (Luxembourg, 10.2%); OPIC (United States, 9.1%);
IFC (Bretton Woods institutions, 8.8%); SIFIDA (Luxembourg, 8.0%);
EIB (Europe, 7.8%); IFU (Denmark, 7.8%); CDC (UK, 7.4%); FMO
(Netherlands, 6.4%); SBI (Belgium, 5.0%); and CCCE (now AFD,
France, 5.0%). Of the four organisations deemed most comparable to
the CDC, DEG and IFC show a return, averaged over the two years, a
little higher than CDC, and FMO (Netherlands Development Finance
Company) and IFU (Danish Industrialisation Fund) somewhat lower
(MMC 1992: 147). CDC had also accumulated a significant surplus to
1992 and had not incurred a deficit in any single year since the 1950s
(MMC 1992: 4). All rates of return for DFIs in Europe and North
America were respectable and over 5 per cent in both years, rising to
10 per cent in a number of cases (MMC 1992).
Evidence of large and persistent profits is in contradistinction to the
representation that DFIs give of their work, where profitability is said
to prompt exit and disposal, as the job has ‘been done’. Of course,
PRIVATE SECTOR DEVELOPMENT AND BILATERAL INTERVENTIONS
[ 147 ]
Bracking_09_cha08.qxd 13/02/2009 10:56 Page 147
profits also accrue from the sale itself, while losses can be absorbed by
the wider ‘aid’ budget of the creditor government. For example, in the
1980s, the CDC investment in Tanwat in Tanzania was a failure, but
new money was nonetheless provided, such that losses were
socialised. By comparison, the successful Usutu Pulp Company in
Swaziland was sold off to the private sector proper, in Usutu’s case to
SAPPI of South Africa, by a first tranche in 1990 when Courtaulds sold
its stake and then by means of CDC’s remaining stake in 2000, after the
issue of full South African ownership had been made more palatable to
the Swazi Government following the end of apartheid (Tyler 2008:
9–10). Sufficient numbers of projects were successful, and sufficient
amounts of bad debts were absorbed by sovereign Third World
governments and by the Northern owners of the DFI clubs, to produce
an excellent balance sheet over time. For example, in the Usutu pulp
and paper success story, from 1950 to 2000, CDC committed nearly £18
million to Usutu (much more in today’s values) and all loans were
repaid with interest to make a compound return of approximately 13
per cent per annum in sterling terms on its equity (Tyler 2008: 11).
Table 8.2 summarises the scale of activities of the CDC and eleven
comparators in 1991, compiled for the MMC Review, ordered by the
balance sheet value of investments (the largest, the European Invest-
ment Bank (EIB), heads the table) (MMC 1992). As can be seen from the
table, nine of the twelve organisations are wholly or partially owned
by governments, while the three private groups (EDESA, 3i and
SIFIDA) were owned by consortia of banks and large US and European
industrial companies (MMC 1992: 146). Most of the organisations were
making investments in the form of equity and loans, with EIB and
OPIC investing in only loan form, and the French CCCE, now AFD,
being predominantly loan-orientated. It is only later through the 2000s
that the grant component of, for example, EIB money was increased.
The CDC and other DFIs were making investments entirely in poorer
countries, while the EIB was predominantly focused on the EC (90 per
cent of loans), but also provided financing outside the EC in the 69
African, Caribbean and Pacific (ACP) countries, twelve Mediterranean
countries and several in Central and Eastern Europe (MMC 1992:
146–7; EIB 1992). This profile is interesting in that current debt cancel-
lations can be traced back predominantly to development finance
extended in this model, at near market rate loans, and as such the
future failures through the 1990s and 2000s must be contextualised
within the commercial risk model with its attendant provisioning. In
other words, any full value write-offs suggest a greater generosity on
the part of creditors than the actual book value of the debt would
justify, since this would have been written down against its relevant
provisioning many times in the years that followed.
MONEY AND POWER
[ 148 ]
Bracking_09_cha08.qxd 13/02/2009 10:56 Page 148
At the time of the MMC review, the organisations were looking
healthy. The size of the US contribution is confusing, however, since
while the Overseas Private Investment Corporation (OPIC) is ranked
ninth in the table, it also had extensive US Treasury securities at its
disposal for the purposes of insurance and investment risk guarantees.
The scale of US export credit and investment insurance is also severely
underestimated here since there were also other quasi-public and
private organisations in the United States with similar functions: the
Export–Import Bank (Eximbank), the chief government agency; the
Foreign Credit Insurance Association (FCIA), which is an unincorpo-
rated association of private commercial insurance companies
operating in co-operation with Eximbank to provide export credit
insurance; and the Private Export Funding Corporation (PEFCO)
(Eiteman et al. 1992: 539–41). Eximbank is the US equivalent to the
UK’s Export Credit Guarantee Department (ECGD) (see chapter 5). It
was established in 1934, primarily to stimulate and facilitate trade to
the Soviet Union, and was rechartered in 1945 to provide for its present
global reach. Eximbank facilitates the financing of US exports by
insuring export loans extended by US banks to foreign borrowers, and
by a direct-lending operation with private partners (to ensure it
compliments with, rather than competes with them), to lend dollars to
borrowers outside the United States for the purchase of US goods and
services. At this time, Eximbank was also providing financing to cover
the preparation costs incurred by US companies for engineering, plan-
ning and feasibility studies for non-US clients on large capital projects;
a perk that, as we saw in the last chapter, helped to skew derivative
business into the hands of creditor states. The US Government under-
writes each institution. In the case of PEFCO, this provides a subsidy
to a coalition of private interests with particular exporting interests
since all PEFCO’s loans are guaranteed by Eximbank, allowing PEFCO
to undertake no (costly) evaluation of credit risks or appraisal of
country conditions itself. PEFCO’s stockowners are predominantly
commercial banks, 49 in 1992, dropping to 24 in 2008.
For the common affairs of the European bourgeoisie
When combined, the available value that these institutions can put into
global liquidity is small compared to private markets in the core areas
of the world system such as North America and Europe, but large rela-
tive to smaller markets in the poorest countries, and also large relative
to the members’ contributions. This is because the actual amounts
members pay in are only tiny: the bulk of the money is then subse-
quently raised on capital markets using the reputation of the members.
This reputation of members means that the risk of non payment is
PRIVATE SECTOR DEVELOPMENT AND BILATERAL INTERVENTIONS
[ 149 ]
Bracking_09_cha08.qxd 13/02/2009 10:56 Page 149
MONEY AND POWER
[ 150 ]
Table 8.2 Financial performance of CDC and eleven comparable
organisations in 1990–91
Name of Status Country Balance
organisation
(a)
of origin sheet value of
investments,
1990–91
(b)
(£ mill.)
EIB Established under Treaty of EC 43,965
Rome. Owned by member
states of EU
CCCE
(c)
Public institution France 6,151
IFC Shareholders are the member International, BWI 2,385
countries
3i Private company. UK 2,312
Shareholders are UK banks
CDC Public corporation UK 957
DEG Limited liability company Germany 304
owned by government
FMO Public limited company with Netherlands 216
government as 51%
shareholder
IFU Autonomous fund established Denmark 64
by Act of Parliament
OPIC Government body United States 33
(d)
SBI Company majority Belgium 25
government-owned with
private shareholders
SIFIDA Private company Luxembourg 22
EDESA Private company. Luxembourg 19
Shareholders are European
banks and international
industrial companies
Total 56,453
Notes:
(a) Names of organisations in full: BWI (Bretton Woods institutions), CCCE (Caisse Centrale de Cooper-
ation Economique), CDC (Commonwealth Development Corporation), DEG (Deutsche Investitions und
Entwicklungsgesellschaft mbH), EDESA (EDESA SA), EIB (European Investment Bank), FMO (Neder-
landse Financierings-Maatschappij voor Ontwikkelingslanden), IFC (International Finance Corporation),
IFU (Industrialiseringsfonden for Udviklingslandene), OPIC (Overseas Private Investment Corporation),
SBI (Société Belge d'Investissement International SA), SIFIDA (SIFIDA Investment), and 3i (3i Group plc).
(b) Year ends falling within the range July 1990 and 30 June 1991 as 1990–91.
(c) CCCE is now known as the Agence Française de Développement (AFD).
(d) Also has £833 million of US Treasury securities to back up its export credit insurance and investment
risk guarantee activities.
Source: Monopolies and Mergers Commission (1992), Commonwealth Development Corporation: A Report on
the Efficiency and Costs of, and the Services Provided by, the Commonwealth Development Corporation (London,
HMSO), June. Compiled from Appendix 4.2: Financial performance of CDC and eleven comparable
organisations, tables 1 and 2, pp. 145-6. From the published accounts of the organisations.
Bracking_09_cha08.qxd 13/02/2009 10:56 Page 150
negligible, while investors are also reassured that profits from the
banks are normally generous. For example, the EIB, similarly to the
World Bank, IFC and AfDB that were examined in chapter 4, has only
a small proportion of usable funds provided by member states in the
form of an interest subsidy and ‘risk capital’ drawn from the European
Development Fund or Community budget resources. The bulk of its
resources are borrowed from capital markets, mainly through public
bond issues, where it has been regularly endorsed by the ‘Triple-A’, or
‘AAA’ rating awarded to its securities. There are currently 17 European
members in the European Development Finance Institutions (EDFI)
organisation, with a consolidated portfolio for all EDFI members at
year end of 2007 of €15.1 billion (euros) (EDFI 2007) or $24 billion
(dollars),
1
while members make new commitments every year to the
value of about one-third of their portfolios (EDFI 2006). Furthermore,
since 2004, ten members of the EDFI have formed a joint venture
company – European Financing Partners (EFP) – with the European
Investment Bank (EIB) to support projects in ACP countries with
which the EU has a special relationship under the Cotonou (formerly
Lomé) Agreement (Storey and Williams 2006: 2). Table 8.3 shows
further DFIs not included in the MMC review; a table which owes a
great deal to the work of Storey and Williams (2006). These EDFIs illus-
trate how collective membership of states, which cannot go bankrupt,
create credit resources for other poorer states, which also theoretically,
if not de facto, cannot go bankrupt, using global capital markets.
Table 8.3 shows how most of the European DFIs have a special
responsibility for their own national firms, often having to be in a part-
nership with them, or privilege their interests. Also, however, the set of
institutions often work together. There was, after the onset of the debt
crisis, a sharp growth in the co-financing of projects between the
Bretton Woods institutions, EC bilateral finance companies and
regional development banks, creating a system of finance from a reac-
tive response to crisis. Private funds dried up and DFIs expanded
rapidly. For example, the CDC had long worked with the World Bank
and IFC, mainly on infrastructural projects, but during the 1980s and
1990s increased this co-operation through venture capital and finance
companies, and in the early 1990s, in terms of Africa, by involvement
with the IFC-conceived Africa Project Development Facility (APDF)
2
and Africa Management Services Company (AMSCO) (CDC 1991: 15).
By 1993, some 18 and 20 per cent of CDC’s portfolio was co-financed
with the World Bank and IFC, respectively (HC 1994: 5). The CDC also
expanded alongside other European DFIs under the auspices of the
Interact Group, which initially had been set up in 1972, pending
Britain’s accession to the European Community, as a ‘joint working
group’ to structure co-operation and ‘anonymously entitled the
PRIVATE SECTOR DEVELOPMENT AND BILATERAL INTERVENTIONS
[ 151 ]
Bracking_09_cha08.qxd 13/02/2009 10:56 Page 151
[ 152 ]
Table 8.3 A wider set of European development finance institutions
Name of Status Country Value of Comments
organisation
(a)
of origin investments
AWS Wholly owned by government Austria Austrian Council for Research and Technology Development provides
recommendations for companies and researchers to support. The focus
of the bank is explicitly on supporting Austrian firms to expand overseas,
primarily in new European member states.
BIO 50/50 public-private Belgium By end-2004, The bank provides equity to private companies and financial institutions,
partnership between BIO had a taking a minority stake (generally not more than 35%). Untied to the
government and Belgium committed involvement of Belgian firms.
Corporation for International portfolio of
Investment €49 mill.
SBI-BMI Semi-public investment Belgium SBI-BMI’s Major shareholders include Belgian public institutions, the Federal
company equity capital Investment Company and the Central Bank of Belgium as well as private
currently companies. The bank’s main objective is to co-invest with Belgian
amounts to companies
€33 mill.
COFIDES Majority-owned (61%) Spain Ownership through three public institutions: the Spanish Institute for
by government Foreign Trade, the Institute for Official Credit and the National Innovation
Enterprise. The remaining 39% ownership stake is held by the three
largest commercial banks in Spain: BBVA, SCH and Banco Sabadel.
Spanish Government trust funds used to support Spanish investments
abroad.
Corvinus State-owned Hungary Co-investments with Hungarian industrial investors in foreign countries as
International a minority stakeholder. The bank and its investment partner must
Investment Ltd together control a majority stake in the target company.
Bracking_09_cha08.qxd 13/02/2009 10:56 Page 152
Table 8.3 continued
Name of Status Country Value of Comments
organisation
(a)
of origin investments
DEG DEG is a subsidiary of Germany The board of supervisory directors of the parent bank KfW largely
KfW, a state-owned appointed by the Government, including the chairman and deputy
German bank chairman. Aid is untied.
Finnfund Majority government-owned Finland At end 2004, The state of Finland owns a 79.9% share in Finnfund. Finnvera, the state-
portfolio owned official export credit agency of Finland, owns 20% and the
valued at Confederation of Finnish Industries owns 0.1%. If a project sponsor is not
€91 mill. a Finnish parent company, it must be some other link to Finnish interests.
FMO Majority government-owned Netherlands Investment The Dutch State holds 51%; large Dutch banks hold 42%; the remaining
portfolio of 7% of shares are held by employers’ associations, trade unions, some 100
almost €2 bill. Dutch companies and individual investors. Untied aid, but must conform
with government development cooperation policy.
IFU Wholly state-owned Denmark The total For OECD DAC list of development aid recipients (and with the
equity capital exception of South Africa, GNP per capita less than $2,604). IFU/IØ
for the two participation conditional on presence of Danish co-investor.
funds amounts
to €379 mill.
IØ Wholly state-owned Denmark Focuses on countries in Central and Eastern Europe. Officially
independent, but Minister for Foreign Affairs appoints the Supervisory
Board and the Managing Director. Needs Danish co-investor.
Swedfund Wholly state-owned Sweden At the end of Representatives of the Ministry of Finance and the Ministry of Foreign
2004 had a Affairs sit on the board of directors. The bank’s terms of reference aligned
total invested to government development policy. Swedfund co-operates with the
portfolio of Swedish Trade Council; the Council seeks to make it easier for Swedish
around companies to grow internationally.
€55 mill.
[ 153 ]
Bracking_09_cha08.qxd 13/02/2009 10:56 Page 153
[ 154 ]
Table 8.3 continued
Name of Status Country Value of Comments
organisation
(a)
of origin investments
SIMEST State-controlled Italy At end of 2004 SIMEST’s private sector shareholders include major Italian banks and
held equity business organisations, but it is controlled by the Italian Ministry for
interests Productive Affairs. Aim is to promote Italian investments abroad. Takes
valued at equity stakes in Italian firms and joins joint ventures.
€157.3 mill.
Norfund Hybrid state-owned company Norway At end 2004 Board of directors is appointed by the Norwegian Parliament. Untied aid,
capital of but concentrates on priority partner countries of Norway’s development
approx. co-operation programme.
€330 mill.
PROPARCO Majority state-owned France Bank’s total The Agence Française de Développement (AFD, formally CCCE), owns a
lending is 68% share. The remaining shares are owned by IFIs, and French finance
€497 mill. institutions and companies. The AFD has two permanent positions on the
board of directors. The Ministry of Economic Affairs and the Ministry of
Finance are also represented on the board. Untied.
Notes:
(a) Names of organisations in full: AWS (Austria Wirtschaftsservice Gesellschaft mbH), BIO (Belgische Investeringsmaatschappij voor Ontwikkelingslanden), COFIDES (Compañía
Española de Financiación del Desarrollo), IFU (Industrialisation Fund for Developing Countries), IØ (Investment Fund for Central and Eastern Europe), PROPARCO (Société de
Promotion et de Participation pour la Coopération Economique), SBI-BMI (Société Belge d’Investissement International S.A., Belgian Corporation for International Investment),
SIMEST (Società Italiana per le Imprese all’Estero), and Swedfund (Swedfund International AB).
Source: Compiled from Storey and Williams (2006).
Bracking_09_cha08.qxd 13/02/2009 10:56 Page 154
Interact Group a club rather than an institution’, in order to
‘harmonise procedures and to provide the means of co-financing’
(CDC 1982: 11). There were eight members of Interact in the early
1980s, jointly responsible for £1.6 billion annually (CDC 1983: 10).
3
Interact is now incorporated within EDFI, with working groups that
meet regularly and a CEO group that meets annually, all for the
‘exchange of views on development topics’ (EDFI 2007).
The European institutions had ‘widely differing relationships over-
seas’ which led to ‘fruitful areas of co-operation’ with, for example, the
CDC specialism in agriculture used to provide ‘know-how’ to DEG,
who ‘had long wished to participate in agricultural development but
lacked German partners’, while the Caisse Centrale de Coopération
Economique (CCCE) ‘introduced CDC to the Ivory Coast’ and in turn,
by 1982 their funds were ‘becoming available’ for projects in Anglo-
phone Africa (CDC 1982: 11). In Tyler’s periodisation of the CDC – The
Development Bank (1964–83); The Development Finance Institution
(1984–94); The Emerging Private Equity Investor (1994–2000); and The
Fund of Funds (2000–present) (Tyler 2008) – this cross-investment
helped the CDC move from its first to its second model, with several
large agribusiness ventures jointly promoted, acquired and managed,
with CDC now the principal vehicle of British PSD, with private busi-
nesses as recipients and investments on or near commercial terms. By
1996, CDC was charged with placing 25 per cent of all new investment
in equity (Tyler 2008: 18). Investments were even made in countries
where governments had defaulted on their sovereign debt obligations
to CDC, but where deals had been struck and CDC accepted debt
service payments in local currency in order to reinvest them.
4
Agribusi-
ness represented 54 per cent of CDC’s total African investment
portfolio in 1996 (Tyler 2008: 18).
However, Tyler summarises that ‘generally, investing as a minority
partner alongside private entrepreneurs was not a success’, since some
had little capital of their own, viewed projects as ‘low stakes gambles’,
had little experience or were ‘expert fraudsters’ (2008: 19), such that
‘CDC made a substantial loss on the African agribusiness investments
that it made during this period, writing off over half of the capital
invested’ (2008: 20). This desire to support private-sector development
left as its legacy an enriched state class of new equity owners and an
impoverished capital account on the balance of payments of poor
countries in so far as state guaranteed loans were implicated in the fail-
ures. Many parastatal agricultural development authorities also took
stakes, such as ARDA in Zimbabwe, in Rusitu Valley dairy production,
the Cold Storage Commission and South Downs Tea, and were then
left with increased debt burdens when the project failed but no income
streams when the project succeeded and was privatised, such as with
PRIVATE SECTOR DEVELOPMENT AND BILATERAL INTERVENTIONS
[ 155 ]
Bracking_09_cha08.qxd 13/02/2009 10:56 Page 155
the refurbishment of Hippo Valley and Triangle Sugar estates on
CDC’s ‘exit’. In other words, this mode of investment has as a moral
hazard, that private entrepreneurs can’t lose and the public purse can’t
win. The least worst outcome in some countries is that a relatively
honest ruling elite emerged with acumen in holding equity positions
and accumulating through investment of capital: a key function of a
capitalist ruling class. Thus, this development finance period helped
facilitate the growth of finance capital and accumulation. All the high
turnover African stock exchanges in Anglophone countries, for
example (and the supreme example of this is now Ghana, following
Zimbabwe’s demise), were catalysed by the listing of DFI-sponsored
large companies created with exchangeable equity. Pools of venture
capital funds were created in this period, by CDC, IFC and other DFIs,
to liquidate the new exchanges.
In the current period there is resurgence in private sector finance,
alongside a spurt in growth in some private sectors, while the Great
Predators retain a leading role in listing stock for companies, and in
sponsoring financial institutions and instruments. The IFC set up its
Capital Markets Department back in 1971 and initiates a ‘high propor-
tion’ of financial sector interventions itself, as an advisor and investor,
and sees its role in the financial sector as transmitting efficiency to the
economy as a whole, and of changing ownership conventions away
from family firms to listed companies as a competitiveness measure.
Meanwhile, the AfDB summarises that it made a sevenfold increase in
private sector operations from 2004 to 2007 (AfDB 2008: 9), while Africa’s
GDP growth rate has exceeded 5.5 per cent since 2004, with 25 countries
achieving GDP growth rates of above 5 per cent and 14 achieving GDP
growth rates of between 3 and 5 per cent. The AfDB suggest that the
‘drivers’ are macroeconomic stability, debt relief and global expansion
(AfDB 2008: 32). For example, debt relief initiatives have reduced debt
service as a proportion of exports from 13.6 per cent in 2002 to 6.3 per
cent in 2007, while external debt to GDP dropped from 55.4 per cent in
2002 to 22.7 per cent in 2007 (AfDB 2008: 33). Moreover, new investors
in the shape of China and India are producing significant, large interven-
tions such as $10 billion by Indian national oil companies (Naidu 2008:
118). However, growth in itself is not an unqualified positive. The argu-
ment of this book is that systemic reform is required to democratise the
political economy of development before renewed indebtedness merely
reaffirms dependent development.
Conclusion
In an interview in London in 1993, a senior representative at the CDC
bemoaned the amorality of the new ‘merchant bankers’ who were
MONEY AND POWER
[ 156 ]
Bracking_09_cha08.qxd 13/02/2009 10:56 Page 156
replacing his generation at board level. He then gave a telling analysis
of the political gain to the British elite of having the CDC, despite the
erosion of its developmental role by commercialisation:
I think it can be argued that it suits the current government,
to maintain CDC, doing a bit of what its doing because it
doesn’t cost the government anything. If they cut the supply of
funding, and let ourselves fend for ourselves from the
turnover that we have, which is what they’re doing, then
unless we go into the red and they have to bail us out, and that
hasn’t happened, it costs us, it costs them nothing. And it,
then, enables the government to say, to outsiders, that yes, we
are providing money.
(interview, London, 1993)
CDC investments are counted by OECD convention as either ‘Official
Development Assistance’ (ODA), or ‘Other Official Flows’ (OOF), as
we explored in chapter 6, depending on how concessional they are. But
in either category they increase the UK’s apparent contribution to
international aid. The CDC official used the example of Sri Lanka,
where ‘just little dribs and drabs’ of aid money were appearing but
where CDC could invest and:
they can then say, it’s aid. So it’s a political thing, and for
political reasons I think they will keep the CDC doing what they
would like to keep the CDC doing, what it does. To be called
developmental in inverted commas. On the other hand, CDC is,
there is a pressure by the government to make us behave like a
merchant bank …. So, one side is the political benefit of having
a tame organisation, that says it does development, and on the
other hand turning this into a bank.
(ibid.)
This official predicted that privatisation would cause the CDC to lose
its ‘mission’ and he was correct; by 2008, the new generation of bankers
had done their work. What is perhaps surprising is that the Govern-
ment can still pretend to be doing its utmost for the private sector
development of poor countries, despite such changes in the CDC’s
ownership. Therein lies the great power of the symbolic arsenal of the
Great Predators. A critique of development assistance to the private
sector, even 15 years on, is still a voice from the margins because of the
structural ability of the powerful to confuse and obfuscate the material
meaning of their activities using symbolic power and the moral
language of development.
PRIVATE SECTOR DEVELOPMENT AND BILATERAL INTERVENTIONS
[ 157 ]
Bracking_09_cha08.qxd 13/02/2009 10:56 Page 157
MONEY AND POWER
[ 158 ]
At a global level the Great Predators still effectively decide when a
country is deemed to be acceptable to further injections of finance
capital, overwhelmingly a position reached through adherence to
neoliberalism. These resources in turn are marketed under the PSD
brand and are supposed to develop local markets, industries and
economies and fuel growth, development and participation. However,
much of the froth of advocacy for PSD instruments has proved contra-
dictory. It is good ideological cover for market intervention done on
the Predators’ own accounts, but the PSD instruments themselves are
not the new, catalytic, cutting edge and superior policies that is
pretended. Instead, they tend to support capital exports and agglomer-
ations of their national and regional interests abroad, in the case of the
European and North American DFIs at least.
The sheer size, scope and profitability of these DFIs justifies their
being called the ‘Great Predators’, as they have collectivised the
common interests of capital owners in Europe and North America,
represent them through a pseudo-public institution and then roam
global market places and the national stock exchanges of poorer coun-
tries looking for large national firms to invest in. In this, they
fundamentally sponsor inequality. Much has been said of the ‘missing
middle’ in African economies, that is, that there are a few large firms
that dominate African economies, coexisting with a large number of
micro and small enterprises, the majority of which exist in the informal
sector, but a dearth of medium-sized firms (OECD 2007: 13; OECD and
AfDB 2005). These Great Predators contribute to that problem. It is a
consequence of the type of private sector development that they
sponsor. That DFIs carry size and its attendant institutional supports in
supplier credit, export insurance, market access, equity and govern-
ment sponsorship, explains somewhat why there is now this super
class of African large firms and then nothing beneath them save the
micro enterprises.
Notes
1. Converted at US$1 = €0.629291 to 1 decimal place on 16 July 2008.
2. The APDF was established in 1986 and was also partly financed by the
AfDB and UNDP, and received funding from the governments of 15
industrial countries (IFC 1992b).
3. From the 1982 Annual Report the eight can be listed as: the German
Finance Company for Investments in Developing Countries (DEG), the
Danish Industrialisation Fund (IFU), the Belgian Société Belge d’In-
vestissement International (SBI), the French Caisse Centrale de
Coopération Economique (CCCE), the German Kreditanstalt für Wieder-
aufbau (KfW), the Netherlands Development Finance Company (FMO),
the British CDC and the EIB (CDC 1982: 11).
4. Tanzania, Zambia, Malawi, Ivory Coast and Cameroon defaulted.
Bracking_09_cha08.qxd 13/02/2009 10:56 Page 158
[ 159 ]
9 Taking the long view of
promoting capitalism
We saw in chapter 2 how poorer countries must rely on three sources
of money: private investment, debt relief and ‘new’ aid, and that in
general the poorer a country is, the more it relies on public finance.
This chapter looks at a case study of British flows of investment, debt
relief and aid, which go abroad to poorer countries. The case study
shows, for Britain at least, that while recent noise about increasing the
benevolence of the political economy of development has attracted
much attention, when you look at the actual numbers involved, it is
clear that the system of international economic relations has not
changed substantively, and remains a system which serves the privi-
leged capital owners in Britain the most. The numbers on the balance
sheets have merely been tweaked. This chapter shows how the figures
just don’t add up to ‘development’ in our British case study, first by
exploring the actual flows of money and then by assessing British
interventions historically in the private sectors of Ghana and
Zimbabwe in more detail. The data illustrate that ring-fenced pools of
privilege were sponsored in these countries, much profit is made there,
and that the debt relief that has occurred refers largely to write-offs of
money given to British and African elites, to the general expense of
both the British taxpayer and the African poor. In this conclusion, both
the arguments of Teresa Hayter’s Aid as Imperialism (1972) and Susan
George’s The Debt Boomerang (1991) are brought to mind, reiterated and
updated with empirical evidence.
Post-colonial disinvestment
Bennell summarised of the 1980s, that in ‘English speaking Africa …
chronic and persistent’ shortages of foreign exchange meant that
even when companies were making a healthy profit in local currency
rates of return, the effective rate of return in sterling to parent compa-
nies was much lower, because subsidiaries had difficulty remitting
(1990: 166). This shortage of foreign exchange in English-speaking
African countries thus aggravated disinvestment in the 1989–94
period, as companies responded to these problems of getting their
profits ‘out’ (Bennell 1994: 8). In fact, outward investment to selected
sub-Saharan African countries to the mid-1990s did not recover from
the low levels of the mid-1980s, a problem compounded by the high
variance of year-on-year investment flows, and thus their relative
Bracking_10_cha09.qxd 13/02/2009 10:53 Page 159
unreliability (Central Statistical Office (CSO) 1996). In effect, while
the pool of private lending had been growing globally, little was
reaching Africa and in the case of UK private investment to Anglo-
phone ex-colonies, there has been little overall recovery since 1982,
but rather a long-run process of company withdrawal to date.
Indeed, it is a sad irony that in 2005, the year of Prime Minister Tony
Blair’s Commission for Africa, there was a historic disinvestment
from Africa by UK companies, despite it being something of a boom
year of earnings elsewhere.
Thus, direct investment sent abroad by British companies during
the single year 2006 rose to £49.4 billion (an increase of £4.9 billion on
the amount invested in 2005), contributing to an International Invest-
ment Position (the overall level of foreign direct investment) at the
end of 2006 of £734.7 billion, which then generated earnings of £84.6
billion, the highest level ever recorded (Office for National Statistics
(ONS
1
) 2008: 3). However, despite increases in all other geographic
areas, Africa showed a large decrease in net direct investment flow
from £5.8 billion in 2005 to £0.3 billion in 2006, and a commensurate
decrease in earnings of £2.3 billion (ONS 2008: 2–3).
2
At the end of
2006, Africa was home to just 2 per cent of the book value level of
direct investment abroad of British companies, after a decrease of
£5.3 billion in a single year (ONS 2008a: 2).
3
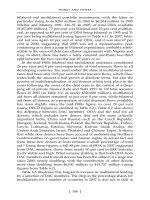
This paucity of funds can
be seen graphically in Figure 9.1, where the destinations of UK
investment flows in millions of pounds were Europe (£16.0), the
Americas (£21.2), Asia (£8.3), Australasia and Oceania (£3.6) and
Africa (£0.3) (ONS 2008).
MONEY AND POWER
[ 160 ]
Figure 9.1 Net direct investment abroad by UK companies in 2006
Source: ONS (2008a)
25
20
15
10
5
0
£ mill.
Europe
The Americas
Asia
Australasia and Oceania
Africa
Bracking_10_cha09.qxd 13/02/2009 10:54 Page 160
Table 9.1 shows the relatively small amounts, in millions of pounds,
of UK foreign direct investment (FDI) to selected African countries,
including the ‘big five’ – Egypt, Kenya, Nigeria, South Africa and
Zimbabwe – which have been in receipt of most investment from the
UK historically, between 1997 and 2006. The Africa total is made up of
the separate figures by country shown here, and also data for countries
not included here, for all other African countries. The table entries
comprise the sum of all the years 1997–2006 inclusive, and other areas
are included in order to put these figures into relative perspective. The
world total sum of net UK FDI flows abroad, for all the years
1997–2006 inclusive was over £646 billion, over £550 billion of which
went to countries in the OECD and over £311 billion of which went to
Europe (where a billion is 1,000 million). Africa received nearly £22
billion (a mere 7 per cent of the European total), but still more than
Central and Eastern Europe at over £3.6 billion, China at just over £4
billion and Australia at nearly £10 billion. As can be seen in Table 9.1,
investment flows to South Africa dwarfed all other investment flows to
Africa in this period, being more than four times the amount of all the
other countries listed put together, and singularly constituting over 71
per cent of the total for all of Africa.
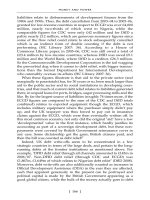
The nearly £22 billion investment flow for the period 1997–2006
helped to generate an investment position in Africa worth around
£15.5 billion at the end of 2006, up from just under £6 billion in 1997,
with a high of nearly £21 billion in 2005 (see Figure 9.2). Investment
positions differ from investment flows, as they represent the year end
totals, or value, of investment overseas. The net investment positions
for British investment in Africa reflects historical legacy, but also shows
few enlarged investment stocks for the modern period, excepting
South Africa. Recently, there has been some recovery in the overall
investment position between 1997 and 2006 (as compared to the early
1990s), but again, just over half of renewed British investment in Africa
can be attributed to South Africa. Investment in Kenya and Nigeria has
remained stagnant. For Kenya, British investments were worth £361
million in 1997, and then they declined slightly to £315 million by 2006.
In Nigeria, again there wasn’t much change over these years, with an
investment position worth £1,009 million in 2006, as compared to
£1,060 million in 1997. Investment in Zimbabwe unsurprisingly
declined over the period from £192 million in 1997, to £58 million in
2006, despite a large investment flow figure (in Table 9.1) of £378
million for the same years, much of which has, presumably, been lost
or subject to local devaluation. Thus, the biggest jump, which is by far
the largest contributor to ‘Africa as a whole’, is South Africa, where the
value of British investment rose from around £2.5 billion in 1997 to
over £8.6 billion in 2006, peaking at £13.7 billion in 2005. In other
TAKING THE LONG VIEW OF PROMOTING CAPITALISM
[ 161 ]
Bracking_10_cha09.qxd 13/02/2009 10:54 Page 161
words, over 55 per cent of all British investment held in Africa is in
South Africa.
The ONS also has data on firms’ destinations for investment by
industrial sector, but much of this data for sub-Saharan Africa is
incomplete to the public gaze, and is not released because of confi-
dentiality considerations. These considerations arise principally
because there are so few investors in these countries and sectors,
perhaps only one company reporting for each cell category, and so
they could be identified by a ‘knowledgeable party’,
4
and this is
MONEY AND POWER
[ 162 ]
Table 9.1 Some destinations of UK foreign direct investment flows
abroad, 1997–2006
1997–2006
(a)
(£ mill.)
Total Europe 311,365
Central and Eastern Europe 3,676
China 4,079
Australia 9,903
Africa 21,975
of which:
Kenya 614
Nigeria 507
South Africa 15,697
Zimbabwe 378
Cameroon
(b)
46
Egypt 1,760
Ghana 347
Malawi
(b)
40
Mauritius
(b)
–175
Tanzania
(b)
70
Zambia 137
Notes:
(a) These are summary figures obtained from adding the totals for 1997–2006. Where a negative entry
occurs (indicating a net disinvestment by the UK parent companies in their foreign affiliates), it is
deducted from the cumulative total. Negative figures occur in Egypt 1998; Cameroon, 2004 and 2006;
and Mauritius spectacularly in 2006 at –713.
(b) In the original ONS tables ‘ ’ appears in cells to indicate ‘confidential data that cannot be released’.
In nine of the ten years each, Sierra Leone and Swaziland had this type of embargoed data: in other
words the cells were blank, marked ‘ ’. These series have been omitted completely here. Cameroon
had confidential data/non-recorded data in 1999 and 2001; Malawi in 1999; Mauritius in 2000, 2003 and
2005; and Tanzania in 2000. These countries have been included here, consequently without the data
for these cells, such that there is an error relating to what happened in those years.
Source: ONS: Foreign Direct Investment surveys (Crown Copyright 2008).
Bracking_10_cha09.qxd 13/02/2009 10:54 Page 162
deemed unacceptable by current rules for the release of government
statistics. From what is included for ‘Africa as a whole’, we can see
that the financial services and retail and wholesale sectors are the
largest earners, although the country-based data for the former is
largely embargoed, with some large investments also in mining and
quarrying, particularly in South Africa.
While these investment positions are comparatively small in global
terms, are unevenly spread and are largely stagnant with the exception
of South Africa, their profitability is still very high, absolutely and
comparatively. If the earnings from these investment positions are
expressed as a percentage of the value of the investment, the earnings
for Africa as a whole represent over 22.5 per cent in the single year
2006. In other words, against an investment position of around £15.45
billion, earnings were just under £3.48 billion. The equivalent profit
rates for Kenya, Nigeria, South Africa and Zimbabwe for British
investments in 2006 were 27.9, 13.2, 18.7 and (even) 17.2 per cent
respectively.
5
What these numbers add up to are investments in Africa
that have not grown in the vast majority of countries, but have
declined overall except in South Africa, but which remain highly lucra-
tive to their owners. These types of returns are largely unheard of in
more ‘developed’ countries, and while in business vernacular this
would be explained by reference to high risk, a quick look at the data
for all the years 1997–2006 shows that this is not an exceptional year, in
fact in the boom year of 2005 profitability shot to 27.6 per cent for
Africa as a whole. In other words, there is no evidence that the
supposed ‘high risk’ translated into lower returns in any of the years
examined. This raises the question of how poorer countries can be
expected to fund adequate public services when they have to perma-
nently surrender such large proportions of their efforts to capital
owners. The rise of investment value premised on South Africa is illus-
trated in Figure 9.2, where the top line is the value of investments in
‘Africa as a whole’, while the second is the value of investments in
South Africa, plotted for the years 1997–2006.
A review of the fairness of British
economic relations overseas
The figures above reflect outgoing investments, but what is perhaps
most critical to a judgement of fairness in international relations
between states is the relationship between what one country puts in
to another, in relation to what it takes out. Economists refer to this as
the payments position, but when one country or group is supposedly
developing it is more complex than merely comparing private flows,
since ostensibly concessionary ones must be considered too. For the
TAKING THE LONG VIEW OF PROMOTING CAPITALISM
[ 163 ]
Bracking_10_cha09.qxd 13/02/2009 10:54 Page 163
figures we have reviewed above, we can now compare the magni-
tudes of aid, debt and investment in relation to each other for our
British case study: The Department for International Development’s
(DfID) bilateral assistance to sub-Saharan Africa was £1,107 million
in 2006–07; while the net foreign direct investment position in Africa
of UK companies in 2006 was £15,455 million (15 times more); and net
earnings from foreign direct investment in Africa in 2006 were £3,479
million (three times more) (DfID 2008; ONS 2008). In other words, the
payments position in this continental account appears to be well in
the UK’s favour,
6
despite rhetorical commitment to the Millennium
Development Goals (MDGs) and the generalised perception that as a
creditor country its benevolence is expressed by transferring
resources overseas, rather than the reality of a situation where the
flow is in the other direction in terms of many of the poorest coun-
tries and is in the UK’s favour overall. So what about the much publi-
cised debt relief?
Which institutions in Britain are owed debt?
States who default on intergovernmental loans may have their eligi-
bility for renewed borrowing reduced for some time, while the actual
debts they have accrued are accounted for over a longer period than
in the creditor states’ yearly balance of payments account. The fron-
tier institutions are important here as vessels in which debts owed
can be stored, to ameliorate their negative effect on short-term liquid-
ity. In other words, many debts owed by African countries to the
British state from the 1982 crisis and in the aftermath of the 1991
MONEY AND POWER
[ 164 ]
Figure 9.2 UK investment position in selected African countries,
1997–2006
Source: ONS (2008), Table MA4 3.1, in £ mill.
25,000
20,000
15,000
10,000
5,000
0
Africa of which
Kenya
Nigeria
South Africa
Zimbabwe
Bracking_10_cha09.qxd 13/02/2009 10:54 Page 164
recession were transferred to the frontier institutions of the British
state. It is interesting in this respect to note, for example, that much
of the debt write-off by the UK Government in 2005 and 2006 referred
to debts owed to the Export Credit Guarantee Department (ECGD)
and Commonwealth Development Corporation (CDC) – rather than
to the DfID directly – and we can speculate that these were of some
vintage. Indeed, a House of Commons Library research paper notes
that ‘Most of the debt relief provided by the UK pertains to debts
owed to the ECGD by low and lower-middle income countries under
Paris Club debt rescheduling agreements’ (2007: 25), amounting to
more than $4 billion from 2004 to 31 January 2007. As we can see from
Table 9.2, by far the largest cancellation was in respect of Nigeria,
followed by Zambia, both of which must refer to debt acquired some
time ago, since neither has been allowed to borrow such amounts in
the 1990s.
If the debt stock held against the British state is broken down, the
liabilities to ECGD are the largest, then CDC, with DfID coming a
much smaller third, as illustrated in Table 9.3. Most of these historic
TAKING THE LONG VIEW OF PROMOTING CAPITALISM
[ 165 ]
Table 9.2 UK debt relief on debts owed to Export Credit Guarantee
Department, for low income countries, 2004–07
Total debt relief
(a)
2004–07 in £ mill.
Ivory Coast 1.0
D. R. Congo 2.4
Ethiopia 10.6
Ghana 82.7
Madagascar 24.1
Malawi 1.1
Niger 5.0
Nigeria 2,800.0
Senegal 1.0
Sierra Leone 2.7
Zambia 291.9
Total* 4,096.2
Notes:
In £ millions to one decimal place.
(a)
Total debt relief includes flow and or stock relief.
*
These totals include a further section of the table for lower-middle income countries omitted here.
Source: Derived from table 2, House of Commons Library (2007), at:
www.parliament.uk/commons/lib/research/rp2007/rp07-051.pdf, citing House of Commons Debate,
19 February 2007, c475-6WA.
Bracking_10_cha09.qxd 13/02/2009 10:54 Page 165