Organization and Development of Russian Business A Firm-Level Analysis_10 docx
Bạn đang xem bản rút gọn của tài liệu. Xem và tải ngay bản đầy đủ của tài liệu tại đây (245.67 KB, 23 trang )
Corporate Restructuring and Performance 215
by the state, although Russia’s modern history shows that, even if this rule
is true, frequent and significant exceptions to it are allowed.
There are two alternative concepts of the BG impact on subsidiaries. One
is that of the BG as a means of protection of a subsidiary against the external
environment (Yakovlev & Danilov 2007), and the other is that of the BG
as an initiator of active restructuring aimed at increasing competitiveness
(Pappe & Galukhina 2006). The difference between these concepts lacks depth
because the subsidiaries in both cases increase their competitiveness due to
BG membership. Therefore, the two concepts provide a basis for different
hypotheses concerning the comparative efficiency of BG members and non-
members. In the former case, BG member enterprises may not display higher
productivity than independent enterprises. The main role of amalgamations
is to give independent enterprises a boost in reaching the level of compara-
ble companies. The results of Guriev and Rachinsky confirm precisely this
concept of BG impact on comparative productivity and competitiveness of
enterprises incorporated in groups. In the latter case, a BG member can be
expected to demonstrate higher productivity; the role of amalgamation is to
enable members to gain leadership in relevant industries.
Testable hypotheses and data
Our goal in this chapter is to examine the hypothesis that Russian BGs have
a positive impact on subsidiary enterprises and to evaluate the correctness
of the existing ideas about the impact of the Russian BGs on the conduct
and performance of their member enterprises. According to these concepts,
subsidiaries in BGs are relatively large enterprises
1
that experience, possibly
because of their size, greater difficulties in a market-oriented restructuring.
Membership in groups promotes the sales of enterprises and more active
restructuring. More active restructuring can compensate for a later start of
transformations but does not guarantee that a merged enterprise achieves
leadership in the market. This is the reason that subsidiaries within groups
may not display higher productivity.
The analysis of the impact of a BG on competitiveness is seriously com-
plicated by the nonhomogeneity of the groups and group members. In the
previous chapter, it was reported that participants of merger processes
2
after
privatization refer to themselves as BGs, as do enterprises that have belonged
to major companies from the moment of their creation, for instance, power-
generating units and local communication networks. The impact of parent
companies on the conduct and performance of these two types of subsidiar-
ies can vary substantially. In the latter case, it is difficult to determine the
impact because the BG is a natural form of the asset’s allocation, organiza-
tion, and subordination.
Our study compares the activity of group members and independent
enterprises. Subsidiaries representing only part of the business rather than
9780230_217287_11_cha09. dd 215 5/14/2009 11:06:13 AM
216 Organization and Development of Russian Business
the business as a whole are selected for survey purposes from the entire sam-
ple of BG members. To show the impact of transactions concluded after an
enterprise is privatized, group member subsidiaries are classified according
to the time of the merger deals that occurred before or after 1995, which was
the last year of mass privatization.
In some cases, industries will be categorized as regulated and nonregu-
lated in order to reflect the specifics of the impact of head companies on the
conduct of subsidiaries in groups. The performance results are influenced
by state tariffs and returns on investment regulations. On the whole, the
impact of membership in holdings in regulated industries on the finan-
cial and operative performance of subsidiaries can be expected to be not as
strong as it would be in nonregulated industries.
We will verify the hypothesis that membership in BGs has a favorable
impact on the activeness of enterprises in restructuring (H1) and on the
financial and operative performance (H2) of enterprises. At the same time,
members of holdings merged after privatization do not demonstrate sustain-
able resource productivity advantages over independent companies (H3).
The chapter is organized as follows: the next paragraph is an assessment
of the role of a BG by directors of the affiliated enterprises. In the following
section, the impact of group membership on the restructuring activity of
subsidiary enterprises is analyzed. The third paragraph is a consideration
of the performance indicators of subsidiary companies vis-à-vis independ-
ent enterprises. Finally, the fourth paragraph introduces a comparison of
the TFP in affiliated companies with independent ones. A summary of the
results of the empirical analysis is presented in the Conclusion.
Managers of subsidiaries on the advantages of
being members of BGs
In our survey, the gains from an affiliation with a BG for the directors of
the enterprises can be assessed by two indicators. The first is which party
initiated the affiliation with the group, and the second is what advantages
the enterprise obtained from operating as a member of the group. The key
role in initiating the merger of an enterprise was played by the owners of
the parent company by more than 40% of the respondents. However, in a
third of all cases, the initiative came from the private owners of other com-
panies as well. The answers give the impression that, in Russian industry,
the role of friendly takeovers is comparable to that of hostile takeovers. The
impact of state administrations on the federal or regional level as initiators
of corporate integration is relatively modest and is negligible for mergers in
nonregulated industries. It is important to emphasize that most BGs are the
result of private and not state decisions.
Responses to the question about the advantages gained by their companies
by belonging to BGs confirm the notion that, for directors, competitiveness
9780230_217287_11_cha09. dd 216 5/14/2009 11:06:14 AM
Corporate Restructuring and Performance 217
on the market on the whole is more important than relations with the state.
In accordance with the two alternative concepts of the role of Russian BGs,
that is, as a tool to protect against the external environment and as the
driving force of restructuring, a subsidiary’s advantages can be classified as
protective or active gains. Protective gains include the strengthening of bar-
gaining positions in relationships with the state and protection against hos-
tile takeover. Active gains involve the improvement of competitiveness in
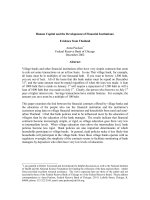
the market and the enhancement of investment availability. Protective gains
are more important for group participants that merged before privatization
and during initial property distribution (Figure 9.1). BG participants that
merged after 1995, on the contrary, associate greater value with the gains
connected with the companies’ market competitiveness, that is, stronger
positions on the domestic and world market and access to investments and
new technologies. Support in relationships with the state is more important
for subsidiaries that lack independent experience in a market economy. On
the whole, the evaluations of the gains from participation in BGs made by
enterprise directors support the H1 and H2 hypotheses.
An important source of additional advantages for subsidiaries from group
membership is internal financing. This could be important, especially in
view of Russia’s underdeveloped financial markets. Until now, evidence on
internal financial markets in Russian BGs has been controversial. Earlier stud-
ies (Perotti & Gelfer 2001) confirmed the hypothesis about their existence,
3
but later studies did not (Shumilov & Volchkova 2005). According to our
survey, in companies affiliated with groups, the second and third most
important financial sources of investment are shared by bank borrowings
and group funds (15–20%). About one-third of the respondents reported
that they do not use group funds for financing their investment. The size of
0
10
20
30
40
50
60
70
Strengthened
marketing position
Received access
to investments and
new technologies
Protected from
hostile takeover
Strengthened
bargaining position
in relation with state
No gains
Merged before 1995 Merged since 1996
Figure 9.1 Gains from joining business groups (BGs) according to directors of enter-
prises by time of merger (% of respondents)
Source: Author’s illustration based on survey data.
9780230_217287_11_cha09. dd 217 5/14/2009 11:06:14 AM
218 Organization and Development of Russian Business
this share differs significantly depending on the industry. The highest share
of such enterprises is in electric power (about 60%) and construction mate-
rials (50%), with lower shares in the chemical and petrochemical indus-
try (22%) and light industry (17%). At the same time, about one-quarter of
affiliated firms consider internal financial markets to be important, with
the share of group funding in overall investments being more than 20%.
4
The use of an additional source of funding of restructuring should also sup-
port hypothesis H1.
To sum up, top managers of group companies acknowledge the positive
impact of affiliation with a BG on competitiveness and firm performance.
However, their statements need to be verified. The question of whether
enterprises use additional sources of financing for restructuring and not for
compensation to make up for shortfalls will be answered. Another issue that
will be examined is whether higher restructuring activity improved their
financial and operative performance and led to higher productivity.
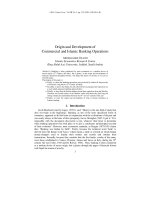
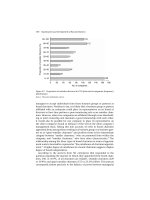
Impact of business integration on corporate restructuring
A comparison of the intensity with which independent companies and
group subsidiaries engaged in restructuring demonstrates that the latter
applied measures aimed at the increase of competitiveness more often dur-
ing 2001–2004 (Figure 9.2). The superiority of BG participants is particularly
clear in the area of restructuring involving production expansion, namely,
successfully introducing new technologies and making significant capital
investments. However, a considerable number of respondents had joined
0
20
40
60
80
Successful introduction of essentially
new products and services
Introduction of new production
facilities
Increasing of expenditures on
marketing and advertising
Successful introduction of
new technologies
Successful certification according
to international strandards
Making of significant
capital investments
Increasing R&D expenditures
Long-term (over one year)
credit
Increasing volume of export
Independent enterprises Merged before 2000 Merged since 2001
Figure 9.2 Restructuring activity in subsidiaries of BG vis-à-vis independent companies
Source: Author’s illustration based on survey data.
9780230_217287_11_cha09. dd 218 5/14/2009 11:06:14 AM
Corporate Restructuring and Performance 219
groups in the same period when restructuring had become more active. It
is noteworthy that new subsidiaries that merged after 2001 displayed the
highest degree of activity aimed at the restructuring of all other groups of
enterprises. In this case, we could not distinguish between the two compet-
ing hypotheses, that is, that group membership had a favorable impact on
the restructuring intensity and that BGs were acquiring enterprises which
were more active in restructuring. This is the reason that the analysis was
conducted only for the old group participants that merged before 2000.
To test the hypothesis that the intensity of restructuring displayed by sub-
sidiaries is higher than that of independent companies, we used the index
of intensity of restructuring (INDRES).
5
This index is calculated as the total
number of restructuring measures, including the successful introduction
of essentially new products and services, the introduction of new produc-
tion facilities, the increase of expenditures on marketing and advertising,
the successful introduction of new technologies, successful certification
according to international standards, significant capital investments, and
an increase of R&D expenditures.
6
Presumably, the intensity of restructuring in nonregulated industries is
influenced by company size, corporate governance organization, and mar-
ket competition as well as by membership in BGs. In regulated industries,
competition as such is restricted by the model of regulation, and, in many
cases, it is completely impossible. This is the reason that the set of explana-
tory variables is different for nonregulated and regulated industries: for both
types of industries, the set includes attribution to subsidiaries merged before
2000, the GROAF1 variable, the company size COMSIZ variable measured by
the logarithm of the number of employees, the property and management
convergence indicator, MANSHA, which equals 1 if large owners participate
in management of the firm and 0 otherwise, and variables for individual
industries and types of settlement (capital city, regional center, town, urban
settlement, or village). The comparison of the impact of BG membership
and corporate governance organization on the scope of restructuring is con-
nected with the problem raised in a previous chapter, namely, the reason
for the widespread practice of the BG organizational form resorting to the
separation of management from ownership in the Russian economy when it
has been amply demonstrated that the opposite model, in which ownership
converges with management, is much more advantageous. The investiga-
tion also examines the advantages of BGs compensating for a more acute
agency problem caused by the separation of property from management.
In addition, the explanatory competition variables COMPRU and COMPFO
are used for nonregulated industries. The COMPRU variable equals 1 if the
enterprise experiences tough competition and 0 in all other cases. The
COMPFO variable equals 1 if the enterprise experiences competition with
suppliers from developed Western countries and 0 in other cases. The intro-
duction of two different competition indicators is justified by previous
9780230_217287_11_cha09. dd 219 5/14/2009 11:06:15 AM
220 Organization and Development of Russian Business
experience of an empirical analysis of Russian companies’ performance
(Avdasheva et al. 2007). A positive response to the question of tough compe-
tition with Russian manufacturers may not necessarily reflect competition
intensity proper. The choice of this answer often reflects not the market
competition but the low competitiveness of the enterprise in comparison
with other domestic suppliers. At the same time, a positive response to the
question about the existence of competition with foreign suppliers usually
means that the company’s production is indeed involved in competition in
the global market. This is the reason that a number of empirical studies have
failed to reveal a favorable impact of competition with domestic suppliers on
the intensity of Russian companies’ restructuring, in contrast to the case of
competition with foreign manufacturers. Our survey has demonstrated that
the impact of competition with domestic and foreign manufacturers on the
behavior of enterprises, e.g., on the choice of the company organizational
model, is not just different but clearly opposite (see Chapter 7 for details).
Judging by the results of our survey and contrary to the existing opin-
ion about a considerable decline in competition within the framework
of Russian groups, subsidiaries experience as much competition as inde-
pendent firms. Considering nonregulated industries alone,
7
every 20th
enterprise among independent firms and subsidiaries experiences no com-
petition with domestic or foreign suppliers; approximately one-quarter of
the enterprises have to cope with tough competition with domestic and/or
foreign suppliers; and the overwhelming majority of respondents evaluate
the competition as moderate.
8
A number of surveys of Russian enterprises
have confirmed the favorable, although not always monotonic, impact of
competition on restructuring (see Avdasheva et al. 2007 for survey). In our
case, the impact of competition may amplify the effect of the enterprises’
affiliation with BGs.
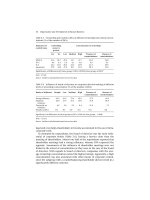
Regression analysis denies the null hypothesis that the intensity of restruc-
turing of group subsidiaries did not differ statistically from the intensity of
restructuring of independent companies (Table 9.1).
9
This pattern is true for
both regulated and nonregulated industries. As expected, for the reasons
presented in Chapter 7, the convergence of ownership and management,
which is demonstrated by the participation of large shareholders in com-
pany management, has a statistically significant favorable impact on the
intensity of restructuring only in nonregulated industries. Among the two
competition indicators, it is competition with foreign manufacturers that
has a statistically significant favorable impact on the intensity of restructur-
ing in nonregulated industries.
The impact of the industry in most regression specifications was statisti-
cally significant. The impact of location is also significant with the expected
sign: enterprises located in regional centers and the capital city took more
restructuring measures in 2001–2004 than enterprises located in urban set-
tlements and villages. In some specifications, enterprises located in towns
9780230_217287_11_cha09. dd 220 5/14/2009 11:06:15 AM
Corporate Restructuring and Performance 221
also demonstrated advantages over companies located in urban settlements
and villages.
Therefore, hypothesis H1 is confirmed: group subsidiaries were more
actively involved in restructuring in 2001–2004 than independent enter-
prises. Participation in competition and access to additional financial and
business resources within the framework of a BG has a favorable impact
on the quantity of enterprise restructuring measures. Additional resources
available to enterprises inside a BG, in turn, substitute the solution of the
agency problem by the use of the do-it-yourself option.
Impact of affiliation with a business group on
financial and operative performance
The second type of hypotheses tested in this chapter is that BG subsidiaries
demonstrate better financial and operative performance indicators. The con-
firmation of this hypothesis would lead to two important conclusions. First,
Table 9.1 Impact of membership in business groups on restructuring activity
Dependent variable INDRES (intensity of firm restructuring)
Estimator Ordinal logit Ordinal logit Poisson Poisson
Sample I
a
II
a
I
a
II
a
GROAF1 0.503**
(3.873)
0.827*
(2.900)
0.094**
(3.956)
0.139*
(2.925)
COMSIZ 0.469***
(23.809)
0.465***
(7.573)
0.087***
(23.690)
0.058***
(8.391)
MANSHA 0.503***
(7.527)
0.119
(0.048)
0.100***
(7.177)
0.048
(0.112)
COMPRU 0.168
(0.815)
—0.041
(1.232)
—
COMPFO 0.729***
(14.200)
— 0.141***
(14.043)
—
INDDUM Yes Yes */*** Yes */*** Yes *
CITDUM Yes */*** Yes */*** Yes */*** Yes */**
N 480 86 480 86
Ϫ2Log likelihood 958.80 141.389 782.185 111.988
Pseudo R
2
0.154 0.435 — —
Test of the model
2
70.736*** 42.004*** 41.838* 22.197*
Notes:
a
Sample I: enterprises in nonregulated industries; Sample II: enterprises in regulated industries.
Wald statistics (Wald Chi-square for Poisson model) are reported in parentheses.
Only subsidiaries merged before 2000 are included.
***: significant at the 1% level, **: at the 5% level, *: at the 10% level.
Source: Author’s estimation.
9780230_217287_11_cha09. dd 221 5/14/2009 11:06:15 AM
222 Organization and Development of Russian Business
a wider program of subsidiary restructuring during the four previous years
yields fruit. Second, we can once again confirm the assumption expressed
in the previous chapter that better financial performance of group member
enterprises may provide the basis for maintaining corporate discipline and
preventing conflicts between ultimate owners and executive management.
The common lack of reliability and distortion in financial data sug-
gests that use of different financial and operational performance indica-
tors would provide for greater accuracy. Survey results and annual reports
together might be better sources of information. The first indicator is the
response to the question about companies’ output increase during the
four-year period preceding the survey. The INCOUT variable is based on
responses from directors to the question about the change of output dur-
ing the four years preceding the survey. The value of this variable is Ϫ1 if
the enterprise reduced its output, 0 if the output has not changed, 1 if the
output increased less then 50%, 3 if the output grew more than 50%, and
4 if the output more than doubled. The higher the INCOUT variable is, the
more successful and competitive the enterprise is. The second indicator is
the self-assessments of financial performance, both direct and in response
to the question about the need to finance a shortfall in cash. The FINPER
indicator reflects the sufficiency of cash inflows for the financing of current
activity and equals 1 if the enterprise did not experience a serious shortfall
in cash flow during 2001–2004 and 0 in other cases. The FINSELF indicator
value ranges from Ϫ2 to 2 depending on respondents’ self-assessment of
the company’s financial performance (including the responses bad/ likely
bad/ satisfactory/ likely good/ good). The third indicator is the profitability
(ratio of profit to sale) and returns on asset (ROA) indicators obtained on
the basis of companies’ book reports from SKRIN and SPARK databases.
10
The AVEPRO and ROAAVE indicators represent the average profitability and
returns on asset values in the period of 2002–2005.
According to the assessments of company directors, the share of enter-
prises that increased their output in 2001–2004 was higher among affiliated
firms: 42% of subsidiaries more than doubled their output in comparison
to 27% among autonomous enterprises. It is noteworthy that 40% of group
members that increased their output simultaneously cut employment. A
similar indicator for independent enterprises was less than 30%. Subsidiaries
are not only stepping up output but also enhancing labor productivity. The
superiority of subsidiaries in increasing output and simultaneously reducing
employment is manifested both in the regulated and nonregulated indus-
tries. An employment reduction with a simultaneous increase in output is
slightly more frequent among enterprises merged before 2000 and, even
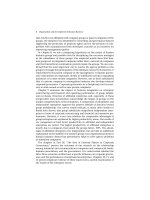
more often, among those merged before 1995. Group members also dem-
onstrate better financial performance and experience difficulties with the
financing of their current activities less frequently (Figure 9.3). However,
the advantages of subsidiaries can be explained by a favorable impact of
9780230_217287_11_cha09. dd 222 5/14/2009 11:06:15 AM
Corporate Restructuring and Performance 223
the parent companies and by the industrial structure of the groups. It was
reported in the previous chapter that the distribution of the group enter-
prises gravitates, first, toward industries with higher profitability and, sec-
ond, toward larger enterprises displaying better financial stability. This is
the reason that the effect of membership in BGs should be distinguished
from the effect of size and industry classification.
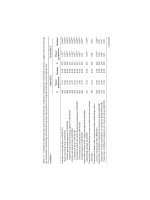
Nevertheless, our regression analysis showed that this is not connected
with the size and industry classification of the enterprises only (Table 9.2).
In nonregulated industries,
11
participants in BGs displayed higher probabil-
ity of output increase, better financial performance self-assessment, lower
probability to encounter shortfalls in cash flows, and significantly higher
profitability and ROA indicators. Besides group membership, significant fac-
tors explaining all indicators were the enterprises’ industry classification and
location. Enterprises located in the capital city, regional centers, and towns
demonstrated better financial and operative performance than enterprises
located in villages. Interestingly, although all group participants had better
indicators, for example, higher financial performance self-assessment, this
effect was higher and statistically more significant for old subsidiaries that
had merged before 2000. At the same time, neither the competition char-
acteristics that were measured by the COMPRU and COMPFO indicators nor
corporate governance organizations represented by the indicator of large
owner participation in management MANSHA had a noticeable impact on
company financial performance results.
Therefore, hypothesis H2 is also confirmed as true. The higher activity of
enterprises in groups with better financial performance creates the image
of Russian groups as quite normal companies and, at the same time, refutes
the opinion that the development of connections between enterprises
replaces corporate restructuring (Gaddy & Ickes 1998). Regardless of the
02040
%
60 80 100 0 20 40
%
60 80 100
Independent
enterprises
Parent
companies
Subsidiaries
Independent
enterprises
Parent
companies
Subsidiaries
Bad Likely bad Satisfatory
Likely good Good
Yes No
Self-assessment of financial performance of the
enterpriseat time of survey
Serious shortfall in cash flow between
2001 and 2004
Figure 9.3 Financial performance of different types of enterprises
Source: Author’s illustration based on survey data.
9780230_217287_11_cha09. dd 223 5/14/2009 11:06:15 AM
Table 9.2 Impact of membership in business groups on performance indicators
Performance
indicator
INCOUT INCOUT FINPER FINPER FINSELF AVEPRO ROAAVE
Estimator Ordinal logit Ordinal logit Binary logistic Binary logistic Ordinal logit OLS OLS
Sample I
a
II
a
I
a
I
a
I
a
III
a
III
a
Constant ——Ϫ1.538*
(2.780)
Ϫ2.096**
(3.837)
— Ϫ1.278
(0.481)
Ϫ0.253
(Ϫ1.532)
GROAFF — — 0.531***
(7.471)
—0.394**
(5.212)
——
GROAF1 0.575***
(7.177)
0.579
(1.785)
— 0.840***
(10.880)
—3.095*
(1.904)
0.231**
(2.172)
COMSIZ ——0.136
(2.293)
0.151
(2.116)
0.219***
(7.998)
0.003***
(18.736)
INDDUM Yes * Yes* Yes Yes* Yes Yes*/*** Yes*/***
CITDUM Yes */*** Yes* Yes* Yes* Yes* Yes* Yes*/***
N 480 86 663 557 660 527 522
Ϫ2Log likelihood 119.899 89.132 747.755 617.379 1098.664 —
R
2, b
0.041 0.138 0.083 0.090 0.066 0.433 0.016
Test of the model
c
22.028*** 11.899* 39.160*** 35.550*** 37.984*** 29.712*** 1.653*
Notes:
Wald statistics are reported in parentheses for the models with INCOUT, FINPER, and FINSELF as the dependent variables. t-statistics – for the models
with AVEPRO and ROAVVE.
a
Sample I: enterprises in non-regulated industries; Sample II: enterprises in regulated industries; Sample III: enterprises in both types of industries.
b
Pseudo R
2
is reported for the models with INCOUT, FINPER, and FINSELF as the dependent variable; Adjusted R
2
, for the models with AV E PRO and
ROAAVE.
c
2
for INCOUT, FINPER, and FINSELF; F-statistics for AVEPRO and ROAAVE.
***: significant at the 1% level, **: at the 5% level, *: at the 10% level.
Source: Author’s estimation.
9780230_217287_11_cha09. dd 224 5/14/2009 11:06:16 AM
Corporate Restructuring and Performance 225
cause-and-effect relationship between corporate restructuring and finan-
cial performance (i.e., whether restructuring ensures an increase of profit or
better financial performance allows for restructuring), both phenomena are
observable in Russian BGs.
Impact of business integration on total factor productivity
The data of enterprises’ annual balance sheets allow a comparison of the
TFP on the basis of the Cobb–Douglas production function in independ-
ent enterprises on the one hand and subsidiaries of BGs on the other. The
analysis is aimed at establishing the extent to which the advantages of sub-
sidiaries, primarily, more stable financial performance and better financial
indicators, are due to higher productivity. On the other hand, a comparative
analysis of productivity will determine the gains of corporate restructuring
within BGs. Higher resource productivity would provide an unambiguous
favorable assessment of the impact of BGs on the development of Russian
enterprises.
On the basis of other results of TFP analysis (Guriev & Rachinsky 2005)
of enterprises merged with major integrations, we assume that subsidiar-
ies have higher productivity than independent firms. The TFP comparison
is based on the Cobb–Douglas production function evaluation. Company
proceeds are used as the output indicator, the average number of employed
individuals (the LABOR variable), as the indicator of labor use, and the book
value of fixed assets, CAPITA, as the indicator of capital use volume. The
source of data on employment and the value of fixed assets for subsidiaries
in industries, which includes all industries surveyed, except telecommuni-
cations, is the SPARK database.
In addition to the industry and settlement-type variables characterizing
the enterprise, the regression analysis was also based on the factor of retain-
ing a state package of shares at the respondent enterprise. The value of the
OWNSTA variable is 1 if the stake of the state on the federal or local level
in the company equity capital exceeds 10% and 0 in other cases. Retaining
a significant share in state property is expected to result in the lowering
of company productivity. This can happen in the contemporary Russian
economy for two reasons. The first is associated with the traditional disad-
vantage of the state as the principal in comparison with the private owner.
Representatives of the state have fewer personal incentives toward raising
the productivity of the assets administered by them and fewer opportuni-
ties to control the executive management as compared to private owners.
The second is connected with the specific role of small state-owned stakes
in Russian joint-stock companies. Retaining such stakes is an effective tool
to prevent a change of owners. This is the reason that the managers and
owners of enterprises with lower productivity and the worst corporate gov-
ernance are interested in retaining a state-owned stake, usually in the form
9780230_217287_11_cha09. dd 225 5/14/2009 11:06:16 AM
226 Organization and Development of Russian Business
of minority packages. In the absence of a state stake, such enterprises are the
prime target for takeover.
In addition to industry and enterprise location indicators, the TFP analysis
relied on the classification of enterprises by their time of merger. In addition
to the classification of the group participants into subsidiaries merged before
2000 and after 2001, another classification criterion was used. In this case,
the margin between the old and new participants lies in 1995 (the GROAF2
variable). This choice is not accidental. The year 1995 is when mass privati-
zation was completed. Therefore, enterprises that merged before 1995 were
either initially created as a component of a broader organizational struc-
ture or acquired in the course of privatization, which was generally possible
due to special decisions of the state. If these particular enterprises demon-
strate higher TFP, we will not be able to conclude that BGs turned out to be
better owners for companies acquired after the completion of privatization.
The results of the regression analysis are mixed (Table 9.3). On the one
hand, the whole family of BG members (the GROAFF variable) is 13% more
Table 9.3 Total factor productivity in subsidiaries of BGs compared with independ-
ent enterprises (Cobb–Douglas production function, output in 2004)
Model [1] [2] [3]
CONSTA 7.874***
(21.689)
7.878***
(21.702)
7.914***
(21.805)
LABOR 0.742***
(15.933)
0.742***
(15.945)
0.740***
(15.918)
CAPITA 0.340***
(13.309)
0.340***
(13.282)
0.339***
(13.289)
OWNSTA Ϫ0.246**
(Ϫ2.092)
Ϫ0.254**
(Ϫ2.155)
Ϫ0.260**
(Ϫ2.209)
GROAFF 0.131*
(1.757)
0.051
(0.511)
0.059
(0.609)
GROAF1 ——0.275*
(1.839)
GROAF2 —0.134
(1.670)
—
INDDUM Yes */*** Yes */*** Yes */***
CITDUM Yes */** Yes */** Yes */**
N 594 594 594
Adjusted
R
2
0.769 0.769 0.770
F-statistics 132.750*** 124.557*** 125.176***
Notes:
We estimated all models by OLS. t-statistics are reported in parentheses.
***: significant at the 1% level, **: at the 5% level, *: at the 10% level.
Source: Author’s estimation.
9780230_217287_11_cha09. dd 226 5/14/2009 11:06:16 AM
Corporate Restructuring and Performance 227
productive than nonmember enterprises. On the other hand, this effect is
mainly due to group members that merged before 1995 (the GROAF1 vari-
able). These integrations are most likely the heritage of Soviet industrial
organization but not the result of merger deals in the transition economy.
Therefore, the higher TFP of these companies does not reflect the superior-
ity of BGs as new owners over other types of owners of Russian enterprises.
The results are very similar to those obtained by Guriev & Rachinsky
(2005). Analyzing enterprises within the largest BGs in Russia, these authors
found advantages in improving TFP, but they did not find a higher TFP
of group members vis-à-vis independent companies in 2001. These results
contribute to the characteristics of the impact of Russian BG on subsidiaries.
New subsidiaries, those merged after 1995, were unable to complete market-
oriented restructuring themselves as independent companies without the
support of BGs. They are the last starters, which became potentially efficient
during the period of economic upturn and were led by a parent company
that had expertise in corporate restructuring and the enhancement of com-
petitiveness. BGs can organize the efficient restructuring of these firms due
to better management, that is, higher quality of entrepreneurial ability; in
addition, BGs provide to subsidiaries access to group financing. As a result,
enterprise directors are satisfied with group membership. New BG members
up to the year of the survey had caught up with autonomous companies;
however, they did not outperform them in terms of TFP.
Thus, hypothesis H3 is only partially confirmed. Although subsidiar-
ies demonstrate higher TFP than independent companies, this superiority
is created by participants that merged with groups before the completion
of privatization. Companies that merged with groups in the period of the
merger boom, which started in 1999, in turn, use resources with the same
productivity as independent companies.
Conclusions
In this chapter, the impact of BGs on restructuring and performance was
measured by economic and financial performance indicators and by TFP.
According to the directors of the enterprises, BGs are important both in pro-
viding recourse for restructuring and in managing the restructuring proc-
esses. Subsidiaries in the groups took a broader set of corporate restructuring
instruments in the four years before the survey. Group membership substi-
tutes the participation of large shareholders in decision-making and daily
management on the level of enterprises and, therefore, compensates for the
higher agency cost in the subsidiaries.
Membership in the groups also results in better financial and operative
performance, especially, for the old members of BGs, and in higher prob-
ability to increase output in the four years preceding our survey. For the
analysis of BGs as a phenomenon of corporate organization in Russia, these
9780230_217287_11_cha09. dd 227 5/14/2009 11:06:17 AM
228 Organization and Development of Russian Business
findings provide evidence in favor of the hypothesis that there is a poten-
tial for relational contracting between the parent and the subsidiaries based
on the possibility for subsidiaries to achieve better economic performance
inside the group. This evidence also supports the positive assessment of the
impact of BGs on enterprises by enterprise directors.
In conclusion, it is necessary to emphasize once again that BGs are excep-
tionally diverse. On the wave of mergers that followed after 1999, BGs
acquired not only the enterprises that needed restructuring but also those
in which such restructuring was already underway. The share of enterprises
taking different corporate restructuring measures is the highest among the
new participants of groups, and such enterprises are the ones that should be
the first to benefit from the improvement of financial performance inside
the group. At the same time, the resource productivity of the new partici-
pants did not exceed the resource productivity of independent companies
at the moment of the survey. Presumably, active restructuring of these com-
panies is not completed yet or, at any rate, has not yet yielded the expected
results.
Another watershed is the division between group participants in non-
regulated and regulated industries. The advantages of subsidiaries in non-
regulated industries, above all, better financial performance, are much more
vivid. This is another confirmation of the assumption frequently expressed
in Russian economic and business literature (Pappe 2002a, 2002b), in which
the comparative advantages of the group participants are a result of better
entrepreneurial skills and better management of the parent companies.
Analysis produces an image of subsidiaries actively merging with groups
in the period of economic upswing. It is most likely that they needed pro-
found corporate restructuring at the moment of the merger and that better
access to the financial market and entrepreneurial skills within the BGs
made it possible. However, despite the measures taken, the more stable
financial performance of the new participants of the groups is not a result
of higher productivity. Until the final year of observation, 2004, new mem-
bers of BGs that merged after mass privatization did not achieve higher
TFP than autonomous enterprises. Almost all the positive impact of group
membership on total factor productivity is due to the old members of BGs,
which were included in holding company groups before privatization and
liberalization. In contrast, new group members, who take a broader range
of corporate restructuring measures, do not display higher productivity.
Therefore, BGs definitely helped last starters to improve productivity dur-
ing economic upturn, but there is no evidence that BGs already made them
leaders in the relevant markets. Until now, the parent companies most prob-
ably performed the function of protecting the new participants from the
market (Yakovlev & Danilov 2007); of course, they were not protected from
the market themselves. A breakthrough to higher competitiveness (Pappe &
Galukhina 2006) is demonstrated by the group participants that originated
9780230_217287_11_cha09. dd 228 5/14/2009 11:06:17 AM
Corporate Restructuring and Performance 229
as a result of the allocation of ownership rights before the economic upheaval
and even before privatization and liberalization.
Acknowledgments
The research was prepared with financial support of SU-HSE (individual
academic grant of the Scientific Foundation No. 06-01-0063 and funds from
the Program of Fundamental Studies granted by the Ministry of Economic
Development and Trade of the Russian Federation in 2007–2008). I am
grateful to Naohito Abe, Tatiana Dolgopyatova, Victoria Golikova, Satoshi
Mizobata, Heiko Pleines, Fumikazu Sugiura, and Andrei Yakovlev as well
as participants of the Joint Workshop of Japan Association of Comparative
Economic Studies and the European Association of Comparative Economic
Studies in Tokyo, Japan, in October 2007. I am particularly grateful to
Ichiro Iwasaki, who made the greatest contributions toward improving this
research. Special thanks are due to Olga Uvarova and Leonid Levin for their
valuable assistance in data processing.
Notes
1. In our survey, a typical member of a BG is also a larger participant in the relevant
industry (see the previous chapter).
2. There were a number of different ways to form BGs in Russia’s transitional econ-
omy, including voluntary amalgamations of enterprisers, redistribution of control-
ling stakes of shares, special agreements on cooperation (for instance, officially
registered financial-industrial groups), and redistribution of control under the
same allocation of formal ownership rights. Companies in regulated industries
also seen as business groups in our survey were created according to special deci-
sions of the state as an owner. In this chapter, all the legal forms of amalgamation,
including mergers, acquisitions, takeovers, both friendly and hostile, and all types
of economic concentration deals will be referred to as mergers.
3. Perotti & Gelfer (2001) found the opposite directions of fund flows in bank-led
and industry-led FIGs. Regardless of the impact of group membership on funds
available, flows are sensitive to the group’s affiliation.
4. It is noteworthy that the share of subsidiaries using BG funds to finance their
current activities is comparable to the share of enterprises using these funds for
investment financing: 23% of subsidiaries that encountered financial difficul-
ties in 2001–2004 contracted loans from trading partners, holding companies,
or individuals to manage their problems. The share of independent firms that are
using this source of compensating for the shortfall in cash flow is almost twice
lower, only 12%. Subsidiaries that merged before 2000 financed the current short-
fall from the holding company funds more often. Among group members experi-
encing a shortfall in cash flow, about 31% of enterprises merged before 2000 were
using group funds, in contrast to 20% merged since 2001.
5. This index was used in this form in Chapter 2.
6. The basic value of the index was calculated similarly to that in Chapter 2, with the
index value ranging from 0 to 7. However, as restructuring measures are intercon-
nected, in order to avoid double-counting, in this chapter, we used the bounded
9780230_217287_11_cha09. dd 229 5/14/2009 11:06:17 AM
230 Organization and Development of Russian Business
version of the index, which is equal to 0 (low intensity of restructuring) if
the INDRES value is from 0 to 2, 1 (moderate intensity of restructuring) if the
INDRES value is 3 or 4, and 2 (high intensity of restructuring) if the INDRES
value exceeds 5.
7. As the intensity of competition in regulated industries is strongly industry-
specific, it depends, first and foremost, on the model of tariff regulation, vertical
organization of the industry, and market access rules for potential entrants.
8. The subjective assessments of competition in our survey fully coincide with alter-
native competition evaluations obtained within the frameworks of various sam-
pling surveys of Russian enterprises (see Avdasheva et al. 2007 for the survey).
9. It should be reported that a favorable impact of business groups on corporate
restructuring was established only for the index of the quantity of measures
applied. A favorable impact of business group membership on individual meas-
ures was established (using the logit model) only for the probability of successful
certification of output according to international standards for enterprises in
nonregulated sectors. In other words, no special restructuring model was discov-
ered in this case for group subsidiaries: they apply a greater quantity of the same
measures that are applied by independent enterprises.
10. Performance indices take industry-adjusted values using a method proposed by
Eisenberg et al. (1998) and represent the distances from the median performance
in each industry. The formula is:
Performance sign Performance
ad
j
⌬⌬ uPerformance
,
where ΔPerformance is the value obtained by subtracting the median perform-
ance in the corresponding industry from the sample firm’s performance.
11. Relevant analysis of regulated industries revealed a lack of impact of member-
ship in business groups on the output dynamics, self-assessment of financial
performance, and probability of not encountering financial problems. Table 9.2
presents, as an example, only the results of the analysis of profit increase for the
sample of enterprises in regulated industries. This result was not unexpected. A
decisive impact on the output dynamics and financial performance in regulated
industries is made by tariff and invest ment plan regulat ion and, to a lesser extent,
in the allocation of consumers to suppliers. Moreover, enterprises of major amal-
gamations, OJSC Svyazinvest and RAO UES of Russia, in regulated industries
fulfill a wide spectrum of obligations that restrict their profitability, including
the servicing of privileged categories of consumers and providing compulsory
(uninterruptible) services to special categories of clients.
Bibliography
Avdasheva, S., Shastitko, A., & Kuznetsov, B. (2007) Competition and industrial
organization in transition markets: What can we derive from empirical studies?
Post-Communist Economies, 19: 17–33.
Blanchard, O. & Kremer, M.(1997) Disorganization, Quarterly Journal of Economics,
112: 1091–1126.
Brown, D. J., Earle, J. S., & Telegdy, A. (2006) The productivity effects of privatiza-
tion: Longitudinal estimates from Hungary, Romania, Russia and Ukraine, Journal
of Political Economy, 114: 61–99.
Clarke, S. (2004) A very Soviet form of capitalism? The management of holding com-
panies in Russia, Post-Communist Economies, 16: 405–422.
9780230_217287_11_cha09. dd 230 5/14/2009 11:06:17 AM
Corporate Restructuring and Performance 231
Dementiev, V. E. (2000) Finansovo-promyshlennyie gruppy v strategiyi reformirov-
anoya rossiiskoy ekonomiki, Rossiyskii Ekonomicheskii Zhurnal, 11–12: 3–9.
Dolgopyatova, T. (ed.) (2003) Russian Industry: Institutional Development (Moscow:
SU-HSE Publishing House).
Dolgopyatova, T. (2005) Stock ownership and corporate control as determinants
of company modernization: The case of Russia. In: Proceedings of the 65th
Anniversary Conference of the Institute of Economics, Zagreb (The Institute of
Economics), pp. 533–564.
Dynkin, A. & Sokolov, A. (2002) Integrirovannyie biznes-gruppy v rossiyskoi
ekonomike, Voprosi Ekonomiki, 4: 78–95.
Eisenberg, T., Sundgren, S., & Wells, M. T. (1998) Larger board size and decreasing
firm value in small firms, Journal of Financial Economics, 48: 35–54.
Frye, T. (2004) Credible commitment and property rights: Evidence from Russia,
American Political Science Review, 98: 453–466.
Frye, T. (2006) Original sin, good works, and property rights in Russia, World Politics,
58: 479–504.
Gaddy, C. & Ickes, B. (1998) To restructure or not to restructure: Informal activities
and enterprise behavior in transition. Working paper 134, Ann Arbor: William
Davidson Institute, University of Michigan.
Guriev, S. & Rachinsky, A. (2005) The role of oligarchs in Russian capitalism, Journal
of Economic Perspectives, 19: 131–150.
Klepach, A. & Yakovlev A. (2004) O roli krupnogo biznesa v sovremennoi rossiiskoi
ekonomike (kommentariyi k dokladu Vsemirnogo banka), Voprosi Ekonomiki, 8:
36–45.
Pappe, Ya. (2000) Oligarkhi: Ekonomicheskaya khronika 1992–2000 (Moscow: SU-HSE
Publishing House).
Pappe, Ya. (2002a) Rossiyskii krupnii biznes kak ekonomicheskii fenomen:
Osobennosti stanovleniya i sovremennogo etapa razvitiya, Problemy
Prognozirovaniya, 1: 29–46.
Pappe, Ya. (2002b) Rossiyskii krupnii biznes kak ekonomicheskii fenomen:
Spetsificheskiye cherty, modeli ego organizatsiyi, Problemy Prognozirovaniya, 2:
83–97.
Pappe, Ya. & Galukhina, Ya. (2006) Rossiyskiye korporatsiyi: Ot oligarhicheskih
struktur do polnopravnih subjektov mirovogo rynka, Neprikosnovennyi Zapas,
48–49: 16–29.
Perotti, E. C. & Gelfer, S. (2001) Red barons or robber barons? Governance and
financing in Russian financial-industrial groups, European Economic Review, 45:
1601–1617.
Shumilov, A. V. & Volchkova, N. A. (2005) Russian business groups: Substitutes for
missing institutions? In: Sbornik dokladov shestoy mezhdunarodnoy konfer-
encii GY-VSHE “Modernizatsiya ekonomiki I vyratschivaniye institutov,” Vol. 2
(Moscow: SU-HSE Publishing House), pp. 183–194.
Yakovlev, A. A. & Danilov Y. A. (2007) Rossiiskaya korporatsiya na 20-letnem gori-
zonte: struktura sobstvennosti, rol’ gosudarstva i korporativnoye finansirovaniye,
Rossiyskii Zhurnal Menedzhmenta, 5: 3–34.
Yasin, E. (ed.) (2004) Structural Changes in the Russian Industry (Moscow: SU-HSE
Publishing House).
9780230_217287_11_cha09. dd 231 5/14/2009 11:06:17 AM
This page intentionally left blank
Part III
The Role of External Agents in
Corporate Governance
9780230_217287_12_cha10. dd 233 5/14/2009 4:23:29 PM
This page intentionally left blank
235
10
The Banking Sector and
Corporate Finance
Fumikazu Sugiura
Introduction
A corporate financing mechanism plays a pivotal role in a market economy
for growth. This chapter tries to clarify, both from a macro and a microeco-
nomic viewpoint, what sort of mechanism is emerging in Russia. The coun-
try has been experiencing positive economic growth since 1999. Now that
the effect of the drastic depreciation of the exchange rate in 1998 has faded,
Russia is facing a test as to whether a sustainable economic growth is possi-
ble even in the event of adverse price movement of major export items, such
as oil and gas, on international markets, or in other words, as to whether a
sufficiently self-sustaining system has been developed to enable continued
economic growth under market-economic principles. In the context of cor-
porate finance, the enterprises, which used to rely completely on the state
budget and the national bank (Gosbank) for their financing needs under the
erstwhile command economy, can no longer hope to do so after the regime
change. At the same time, they are now capable of making independent
decisions regarding their financial needs. Their behavior is influenced not
only by their needs but also by the efficiency of the financial sector as well
as by various institutional frameworks surrounding it. Reforms to the latter
were initiated from scratch after the regime change and have been evolving
ever since. Hence, a study of enterprise behavior in the area of corporate
finance would also clarify the extent to which the economic system has
been transformed (Sugiura 2007).
There is a potentially enormous demand for investment funds in Russia.
The manufacturing sector, founded and expanded in the socialist com-
mand economy, is now extensively burdened with obsolete machinery and
equipment. There is an acute need to enhance its competitiveness by replac-
ing them with new technologies and equipment. The demand for funds is
large, but the financial sector has not been able to cope with it due to its
immaturity as well as to an inadequate legal environment, such as a weak
creditor protection (Berglöf et al. 2003). The present economic growth may
9780230_217287_12_cha10. dd 235 5/14/2009 4:23:29 PM
236 Organization and Development of Russian Business
be attributed, to a large extent, to the continued use of the existing obso-
lete equipment. From the financial sector’s standpoint, on the other hand,
there had been ample opportunities for a much safer mode of operation in
the prevailing conditions of economic crises and political confusion, such
as speculation in foreign currencies or in government bonds (Matovnikov
2000). Such opportunities permitted financial institutions to take a cau-
tious or even negative attitude toward risky business-related investment
(Egorova & Smulov 2002; Bonin & Wachtel 2003). According to statistical
data on investment sources, neither the securities market nor the banking
sector was the major provider of funds for that purpose.
1
As a corollary, it
may be said that the financial crisis of 1998, contrary to earlier apprehen-
sion, did not spread to the wider economy. Rather, it helped subsequent
economic growth (Rabotsii Tsentr Ekonomicheskikh Reform 2002).
2
In examining corporate behaviors for investment finance under a mar-
ket economy, one has to take a wider view, taking into account such fac-
tors as the institutional environment and the degree of maturity of the
financial agents, not only of the countries concerned but also of others. An
examination of corporate behavior involving investment finance under a
market economy requires a broad view that considers such factors as insti-
tutional environment and the degree of maturity of the financial agents in
the countries concerned. A study of such behavior would better enable an
understanding of the basic growth mechanism of an economy, and, in this
chapter, we explore a “Russian-style” from this viewpoint.
A thorough understanding of the rapidly growing Russian economy requires
the consideration of both macro and micro approaches. We, therefore, con-
ducted the joint survey. The intentions were to clarify internal organizational
changes that enterprises had undertaken and their responses to a new exter-
nal environment. The latter relates to external relationships that regulate
enterprise activities, such as their relationships with local governments and
financial institutions. By comprehensively collating the survey results, we
intended to clarify the enterprise behavior of contemporary Russia from vari-
ous points of view. This research is the first step toward that objective.
For organization, the first section is an overview of the current status of the
Russian economy with an emphasis on the role of the financial sector. The sec-
ond section deals with the largest bank, Sberbank, and examines its behavior
in more detail. The third section, after a brief presentation of the survey results,
is an analysis of the empirical data regarding enterprise behavior on finance,
and the conclusion offers recommendations with policy implications.
The booming economy and corporate finance
High level of investment and its sources
The Russian economy has been maintaining strong growth. The GDP growth
rates have been positive ever since 1999. While the industrial production is
9780230_217287_12_cha10. dd 236 5/14/2009 4:23:29 PM
The Banking Sector and Corporate Finance 237
somewhat low, due in particular to the slowing of the oil and gas sector,
the investment boom is continuing. Capital intensive infrastructure and
resource exporting sectors take up about 60% of the total investment. Along
with recently surging consumptions, investment constitutes a main engine
of growth. Since the gross savings are high, the economy is considered capa-
ble, according to I = S macroanalysis, of supporting high levels of invest-
ment, provided there exist appropriate conditions (TsMAKP 2006).
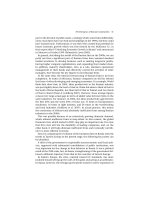
Let us now see what kind of financial sources have supported the booming
investment. According to macrodata on investment sources of enterprises
(excluding small firms), the share of internally generated funds declined
markedly from 53.2% in 1998 to 42.1% in 2006 (Table 10.1). Among exter-
nal sources, the budgetary and off-budgetary funds, which used to have a
share of 29.8% in 1998, came down to 19.3% in 2006. In contrast, borrow-
ings from banks and other enterprises increased nearly twice, from 4.8% to
9.6% for the former and 4.3% to 6.0% for the latter, during the same period.
Considering that external resources are beginning to play an increasingly
important role in private investment, a closer look at the development of the
financial sector with an emphasis on banking is warranted.
In the summer of 2004, several small banks were deprived of their
licenses in an anti-money laundering campaign of the Central Bank, and
there appeared a liquidity crisis in the interbank market. However, this
did not affect the aggressive attitude of banks in general for increased
lending to enterprises and organizations (Renaissance Capital 2005). The
crisis, moreover, reinforced the status of both Sberbank and the Bank
for Foreign Trade (VTB), whose deposits the citizens considered protected
by the state, as well as of some foreign-owned banks considered more
creditworthy. This tendency continued similarly in 2005 and thereafter
(Lepetikov 2005).
Table 10.1 Financing sources of fixed investment (%)
Year 1998 2000 2002 2003 2004 2005 2006
Total fixed investment 100.0 100.0 100.0 100.0 100.0 100.0 100.0
Internal sources 53.2 47.5 45.0 45.2 45.4 44.5 42.1
Borrowings of which 46.8 52.5 55.0 54.8 54.6 55.5 57.9
From banks 4.8 2.9 5.9 6.4 7.9 8.1 9.6
From other organizations 4.3 7.2 6.5 6.8 7.3 5.9 6.0
Federal budget 6.5 6.0 6.1 6.7 5.3 7.0 7.0
Local govt. budgets 12.6 14.3 12.2 12.1 11.6 12.3 11.8
Off-budget sources 10.7 4.8 2.4 0.9 0.8 0.5 0.5
Others 7.8 17.3 21.9 21.9 21.7 21.7 23.0
Source: The figures for 1998 from Rosstat (2003) and the figures for 2000 and later from Rosstat
(2007).
9780230_217287_12_cha10. dd 237 5/14/2009 4:23:29 PM