Báo cáo hóa học: "Biocompatible micro-sized cell culture chamber for the detection of nanoparticle-induced IL8 promoter activity on a small cell population" pot
Bạn đang xem bản rút gọn của tài liệu. Xem và tải ngay bản đầy đủ của tài liệu tại đây (12.65 MB, 14 trang )
NANO EXPRESS Open Access
Biocompatible micro-sized cell culture chamber
for the detection of nanoparticle-induced IL8
promoter activity on a small cell population
Yvonne Kohl
1
, Gertie J Oostingh
2
, Adam Sossalla
3
, Albert Duschl
2
, Hagen von Briesen
1*
and Hagen Thielecke
4
Abstract
In most conventional in vitro toxicological assays, the response of a complete cell population is averaged, and
therefore, single-cell responses are not detectable. Such averaging might result in misinterpretations when only
individual cells within a population respond to a certain stimulus. Therefore, there is a need for non-invasive in
vitro systems to verify the toxicity of nanoscale materials. In the present study, a micro-sized cell culture chamber
with a silicon nitride membrane (0.16 mm
2
) was produced for cell cultivation and the detection of specific cell
responses. The biocompatibility of the microcavity chip (MCC) was verified by studying adipogenic and neuronal
differentiation. Thereafter, the suitability of the MCC to study the effects of nanoparticles on a small cell population
was determined by using a green fluorescence protein-based reporter cell line. Interleukin-8 promoter (pIL8)
induction, a marker of an inflammatory response, was used to monitor immune activation. The validation of the
MCC-based method was performed using well-characterized gold and silver nanoparticles. The sensitivity of the
new method was verified comparing the quantified pIL8 activation via MCC-based and standard techniques. The
results proved the biocompatibility and the sensitivity of the microculture chamber, as well as a high optical
quality due to the properties of Si
3
N
4
. The MCC-based method is suited for threshold- and time-dependent analysis
of nanoparticle-induced IL8 promoter activity. This novel system can give dynamic information at the level of
adherent single cells of a small cell population and presents a new non-invasive in vitro test method to assess the
toxicity of nanomaterials and other compounds.
PACS: 85.35.Be, 81.16.Nd, 87.18.Mp
Keywords: micro-sized cell culture chamber, inflammation, nanoparticles
Background
There is a growing interest in improved test methods to
assess biological effects of nanoparticles. Studies of cel-
lular processes and determination of toxic effects of
nanomaterials on cells are commonly based on examin-
ing the response of a cellul ar population, such as a cell
monolayer, tissue, or organ [ 1-6]. In many biological
assays, such as colorimetric, fluorometric, or chemilumi-
nescent assays, the data are a result of the mean
response of the complete cell population. In those
assays, the signal of a single cell is lost in the signal
caused by the large cell sample. A detectable signal,
above the background noise, can be due to the response
of a specific subset of cells within the population or by
a response of the complete cell population. Especially
when performing biological studies with na noparticles,
there might be a large variation in the response of the
individual cells based on whether or not they came in
contact with nanoparticles and, in addition, on the level
of exposure, which is known to play an important role.
Since an altered response in a low n umber of cells c an
be the trigger for certain diseases, such as autoimmu-
nity, cancer, and neuronal diseases, the analysis of nano-
particle-induced responses of individual cells is of main
importance [7,8]. Therefore, cell-based assays that can
detect the response of a low number of individual c ells
are required. In addition, in vitro studies demonstrated
differences in the behavior of cells isolated or in a cell
* Correspondence:
1
Department of Cell Biology and Applied Virology, Fraunhofer Institute for
Biomedical Engineering, 66386 St. Ingbert, Germany
Full list of author information is available at the end of the article
Kohl et al. Nanoscale Research Letters 2011, 6:505
/>© 2011 Koh l et al; licensee Springer. This is an Open Access article distributed under the terms of the Creative Commons Attribution
License ( nses/by/2.0), which permits unrestricted use, distribution, and reproduction in any medium,
provided the original work is properly cited.
population [9-11], showing that isolated single cells
react in a different physiological manner compared to
cells within a monolayer or cell suspension. New meth-
odologies have to be established to bridge the gap
between population and quantitative single-cel l analysis.
Technologies for the characterization of single cells,
such as capillary electrophoresis (2D, 3D), polymerase
chain reaction (PCR), single-cell gel electrophoresis, and
elastography, are already used, but these are invasive
and often time-consuming te chniques [12-22]. Invasive
techniques destroy the cell and consequently do not
permit the detection of single living cells or to perform
kinetics on one and the same cell. Flow cytometry is
used to investigate nanoparticle-induced effects at the
single-cell level but is not suitable for the characteriza-
tion of adherent cells since the cells need to be in sus-
pension. Detachment of the cells from the surface of the
cell culture dish might alter their characteristics [23].
With regard to the application of single-cell analysis as
pharmaceutical in vitro screening method, the goal of
this study is the evaluation and validation of a non-inva-
sive technique to characterize cellular processes of
adherent biological cells on an individual level in a small
defined cell population. Biological microelectromechani-
cal systems (Bio-MEMS) present a suitable approach for
analyzing a small amount of cells on a defined cell cul-
ture area. Recently, classical detection technologies like
optical and electrochemical analysis and mass spectro-
scopy have been combined with the chip technology
[24-26]. Dynamic single-cell culture arrays of isolated
cells have enabled to determine the level of produced or
secreted proteins but do not simulate the physiological
conditions of a 2D cell culture [21,27]. Silicon nitride
(Si
3
N
4
) has been used as matrix for cell-based assays
due to its chemical, optica l, and mechanical properties
[28]. Only few studies exist on the biocompatibility of
Bio-MEM-materials [29-33]. Currently, no Bio-MEMS
exist for long-term culturing, and long-term observation
of cell response features larger, more comparable cell
culture area dimensions compared to the micro-sized
cell culture chamber presented in this paper [32,34-40].
At current, no Bio-MEMS exist for long-term cultiva-
tion and non-invasive quantification of specific cellular
responses of adherent individual cells in a small defined
cell layer cultured on miniaturized Si
3
N
4
membranes
with cell culture areas smaller than 0.2 mm
2
. The use of
a micro-sized chip-based cell culture system in combi-
nation with reporter cells presents a powerful tool for
the analysis of s mall cell populations and will improve
the evaluation of non-invasive in vitro test methods to
observe sub-toxic effects on individual adherent cells in
a small cell population under physiological conditions.
This article introduces a miniaturized microcavity chip
(MCC)-based method for the non-invasive analysis of
nanoparticle-induced effects of adherent single cells in a
small defined cell layer.
Results and discussion
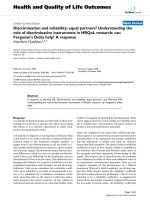
Fabrication of the miniaturized microcavity chip
An MCC was fabricated by semiconductor process
technology (Figure 1a). The design focused on the
improvement of the high-quality optical analysis of cel-
lular reactions of a small cell population compared to
conventional cell culture chambers. An 800-nm-thick
transparent Si
3
N
4
membrane forms the cell culture
area with a surface of 0.16 mm
2
. Due to the positive
optical and mechanical properties of Si
3
N
4
,themicro-
sized culture chamber has optimal optical properties
when using microscopic analysis methods. The seven
individual miniaturized cell culture chambers in each
cultivation segment guarantee a statistical analysis of
the generated data. The MCC represents an array of
miniaturized cell culture chambers for permanent non-
invasive characterization of individual cells in a cell
layer. The miniaturization of the cell culture area guar-
antees the observation of the complete cell culture area
(Figure 1b, c).
Currently, the 800-nm-thick transparent Si
3
N
4
mem-
brane used in this study is the thinnest membrane layer
available so far with good optical properties, allowing
easy analyzing of individual cells in a cell culture layer
with high optical quality. The six individual culture seg-
ments provide the opportunity to analyze different
materials or concent rations under identical physiological
conditions (Figure 1c).
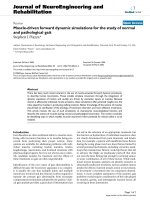
Each of the six culture segments possesses seven indi-
vidual microcavities which are used as cell culture
chambers (Figure 2a). The addition of a test substance
in one of the six culture segments guarantees a statisti-
cal analysis by the seven s eparate micro-sized cell cul-
ture chambers. The size of the Si
3
N
4
membranes of the
cell culture area (400 × 400 μm) (Figure 2b, c) was cho-
sen to observe the whole area with one microscopic
image (888 × 66 6 μm) and to guarantee a more physio-
logically real isti c cond ition compared to single-cell ana-
lysis, since about 200 to 250 cells are present in each
cavity and thus a small monolayer can be formed. To
observe all c ells of a cell layer in conventional cell cul-
ture chambers, the whole area has to be scanned, which
is a very time-consuming procedure. The advantage of
the miniaturized cell culture chamber is that the entire
cell culture area can be analyzed quickly with better
optical quality and without any changes of the cell
behavior.
Another advantage of the MCC is that optimal focus-
ing is possible, whereas polystyrene membranes of con-
ventional cell culture dishes only allow focusing in the
center of the cell culture area due to edge effects. The
Kohl et al. Nanoscale Research Letters 2011, 6:505
/>Page 2 of 14
Si
3
N
4
-cell culture area of the miniaturized system pos-
sesses a square shape due to its production process. Due
to the etch process, the end w alls are positioned i n an
angle of 54.7° amplifying the optical properties of the
cavity membrane due to the reduced edge effects. Preli-
minary experiments showed that the round shape of
conventional cell culture c hambers, like 96-well micro-
plates or 384-well microplates, resulted in edge e ffects,
leading to unfocused microscopic images of the cells.
Additionally, the correlations between fluorescent and
bright-field images did not conform to each other when
using conventional polystyrene cell culture chambers. In
contrast, the developed micro-sized cell culture chamber
reduced the working distance during microscopy due to
the 800-nm-thin Si
3
N
4
membrane. In addition, due to
the square shape of the cell culture chambers, the edge
effects are minimized resulting in clear focused micro-
scopic images with analogy bright-field and fluorescent
images with high optical quality. Furthermore, Si
3
N
4
fea-
tures minimal auto-fluorescence in comparison to
polystyrene.
Currently, only few microsystems exist for non-inva-
sive analysis of specific reactions o f individual cells in a
small adherent cell population via optical methods
[32,38]. Stangegaard et al. described a polymethylmetha-
crylate (PMMA) chip as mic ro cell culture system with
a cell culture area of 99 mm
2
[32]. In comparison to the
PMMA-micro cell culture system, the established MCC
with its 800-nm-thin Si
3
N
4
membranes offers a better
optical quality and can also be used for scanning elec-
tron microscopy (SEM). Compared to t he conventional
fluorescence-based analysis techniques, the combination
of a reporter cell line and the MCC presents a more
sensitive and cost-efficient in vitro method. Advantages
of the quantitative analysis via MCC are the low sample
volume, the small amount of test materials, the capture
of the complete cell culture area with high optical qual-
ity, and thus the possibility to statistically analyze the
variations between the individual cell responses.
Analysis of the biocompatibility of the MCC
The biocompatibility of the evaluated microcavity chip
was analyzed by culturing human bronchial epithelial
cells (A549 cells) in the miniaturiz ed cell culture cham-
ber for 48 h (F igure 3). The cells adhered onto the
Si
3
N
4
membranes and showed characteristic morpholo-
gies. Scanning electron microscopic images after 7 days
of cultivation of A549 cells confirmed their adherence
to the Si
3
N
4
membrane (Figure 3b). Moreover, the cells
did not only adhere to the Si
3
N
4
membrane but also to
the Si sides (Figure 3a, b). The viability of the A549
cells was verified after 7 days of proliferation via fluores-
cein diacetate (FDA)/propidium iodide (PI) staining
(Figure 3d). The viability after this prolonged incubation
period was 96.2 ± 0.3%. Furthermore, the suitability of
the miniaturized cell culture chambers for cultivation
and differentiation of sensitive in vitro systems was
determined.
Figure 1 The miniaturized cell culture chamber.(a) Work flow of
the fabrication. (b) Design of the MCC. The MCC contains 6 × 7
miniaturized cell culture chambers. (c) Photographic image of the
microcavity chip. Scale bar 5mm.
Kohl et al. Nanoscale Research Letters 2011, 6:505
/>Page 3 of 14
As sensitive in vitro system, PC-12 cells (rat adrenal
pheochromocytoma cells) were grown in the microcav-
ity. These cells are used as model c ells in tissue engi-
neering [41,42]. After adding the differentiation stimulus
nerve growth factor to the cell culture medium, the sus-
pension cells starte d to adhere and form neuronal
networks (Figure 3c). Mesenchymal stem cells (MSCs)
were used as a model for a sensitive in vitro system
[43]. The morphology of the human MSCs (hMSCs)
during proliferation is comparable to the morphology of
the cells cultured on polystyrene membranes as it is
common in conventional cell culture chambers like 96-
Figure 2 Microscopic imag es of the miniaturized cell culture chamber with a Si
3
N
4
membrane.(a) Photographic image. Scale bar 1,100
μm. (b) Phase contrast microscopic image. Scale bar 150 μm. (c) Scanning electron microscopic image. Scale bar 150 μm.
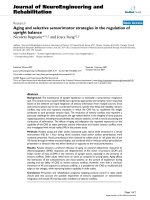
Figure 3 Microscopic images of different cell types cultured in the miniaturized cell culture chamber.(a) Scanning electron microscopic
image of A549 cells on the Si-sidewalls. Scale bar 20 μm. (b) Scanning electron microscopic image of A549 cells after 7 days of culture on the
Si
3
N
4
membrane. Scale bar 200 μm. (c) Scanning electron microscopic image of PC-12 cells 8 days after neuronal differentiation. Scale bar 100
μm. Small box: bright-field image of neuronal differentiated PC-12 cells. Scale bar 50 μm. (d) Fluorescence microscopic image of A549 cells after
7 days of cultivation after FDA/PI staining. Scale bar 50 μm. (e) Bright-field microscopic image of proliferating hMSCs after 7 days. Scale bar 100
μm. (f) Scanning electron microscopic image of hMSCs after 18 days adipogenic differentiation. Scale bar 100 μm. (g) Bright-field image of
adipogenic differentiated hMSCs. Scale bar 20 μm.
Kohl et al. Nanoscale Research Letters 2011, 6:505
/>Page 4 of 14
well microplates (Figure 3e). The adipogenesis was used
to determine the effect of miniaturization on the diffe r-
entiation capacity of hMSCs. Human MSCs were cul-
tured for 18 days in adipogenic differentiation medium.
Lipid droplets, which were formed as a result of adipo-
cytes, are visible by bright-field microscopy (Figure 3g).
Scanning electron microscopy (SEM) images of the adi-
pogenic differentiated hMSCs show a clear increase of
adipogenic differentiatedhMSCs,alsointhecorner
area s of the micro cavity (Figure 3f). The performed stu-
dies verify the biocompatibility of the Si
3
N
4
membrane
and the suitability of the microcavity for in vitro studies.
A549 cells as well as hMSCs proliferate in the microcav-
ity. Furthermore, we are t he first to demonstrate the
possibility to induce adipogenic differentiation of
hMSCs as well as a neuronal differentiation of PC-12
cell in the microcavity with a cell growth area of 0.16
mm
2
. Due to the high need for MSCs in the field of tis-
sue engineering, the micro-sized cell culture area opens
new potential for culturing and differentiation of 3D
MSCculturesaswellasstudyingstemcellnichesusing
relatively low numbers of cells which also allows the
inclusion of more repetitions and treatments. Such stu-
dies could provide insight in cancer s tem cell research,
since miniaturization allows a detailed observation of
the complete cell population in the cell culture chamber.
The microchip combined with neuronal cells provides a
basis for new methods for research on neuronal diseases
like Alzheimer or Parkinson disease, for the develop-
ment of new sensitive drug screening methods and for
the quantification of toxicodynamic and toxicokinetic
effects.
Application of the MCC for the analysis of nanoparticle-
induced effects
After confirmation of the bioco mpatibility of the evalu-
ated miniaturized cell culture chambers, the system was
validated for the non-invasive quantification of IL8 gene
promoter activations of individual cells of a small cell
population. Currently, mu ch research is ongoing to
deter mine potential effects of nanopar ticles on health of
workers and consumers. The amounts of engineered
nanoparticles with a range o f different sizes and shapes
and made from different materials are steadily growing,
and there i s a need to determine the biological response
to these novel materials. In this respect, the immune
system is of special interest, since one of the main func-
tions of t he immune system is to deal with foreign
materials [44].
In order to determine whether or not the MCC
method could be suitable for the analysis of nanoparti-
cle-induced immunomodulatory effects, a stable trans-
fected A549 reporte r cell line, containing the IL8
promoter sequence linked to the gene for green
fluorescence protein (pIL8-GFP), was established. The
sequence of the IL8 promoter was placed before the
GFP sequence, whereby GFP was used as a reporter
gene. IL8 promoter activation resulted in the generation
of GFP which was accumulated within the cell. Since
the original IL8 gene has not been replaced, the analysis
of IL8 expression by conventional methods is still feasi-
ble. Beyond that, the combination of the miniaturized
cell culture chamber and t he transfected reporter cell
line pIL8-GFP A549 allows the detection of specific IL8
promoter activity of individual cells in a small adherent
cell population. First of all, the cells were stimulated by
a pro-inflammatory stimulus to determine whether the
cells respond in an appropriate manner. Recombinant
human tumor necrosis factor alpha (rhTNF-alpha), a
cytokine involved in local and systemic inflammations,
was added to the cell culture. The GFP expression of
the transfected pIL8-GFP A549 cells verifies an IL8-
coupled inflammatory response. The kinetics and stabi-
lity of GFP was determined by stimulating the A549
cells with the rhTNF-alpha. Stimulation with rhTNF-
alpha showed a dose-dependent increase in GFP pro-
duction which peaked when using 20 ng/ml TNF-alpha
(unpublished observatio n). Moreover, the cell line could
be kept in culture for more than 1 month without a loss
of responsiveness to general cellular stimuli.
After 24 h exposure of the pIL8-GFP A549 cells with
20 ng/ml TNF-alpha, the GFP expression was quantified
via fluorescence spectrometry using a 96-well microplate
and via fluorescence microscopy using the micro-sized
cell cultur e chamber. The comparison of the two differ-
ent methods results in a higher response when using the
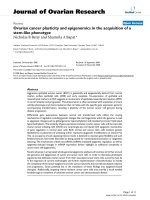
MCC-based technique (Figure 4a). By the miniaturized
method, GFP expression was detectab le in 59.2 ± 16.8%
of the cells in the microcavity compared to the
untreated control (Figure 4a). Via a 96-well microplate,
an increase of fluorescence intensity of 44.6 ± 9.7% was
proven (Figure 4a). Thereafter, the fluorescence intensity
of 90 individual GFP-expressing pIL8-GFP A549 cells
was quantified after incubation with TNF-alpha (20 ng/
ml) in the micro-sized cell culture chamber. The fluor-
escence intensity of each individual cell was quantified
digitally as pixel number. The pixel number of the 90
analyzed cells varied between 0 and 2,700 pixels per cell.
The histogram of the fluorescence intensity evidenced
that most stimulated cells have fluorescence intensities
with values less than 270 pixels (Figure 4b). This result
revealed that the MCC-based system is very sensitive
and feasible for quantifying GFP expression and d istin-
guishing the fluorescence intensity of individual cells in
a small cell population.
Chemicals but especially particles can interact with
single cells within a cell population and only induce a
response at a certain threshold concentration, which
Kohl et al. Nanoscale Research Letters 2011, 6:505
/>Page 5 of 14
varies from cell to cell, e. g., de pending on the cell cycle
stage or on previous exposures. T herefore, the analysis
and quantification of single-cell responses will provide
important information on the toxicity of the tested
materials. The MCC -based method is therefore qualified
as new non-invasive in vitro meth od for analyzing sin-
gle-cell responses of adherent cells under physiological
conditions.
In order to detect the suitability to use the developed
method for nanotoxicology studies, two nano-sized
materials (gold nanoparticles (GC10) and silver nano-
particles (SC10)) have been used for validating the new
non-invasive method. Before investigating the effect of
the nanoparticles on the IL8 promoter activation, they
were characterized physicochemically (Table 1). The
detected zeta-potential is a characteristic for uncoated
nano-scaled gold and correlates to the data described in
the literature [45-47].
To determine the inflammatory effect o f GC10, pIL8-
GFP A549 cells were cultured in presence of 30 μg/ml
nanoparticle suspension in th e microcavi ties (0.16 mm
2
)
and in the well of a 96- well plate (34 mm
2
)for24h.
For every cavity, the tot al number of cells and the num-
ber of fluorescent cells were determined by microscopy,
and the ratio of fluorescent cells was calculated. The
quantification of the fluorescence and bright-field
images resulted in an inc reased amount of fluorescent
cells (26.44 ± 4.09% ) in comparison to the conventional
method (19.8 ± 18.5%) (Figure 4a). In addition, the
fluorescence spectrometry resulted in a major standard
deviation. In contrast, the MCC-based method shows a
small standard deviation, which indicates that it is a
very sensitive and reproducible system. For correlating
the amount of nanoparticles and the inflammatory sta-
tus of a single cell, pIL8-GFP A549 cells were incubated
in 30 μg/ml GC10 or SC10 for 48 h. By fluorescence
microscopy, it was observed that the nanoparticles were
not located homogeneously on the cells and on the
membrane (Figure 5). However, no correlation was
observed between the amount of nanoparticles on the
cells and t he IL8 promoter activation. Nevertheless, the
overlay of the bright-field image (Figure 5a) and the
fluorescence image (Figure 5b, 1 and 2) of the GC10-
and SC10-treated pIL8-GFP A549 cells in the microcav-
ity allows quantification of the fluorescence intensity
and thus the inflammatory status of single cells.
The determination of the effect of miniaturization on
nanoparticle-induced inflammatory cell responses
resulted in a basal amount of untreated pIL8-GFP A549
cells varying between 8% and 11%, for all tested cell cul-
ture areas (Figure 6a). This is in agreement with pre-
vious experiences that A549 undergoes some degree of
activation by normal cell culture procedures and that
IL8 induction is a particularly sensitive signal. After
MC100 exposure, the amount of GFP-expressing cells
increased slightly but was still at the level of the
untreated control. After SC10 exposure, the amo unt of
fluorescent cells increased to 41.3 ± 5.1% (0.16 mm
2
),
36.0 ± 6.2% (11 mm
2
), and 43.3 ± 4.5% (34 mm
2
)(Fig-
ure 6a). The results obtained showed that the growth
area had no influence on the cell response.
Figure 4 GFP expression of TNF-alpha- and GC10-exposed
pIL8-GFP A549 cells. pIL8-GFP A549 cells were cultured in the
microcavities and exposed to 20 ng/ml TNF-alpha or 30 μg/ml
GC10 for 24 h under physiological conditions. In parallel, 10,000
pIL8-GFP A549 cells were seeded in 96-well microplates and
stimulated with 20 ng/ml TNF-alpha and 30 μg/ml GC10 for 24 h.
After the exposure time, the GFP expression of the pIL8-GFP A549
cells in the microcavities was analyzed by fluorescence microscopy.
The percentage of GFP-expressing cells in the microcavity was
calculated via the software analysis. The GFP expression of the pIL8-
GFP A549 cells in the 96-well micro plate was quantified by
fluorescence spectrometry. The percentage of GFP expression is
pictured as alteration to the untreated control (alteration to control/
percent). (b) pIL8-GFP A549 cells were treated for 24 h with 20 ng/
ml TNF-alpha in the microcavities. The GFP expression of 90
individual cells was quantified. The classes of the fluorescence
intensities (x-axis: class of GFP intensity) and its frequency (y-axis:
frequency) is presented.
Kohl et al. Nanoscale Research Letters 2011, 6:505
/>Page 6 of 14
Table 1 Physicochemical characterization of the used nanoparticles
Nanoparticle Material Diameter (nm) zeta-potential (mV) Absorption maxima (nm)
GC10 Gold 9.0 ± 0.03 -33.8 ± 1.82 515
SC10 Silver 7.37 ± 0.03 -41.03 ± 0.9 395
MC100 Magnetite 63.8 ± 0.37 -4.5 ± 0.55 320
Figure 5 Microscopic images of SC10- and GC10-treat ed pIL8-GFP A549 cells in the microcavity. pIL8-GFP A549 cells were treated for 48
h with (2) GC10 and (3) SC10 under physiological conditions. (a) Bright-field image. Scale bar 50 μm. (b) Fluorescence image. Scale bar 50 μm.
(c) Overlay of the bright-field and the fluorescence images. Scale bar 50 μm. (d) Overlay of the bright-field and the fluorescence images of
individual GC10-exposed pIL8-GFP A549 cells. Sections of this image are pictured in (d1 to d4). Beside individual GFP-expressing pIL8-GFP A549
cells interacting with nanoparticle aggregates (d1, d2), also GFP-expressing cells with few or less nanoparticle interaction were observed (d3, d4).
Kohl et al. Nanoscale Research Letters 2011, 6:505
/>Page 7 of 14
The cytotoxic effect of SC10 and MC100 was evalu-
ate d using the WST-1 assay. MC100 induced a concen-
tration-dependent cytotoxicity but a low decrease in
mitochondrial activity with a maximum reduction of
20% when cells were treated with 50 μg/ml MC100. In
contrast, SC10 had an IC
50
value of 27 μg/ml in pIL8-
GFP A549 cells, which correlated with the effect of
SC10 on IL8 promoter activation (Figure 6b and 7b).
The reduction in fluorescence intensity at higher con-
centrations could therefore be caused by the cytotoxic
effects of SC10. A maximal reduction of the mitochon-
drial activity of 38% was found when cells were treated
with 50 μg/ml SC10 (Figure 6b).
Besides the threshold-dependent detection of inflam-
matory reactions, the usability of the MCC-based system
to determine time-dependent inflammatory processes
was tested. By time-lapse microscopy, SC10 induced a
time-dependent increase of the amount of GFP-expres-
sing pIL8-GFP A549 cells in the microcavity. After 26 h,
the percentage of fluorescent cells decreased to the
fluorescence level of untreated pIL8-GFP A549 cells
Figure 6 Effect of nanoparticles on pIL8-GFP A549 cells.(a)
Effect of miniaturization on nanoparticle-induced inflammation in
pIL8-GFP A549 cells. pIL8-GFP A549 cells were cultured on three
different growth areas (0.16, 11, and 34 mm
2
) and exposed to 20
μM SC10 and 20 μM MC100 for 24 h under physiological
conditions. The percentage of GFP-expressing cells per growth area
was analyzed by fluorescence microscopy. The amount of GFP-
expressing pIL8-GFP A549 cells in relation to the cell growth area is
depicted. The results are presented as mean of three independent
experiments ± SD. (b) Concentration-dependent effect of
nanoparticles on mitochondrial dehydrogenase activity of pIL8-GFP
A549 cells. pIL8-GFP A549 cells were exposed to 0 to 50 μg/ml
SC10 und MC100 for 24 h under physiological conditions. Triton X-
100 was used as positive control. Via WST-1 assay the mitochondrial
dehydrogenase activity was quantified. Untreated cells were set as
100%. The results are presented as mean of three independent
experiments ± SD compared to the untreated control.
Figure 7 Concentration- and time-dependent effects of
nanoparticles on the GFP expression of pIL8-GFP A549 cells.(a)
pIL8-GFP A549 cells were cultured in the microcavities and exposed
to 30 μg/ml GC10 and SC10 for 48 h. The GFP expression of the pIL8-
GFP A549 cells was analyzed via fluorescence time-lapse microscopy.
The percentage of GFP-expressing cells was quantified using the
software analysis. (b) pIL8-GFP A549 cells were treated with 0 to 50
μg/ml SC10 for 24 h in the microcavity under physiological
conditions. Parallel 10,000 pIL8-GFP A549 cells were cultured and
treated in a 96-well microplate with 0 to 50 μg/ml SC10. The GFP
expression of the pIL8-GFP A549 cells in the microcavities was
analyzed by fluorescence microscopy and the GFP expression of the
cells in the microplate by fluorescence spectrometry.
Kohl et al. Nanoscale Research Letters 2011, 6:505
/>Page 8 of 14
(Figure 7a). The amount of GFP-expressing GC10-trea-
ted cells remained on the control level, and after 30 h,
the amount of fluorescent cells increased to 12.9 ± 4.1%
and ranges in the following 18 h between 9.8 ± 2.5%
and 15.8 ± 0.5% (Figure 7a).
To test the use of the micro-sized cell culture for
determination of thresh old-dependent effects, pIL8-GFP
A549 cells were incubated with 0 to 50 μM SC1 0 for 24
h at 37°C. Ten micrograms per milliliter of SC10
induced an increase in fluorescence intensity of 25%,
and 20 μg/ml induced a significant increase of 40% (Fig-
ure 7b), whereas concentrations higher than 40 μg/ml
caused no significant increase in fluorescence intensity
compared to the untreated control. Inflammatory effects
as well as cytotoxic effects are threshold-dependent
effects. Low concentrations leading to an inflammatory
process could cause cytotoxic effects, but normally this
is not the case. If a cytotoxic effect is induced, the con-
centration is often too high to activate the inflamma-
tion-specific pathways in the cells. In our experiments,
the exposure time of 24 h concentrations up to 20 μg/
ml resulted in a significant IL8 promoter activation
quantified as GFP expression and concentrations higher
than 30 μg/ml resulted in a significant decrease of cell
viability as analyzed by WST-1 assay resulting in less
GFP expression (Figure 6b and 7b).
The combination of the miniaturized cell culture
chamber and the transfected reporter cell line pIL8-GFP
A549 realizes the establishment of a chip-based in vitro
method as non-invasive technique for detecting inflam-
matory processes of adherent cells in a small cell popu-
lation. Compared to the 96-well microplates, the new
miniaturized cell culture chamber enables a fast and
sensitive quantification of IL8 promoter activations that
is based on the analysis of individual cells within a
population.
It has been described that the physical properties of
nanoscale materials can interfere with the analysis of
toxicological parameters [ 48,49]. The MCC-based
method is based on optical analysis followed by digital
quantification of the induced GFP expression of every
individual cell in the microcavity. One advantage of the
miniaturized method is the recording of the complete
cell culture a rea in one image. Hence, every individual
cell response is involved in the assessment of the
inflammatory status. By observing every individual cell,
the interference of the physical properties of the nano-
particles with the fluorescence spectrometric analysis
was avoided. Besides reproducibility and sensitivity, the
use of the miniaturized system for the detection of
thres hold-dependent effects was tested. The comparison
of the data obtained using a 96-w ell microplate and the
developed micro-sized cell culture chamber verified the
suitability of the microcavities as biocompatible cell
culture chamber with better optical quality and the suit-
ability of the MCC in combination with the transfected
reporter cell line pIL8-GFP A549 as new non-invasive in
vitro method for the continuous observation of GFP
expression and the quantification of concentration- and
time-dependent nanoparticle-induced IL8 promoter acti-
vation in adherent cells of a small cell population.
Conclusions
The goal of this s tudy was to establish a biocompatible
micro-sized cell culture chamber and to prove its applic-
ability to determine nanoparticle-induced effects of an
individual cell of a small cell population.
The need to develop non-invasive in vitro methods to
detect nanoparticle-induced effects of a small cell popu-
lation is high and can be illustrated in conjunction with
the European chemical regulation REACH [50]. Previous
methods for nanotoxicity studies are OECD standar-
dized techniques; most of these ignore the individual
differences within a cell population and can therefore
lead to misinterpretations. The development of the
MCC, described in this manuscript, allowed us to cul-
ture cells in a way in which their behavior is comparable
to that observed in conventional cell culture systems.
Compared to macro-scale cell culture chambers, the
MCC offers the opportunity for culturing, long-term
observation, and manipulation of a small amount of
cells on a defined cell culture area. Using this non-inva-
sive system, individual cells could easily be observed and
specific cell reactions could be quantified.
The bottom of the miniaturized cell culture chambers
was made of Si
3
N
4
membranes to ensure biocompatibil-
ity as well as excellent optical properties for cell analysis.
The small size of cavities enables a high number of cav-
ities on each chip and facilitates the performance of
many independent assays on one plate. The funnel-
shaped cavities avoid the appearance of meniscuses, and
therefore, the total cell growth area can be used for ana-
lysis. Moreover, t he miniaturization a llows the micro-
scopic analysis of the entire cell population in the cavity
in one microscopic field. The detection of the complete
cell layer guarantees reproducible results without any
subjective choice of representative areas of the cell
monolayer.
Besides the advantage of convenient handling, the
microscopic analysis of small amounts of cells and
nanomaterials increase the through-put rate of the
experiments, resulting in a time- and cost-effective
method. The established cell culture ch amber (0.16
mm
2
) is a biocompatible chamber with the thinnest
(800 nm) transparent cell culture layer existing, resulting
in high optical quality. Therefore, the proposed in vitro
method bridged the gap between population measure-
ments and quantitative single-cell analysis. Such a non-
Kohl et al. Nanoscale Research Letters 2011, 6:505
/>Page 9 of 14
invasive system could be used to investigate the nano
(immuno-)toxicity on an individual cell level, followed
by selectiv e quantitative analysis of the induced
intensity.
Methods
Fabrication of the miniaturized cell culture chamber
A miniaturized microcavity chip (MCC) (length 3 cm,
width 2.5 cm) was fabricated by semiconductor process
technology. Base material was a 500- μm-thick < 100 >
orientated silicon (Si) wafer, coated double-sided with
an 800-nm-thick silicon nitride (Si
3
N
4
) layer. Design
and fabrication are shown in Figure 2. The MCC consist
of six cavities (length of the outline 4,000 × 4,000 μm,
depth 400 μm), whe re each have seven sepa rate funnel-
shaped microcavities (length of the outl ine 400 × 400
μm, depth 100 μm). These represent the miniaturized
cell culture chambers with a Si
3
N
4
membrane and a
growth area of 0.16 mm
2
. Prior to the application of the
MCC for biological analysis, they were autoclaved at
121°C, 2 bar, for 15 min.
Cell lines and culture conditions
All cell culture reagents were obtained from Invitrogen
(Karlsruhe, Germany), unless stated otherwise. The
human lung epithelial carcinoma cells A549 (ATCC no.
107) were cultured in RPMI medium supplemented with
L-glutamine (4 mM), penicillin (100 U/ml), streptomy-
cin (100 μg/ml), and 10% (v/v) fetal calf serum (FCS).
PC-12 cells (rat adrenal pheochromocytoma cells,
ATCCno.159)wereculturedinRPMImediumsupple-
mented with L-glutamine (4 mM), penicillin (100 U/ml),
streptomycin (100 μg/ml), 10% (v/v)horseserum,and
5% (v/v) FCS. For neuronal differentiation, RPMI med-
ium was supplemented with 0.5% horse serum, 0.25%
FCS, and 1% nerv e growth factor. Human mesenchymal
stem cells (hMSCs) were isolated from the bone marrow
of human thighbone of human donors as described in
literature [51]. The thighbones were kindly provided
from the Protestant hospital in Zweibrücken (Germany)
fromDr.M.MaueandDr.Hassinger.Dr.E.Gorjup
(Fraunhofer IBMT, St. Ingbert, Germany) isolated the
hMSCs with a declaration of consent of each patient.
hMSCs were cultured in alpha-MEM supplemented
with penicillin (50 U/ml), streptomycin (50 μg/ml), and
15% (v/v) heat-inactivated FCS (proliferation medium).
For adipogenic differentiation, the proliferat ion medium
was exchanged by differentiation medium (alpha-MEM
supplemented with penicillin (50 U/ml), streptomycin
(50 μg/ml) and 10% (v/v) FCS, 100 ng/ml insulin, 100
mM dexamethasone, 200 μM indomethacin, and 500
μM isobuthylmethylxanthine. Stable c lones of pIL8
GFP-transfected A549 cells (A549 pIL8 GFP, see below)
were cultured in the RPMI medium (suppleme nted with
L-glutamine (4 mM), penicillin (100 U/ml), streptomy-
cin (100 μg/ml), and 10% (v/v)FCS)inthepresenceof
G418 (0.5 mg/ml final concentration).
Cells were maintained in a 5% CO2 humid ified atmo-
sphere at 37°C.
Experimental procedure
The experimental design is schematically depicted in
Figure 8. To reduce the evaporation of the cell cultur e
medium in the micro-sized cell culture chambers, a bio-
compatible cell culture chamber was positioned on the
top of the MCC. Each chamber of the covered silicone
FlexiPerm
®
chamber (Greiner Bio-One, Frickenhausen,
Germany) includes seven individual miniaturized micro-
cavities for statistical analysis of the experimental data.
For each experiment, 100 μl cell suspension (100,000
cells/ml) were placed in each of the six culture seg-
ments. After 30 min, the cells adhered onto the Si
3
N
4
membrane. The segments of the cell culture chamber
were filled with 100 μl cell c ulture medium. After 24 h
of cell proliferation, the cells were exposed to the nano-
particles by aspirating the medium, washi ng the cells
with PBS and adding the nanoparticle-containing med-
ium. After the exposure time, the cells were analyzed
microscopically. The total number of cells and the num-
ber of fluorescent cells were counted, and the percen-
tage of GFP-expressing cells was calculated.
Generation of the stably transfected reporter gene cell
line
The host cells used for this study were A549 cells
(ATCC no. 107). The human A549 cell line w as trans-
fected with an expression vector encoding green fluores-
cence protein (GFP) and an insert that encodes for the
IL8 promoter region. The pTurboGFP-PRL expression
vector was obtained from Evrogen (Moscow, Russia).
This construct is a circular bacterial DNA which con-
tains genes coding for ampicillin and neomycin resis-
tance, allowing selection in respective bacteria and after
transfection in human cells. Essential is that the con-
struct also contains the GFP gene, as a reporter gene.
The IL8 promoter sequence was amplified from human
genomic DNA (Roche Diagnostics GmbH, Mannheim,
Germany) by reversed transcriptase polymerase chain
reactions (RT-PCR) using the forward primer 5’-ata ctc
gag ggg tac ctt cgt cat act ccg tat ttg ata agg aac a-3’
and the reverse primer 5’-aga att cgc ata gat ctt ccg gtg
gtt tct tcc tgg ctc tt-3’, containing the restriction enzyme
sequences for Xho I and Eco RI, respectively, to allow
cloning into the multiple cloning site. PCR with these
primers resulted in an IL8 promoter fragment of 250 bp
(NCBI NM 000584). The promoter fragment was chosen
to include the main regulatory sites required for func-
tional control of transcription. A fter cloning and
Kohl et al. Nanoscale Research Letters 2011, 6:505
/>Page 10 of 14
plasmid isolation using standard techniques, A549 c ells
were transfected using Effectene (Qiagen, Hilden, Ger-
many) following the distributors’ instructions. After
transfection, cells were cultured in the presence of 0.5
g/l G418 (gentamicin). The single-cell-derived clones of
viable cells containing the insert, as verified by RT-PCR,
were expanded. Batches of the stably transfected cell
lines were frozen in liquid nitrogen, and indiv idual ali-
quots of the stably transfected cells were not placed in
culture for more than 1 month.
Physicochemical characterization of the nanoparticles
To ensure a good comparability of our results with
those obtained in other studies, we have chosen nano-
particles which have been selected by the National Insti-
tute of Standards and Technology as certified reference
materials for preclinical biomedical research. The com-
mercially available gold nanoparticle solutions, synthe-
sized by the Frens method [52], were purchased from
BBInternational (Cardiff, UK). These particles were
spherical gold nanoparticles, 10 nm in size (type gold
colloid GC10). The utilized silver nanoparticles (SC10)
with a diameter of 10 nm were purchased from Plasma-
Chem GmbH (Berlin, Germany). The iron oxide
nanoparticles (MC100) with a mean diameter of 100 nm
possess a starch shell and are also commercially avail-
able (Chemicell GmbH, Berlin, Germany). The colloidal
aqueous nanoparticle suspensions were sterile filtered to
exclude any bacterial contamination (pore size 0.22 μm).
The nanoparticles were characterized by dynamic light
scattering, surface charge (zeta potenti al), and by
absorption spectroscopy. For determining the size distri-
bution of the nanoparticles, dynamic light scattering
measurements have been performed on a Malvern Zeta
Sizer Nano ZS (Malvern Instruments Ltd., Worcester-
shire, UK) using disposable clear zeta cells (DTS
1060C). The average diameter and polydispersity index
(PDI)wereprovidedbytheinstrumentusinggeneral
purpose analysis. The zeta average diameter and PDI
reported herein were obtained as the average of three
independent measurements (10 repetitions per measu re-
ment) performed on each sample. Zeta potential mea-
surements were performed using a Malvern Instruments
Zetasizer Nano (Malvern Instruments Ltd), operating
with a variable-power (5 to 50 mW) He-Ne laser at 632
nm. Measurements were taken in zeta cells (DTS
1060C) at 25°C and repeated three times (10 repetition s
per measurement) for each sample. UV-visible (UV/Vis)
Figure 8 Schematic experimental design. To reduce the evaporation of the cell culture medium, a biocompatible cell culture chamber was
positioned on the top of the MCC. Each chamber of the covered silicone FlexiPerm
®
chamber includes seven individual miniaturized
microcavities for statistical analysis of the experimental data. For each experiment, 100 μl cell suspension (100,000 cells/ml) were placed in each
of the six culture segments. After 30 min, the cells adhered on the Si
3
N
4
membrane. The segments of the cell culture chamber were filled with
100 μl cell culture medium. After 24 h of cell proliferation, the cells were exposed to the nanoparticles by aspirating the medium, washing the
cells with PBS, and adding the nanoparticle-containing medium. After the exposure time, the cells were analyzed microscopically.
Kohl et al. Nanoscale Research Letters 2011, 6:505
/>Page 11 of 14
absorption spectra were taken on a two-beam UV/Vis
spectrometer (Lambda 950, Perkin Elmer, WalthamMas-
sachusetts, USA). The UV-visible absorption spectra of
both gold nanoparticle suspensions were recorded at
room temperature. For the experiments , the wavelength
ranging from 250 to 700 nm was used.
Determination of the mitochondrial activity
The mitochondrial function of the incubated cells was
analyzed using the WST-1 assay (Roche Diagnostics
GmbH). This assay is based on the clea vage of stable
tetrazolium salt WST-1 by metabolically active cells to
an orange formazan dye. The WST-1 assay was per-
formed according to the manufacturer’sinstructions,
with appropriate controls. After nanoparticle exposure,
the cells were incubated with the ready-to-use WST-1
reagent for 4 h. After this incubation period, formazan
formation was quantified by absorbance measurements
at 650 nm. The net absorbance change taken from the
well s of untreated cultured cells was scaled to 100% cell
viability.
Determination of cell viability by FDA/PI staining
To differentiate b etween viable and dead cells, fluores-
cein diacetate (FDA)/propidium iodide (PI) (Sigma-
Aldrich, Deisenhofen, Germany) staining was performed.
FDA, a membrane permeable dye, is metabolized by
viable cells to a green fluorescent dye. PI intercal ates in
nucleic acids and is unable to penetrate the cell mem-
brane and therefore stains membrane-damaged cells
only. Cell viability of A549 cells was determined by cul-
turing the cells for 48 h on the Si
3
N
4
membrane at 37°C
and 5% CO
2
. Afterwards, the cells were treated with the
fluorescent dye mixture for 15 s. Thereafter, the cells
were washed once with PBS to remove excessive dye
molecules. The cells were observed under a Zeiss Obser-
ver Z1 fluorescence microscope (Zeiss, Jena, Germany)
using ex
FDA
470 nm/em
FDA
525 nm and ex
FDA
555 nm/
em
FDA
602 nm. The percentage of the viab le and dead
cells was analyzed using the cell imaging analysis
software.
Time-lapse microscopy
Time-dependent nanoparticle-induced GFP expression
was quantified using time-lapse microscopy. The system
Biostation IM-Q (Niko n, Düsseldorf, Germany) is com-
posed of a microscope, an incubator, and a high-resolu-
tion camera. The combinatio n of an LED and a
fluorescence filter provides the opportunity for fluores-
cence quantification. pIL8-GFP A549 cel ls were exposed
to 30 μg/ml GC10 or SC10 in the micro culture cha m-
ber at 37°C for 48 h. Every hour, a phase contrast and a
fluorescent (ex 472 nm/em 520 nm) image of the entire
cell culture area were taken of the same section of the
sample. The amount of fluorescent cells was quantified
via the software analysis.
Scanning electron microscopy
For SEM of adipogenic differentiated hMSCs, neuronal
differentiated PC-12 cells, and A549 cells, the cells were
fixed with cacodylate/glutaraldehyde buffer and con-
trasted using 2% osmium tetroxide and 1% tannic acid.
After dehydrating the cells with ethanol, they were dried
in a critical point dryer CPD-7501 (Quorum Technolo-
gies Ltd., East Sussex, UK) and covered with gold. Sam-
ples were e xamined in a scanning electron microscope
EM 109T (Zeiss) using secondary electron mode.
Quantification of pIL8-GFP induction
For quantification of an induced inflammatory reaction,
the reporter cells pIL8-GFP A549 were used. The induc-
tion of the promoter is l inked to t he production of the
inflammatory cytokine, and consequently, the intensity
of the IL8 promoter activation is proportional to the
GFP expression, which could be quantified microscopi-
cally and fluorometrically. For fluorometric quantifica-
tion of GFP expression 300 to 10,000 cells per well were
exposedtoGC10orSC10(0to50μg/ml) for 24 h at
37°C. After washing the cells with PBS, the GFP inten-
sity (ex 485 nm/em 535 nm) was quantified fluorometri-
cally using a Tecan plate reader (Tecan Deutschland
GmbH, Crailsheim, Germany) . RhTNF-alpha, as inflam-
mation stimulating agent, was used as positive control.
The IL8 promoter activation of pIL8-GFP A549 cells
cultured in the micro cell culture chambers was ana-
lyzed after SC10 or GC10 exposure (24 h) by fluores-
cence microscopy.
Statistical analysis
Independent experiments were performed three times in
triplicates (n = 9), and the data are presented as mean ±
SD. Statistical significance was established as p <0.01.
Statistical tests were performed using the Mann-Whit-
ney U test.
Abbreviations
Bio-MEM: biological microelectromechanical systems; DNA: deoxyribonucleic
acid; FCS: fetal calf serum; GC: gold colloidal nanoparticles; GFP: green
fluorescent protein; hMSCs: human mesenchymal stem cells; MC: magnetite
colloidal nanoparticles; MCC: microcavity chip; OECD: Organisation for
Economic Co-operation and Development; PBS: phosphate-buffered saline;
PCR: polymerase chain reaction; pIL8: interleukin-8 promoter; PMMA:
polymethylmethacrylate; REACH: Registration: Evaluation: Authorisation and
Restriction of Chemicals; rhTNF-alpha: recombinant tumor necrosis factor-
alpha; SC: silver colloidal nanoparticles; Si
3
N
4
: silicon nitride; TNF: tumor
necrosis factor.
Acknowledgements
We thank Dipl Chem. Rainer Lilischkis (University of Life Science
Kaiserslautern, Institute for Information & Microsystems Technology,
Germany) for his assistance with SEM experiments; Dr. M. Maue and Dr.
Kohl et al. Nanoscale Research Letters 2011, 6:505
/>Page 12 of 14
Hassinger (Protestant Hospital, Zweibrücken, Germany) for kindly providing
the thigh bones; and Dr. Erwin Gorjup (Fraunhofer IBMT, St. Ingbert,
Germany) for isolating the hMSCs. This work was supported by the EU under
the Framework VI project DIPNA (Development of an Integrated Platform for
Nanoparticle Analysis to verify their possible toxicity and eco-toxicity) (STRP
032131 DIPNA).
Author details
1
Department of Cell Biology and Applied Virology, Fraunhofer Institute for
Biomedical Engineering, 66386 St. Ingbert, Germany
2
Department of
Molecular Biology, University of Salzburg, 5020 Salzburg, Austria
3
Department
of Medical Engineering and Neuroprosthetics, Fraunhof er Institute for
Biomedical Engineering, 66386 St. Ingbert, Germany
4
Vanguard AG, 12623
Berlin, Germany
Authors’ contributions
YK carried out the cytotoxicity studies, performed the nanoparticle
characterization, designed the miniaturized cell culture chambers,
participated in their fabrication, and wrote the main parts of the manuscript.
GO carried out the transfection of the reporter cell line and was involved in
the preparation of the manuscript. AS fabricated the microcavity chip. AD
and HT obtained funding for this project and helped to draft the
manuscript. HB helped to draft the manuscript. All authors read and
approved the final manuscript.
Competing interests
The authors declare that they have no competing interests.
Received: 20 April 2011 Accepted: 23 August 2011
Published: 23 August 2011
References
1. Arora S, Jain J, Rajwade JM, Paknikar KM: Cellular responses induced by
silver nanoparticles: in vitro studies. Toxicol Lett 2008, 179:93-100.
2. Choi SJ, Oh JM, Choy JH: Toxicological effects of inorganic nanoparticles
on human lung cancer A549 cells. J Inorg Biochem 2009, 103:463-471.
3. Lanone S, Rogerieux F, Geys J, Dupont A, Maillot-Marechal E, Boczkowski J,
Lacroix G, Hoet P: Comparative toxicity of 24 manufactured nanoparticles
in human alveolar epithelial and macrophage cell lines. Part Fibre Toxicol
2009, 6:14.
4. Lewinski N, Colvin V, Drezek R: Cytotoxicity of nanoparticles. Small 2008,
4:26-49.
5. Uboldi C, Bonacchi D, Lorenzi G, Hermanns MI, Pohl C, Baldi G, Unger RE,
Kirkpatrick CJ: Gold nanoparticles induce cytotoxicity in the alveolar type-
II cell lines A549 and NCIH441. Part Fibre Toxicol 2009, 6:18.
6. Ying E, Hwang HM: In vitro evaluation of the cytotoxicity of iron oxide
nanoparticles with different coatings and different sizes in A3 human T
lymphocytes. Sci Total Environ 2010, 408:4475-4481.
7. Anderson EC, Hessman C, Levin TG, Monroe MM, Wong MH: The role of
colorectal cancer stem cells in metastatic disease and therapeutic
response. Cancers (Basel) 3:319-339.
8. Rajaraman R, Guernsey DL, Rajaraman MM, Rajaraman SR: Stem cells,
senescence, neosis and self-renewal in cancer. Cancer Cell Int 2006, 6:25.
9. Fitzpatrick LA, Leong DA: Individual parathyroid cells are more sensitive
to calcium than a parathyroid cell population. Endocrinology 1990,
126:1720-1727.
10. Petrasek D, Samtaney R, Cohen DS: Glandular regulation of interstitial
diffusion: a model and simulation of a novel physiological mechanism.
Am J Physiol Endocrinol Metab 2002, 283:E195-206.
11. Sun F, Maercklein P, Fitzpatrick LA: Paracrine interactions among
parathyroid cells: effect of cell density on cell secretion. J Bone Miner Res
1994, 9:971-976.
12. Arkhipov SN, Berezovski M, Jitkova J, Krylov SN: Chemical cytometry for
monitoring metabolism of a Ras-mimicking substrate in single cells.
Cytometry A 2005, 63:41-47.
13. Das G, La Rocca R, Lakshmikanth T, Gentile F, Tallerico R, Zambetti LP,
Devitt J, Candeloro P, De Angelis F, Carbone E, Di Fabrizio E: Monitoring
human leukocyte antigen class I molecules by micro-Raman
spectroscopy at single-cell level. J Biomed Opt 2010, 15:027007.
14. De Angelis F, Das G, Candeloro P, Patrini M, Galli M, Bek A, Lazzarino M,
Maksymov I, Liberale C, Andreani LC, Di Fabrizio E: Nanoscale chemical
mapping using three-dimensional adiabatic compression of surface
plasmon polaritons. Nature Nanotechnology 2010, 5:67-72.
15. Ebert A, Tittmann BR, Du J, Scheuchenzuber W:
Technique for rapid in
vitro single-cell elastography. Ultrasound Med Biol 2006, 32:1687-1702.
16. Hu S, Le Z, Krylov S, Dovichi NJ: Cell cycle-dependent protein fingerprint
from a single cancer cell: image cytometry coupled with single-cell
capillary sieving electrophoresis. Anal Chem 2003, 75:3495-3501.
17. Hu S, Le Z, Newitt R, Aebersold R, Kraly JR, Jones M, Dovichi NJ:
Identification of proteins in single-cell capillary electrophoresis
fingerprints based on comigration with standard proteins. Anal Chem
2003, 75:3502-3505.
18. Krylov SN, Arriaga E, Zhang Z, Chan NW, Palcic MM, Dovichi NJ: Single-cell
analysis avoids sample processing bias. J Chromatogr B Biomed Sci Appl
2000, 741:31-35.
19. Lantz AW, Bao Y, Armstrong DW: Single-cell detection: test of microbial
contamination using capillary electrophoresis. Anal Chem 2007,
79:1720-1724.
20. Roers A, Hansmann ML, Rajewsky K, Kuppers R: Single-cell PCR analysis of
T helper cells in human lymph node germinal centers. Am J Pathol 2000,
156:1067-1071.
21. Yun KS, Yoon E: Micro/nanofluidic device for single-cell-based assay.
Biomed Microdevices 2005, 7:35-40.
22. Zhang H, Buchholz TA, Hancock D, Spitz MR, Wu X: Gamma-radiation-
induced single cell DNA damage as a measure of susceptibility to lung
cancer: a preliminary report. Int J Oncol 2000, 17:399-404.
23. Hofstadler SA, Severs JC, Smith RD, Swanek FD, Ewing AG: Analysis of
single cells with capillary electrophoresis electrospray ionization Fourier
transform ion cyclotron resonance mass spectrometry. Rapid Commun
Mass Spectrom 1996, 10:919-922.
24. Gotz S, Karst U: Recent developments in optical detection methods for
microchip separations. Anal Bioanal Chem 2007, 387:183-192.
25. James CD, Reuel N, Lee ES, Davalos RV, Mani SS, Carroll-Portillo A, Rebeil R,
Martino A, Apblett CA: Impedimetric and optical interrogation of single
cells in a microfluidic device for real-time viability and chemical
response assessment. Biosens Bioelectron 2008, 23:845-851.
26. Vandaveer WRt, Pasas-Farmer SA, Fischer DJ, Frankenfeld CN, Lunte SM:
Recent developments in electrochemical detection for microchip
capillary electrophoresis. Electrophoresis 2004, 25:3528-3549.
27. Di Carlo D, Wu LY, Lee LP: Dynamic single cell culture array. Lab Chip
2006, 6:1445-1449.
28. Betty CA: Porous silicon: a resourceful material for nanotechnology.
Recent Pat Nanotechnol 2008, 2:128-136.
29. Davidsson R, Genin F, Bengtsson M, Laurell T, Emneus J: Microfluidic
biosensing systems. Part I. Development and optimisation of enzymatic
chemiluminescent micro-biosensors based on silicon microchips.
Lab
Chip 2004, 4:481-487.
30. Davidsson R, Johansson B, Passoth V, Bengtsson M, Laurell T, Emneus J:
Microfluidic biosensing systems. Part II. Monitoring the dynamic
production of glucose and ethanol from microchip-immobilised yeast
cells using enzymatic chemiluminescent micro-biosensors. Lab Chip 2004,
4:488-494.
31. Fischer R, Steinert S, Frober U, Voges D, Stubenrauch M, Hofmann GO,
Witte H: Cell cultures in microsystems: biocompatibility aspects.
Biotechnol Bioeng 2011, 108:687-693.
32. Stangegaard M, Petronis S, Jorgensen AM, Christensen CB, Dufva M: A
biocompatible micro cell culture chamber (microCCC) for the culturing
and on-line monitoring of eukaryote cells. Lab Chip 2006, 6:1045-1051.
33. Uhlemann J, Lender M, Freyer R: Biocompatibility of glass and silicon.
Biomed Tech (Berl) 1998, 43(Suppl):438-440.
34. Cho YK, Shin H, Lee SK, Kim T: Current application of micro/nano-
interfaces to stimulate and analyze cellular responses. Ann Biomed Eng
2010, 38:2056-2067.
35. Gomez-Sjöberg R, Leyrat AA, Pirone DM, Chen CS, Quake SR: Versatile, fully
automated, microfluidic cell culture system. Anal Chem 2007,
79:8557-8563.
36. Kawazoe N, Guo L, Wozniak MJ, Imaizumi Y, Tateishi T, Zhang X, Chen G:
Adipogenic differentiation of mesenchymal stem cells on
micropatterned polyelectrolyte surfaces. J Nanosci Nanotechnol 2009,
9:230-239.
37. Lee PJ, Hung PJ, Rao VM, Lee LP: Nanoliter scale microbioreactor array for
quantitative cell biology. Biotechnology and Bioengineering 2005, 94:5-14.
Kohl et al. Nanoscale Research Letters 2011, 6:505
/>Page 13 of 14
38. Prokop A, Prokop Z, Schaffer D, Kozlov E, Wikswo J, Cliffel D,
Baudenbacher F: NanoLiterBioReactor: long-term mammalian cell culture
at nanofabricated scale. Biomed Microdevices 2004, 6:325-339.
39. Simone G, Perozziello G: Ca
2+
mediates the adhesion of breast cancer
cells in self-assembled multifunctional microfluidic chip prepared with
carbohydrate beads. Micro and Nanosystems 2010, 2:261-268.
40. Zhang Z, Perozziello G, Boccazzi P, Sinskey AJ, Geschke O, Jensen KF:
Microbioreactors for bioprocess development. JALA 2007, 12:143-151.
41. Jin GZ, Kim M, Shin US, Kim HW: Effect of carbon nanotube coating of
aligned nanofibrous polymer scaffolds on the neurite outgrowth of PC-
12 cells. Cell Biol Int 2011, 35:741-745, PMID:21332449.
42. Waddell RL, Marra KG, Collins KL, Leung JT, Doctor JS: Using PC12 cells to
evaluate poly(caprolactone) and collagenous microcarriers for
applications in nerve guide fabrication. Biotechnol Prog 2003,
19:1767-1774.
43. Liu D, Yi C, Zhang D, Zhang J, Yang M: Inhibition of proliferation and
differentiation of mesenchymal stem cells by carboxylated carbon
nanotubes. ACS Nano 2010, 4:2185-2195.
44. Oostingh GJ, Casals E, Italiani P, Colognato R, Stritzinger R, Ponti J, Pfaller T,
Kohl Y, Ooms D, Favilli F, Leppens H, Lucchesi D, Rossi F, Nelissen I,
Thielecke H, Puntes VF, Duschl A, Boraschi D: Problems and challenges in
the development and validation of human cell-based assays to
determine nanoparticle-induced immunomodulatory effects. Part Fibre
Toxicol 2011, 8:8.
45. Casals E, Pfaller T, Duschl A, Oostingh GJ, Puntes V: Time evolution of the
nanoparticle protein corona. ACS Nano 2010, 4:3623-3632.
46. Diegoli S, Manciulea AL, Begum S, Jones IP, Lead JR, Preece JA: Interaction
between manufactured gold nanoparticles and naturally occurring
organic macromolecules. Sci Total Environ 2008, 402:51-61.
47. Pan Y, Neuss S, Leifert A, Fischler M, Wen F, Simon U, Schmid G,
Brandau W, Jahnen-Dechent W: Size-dependent cytotoxicity of gold
nanoparticles. Small 2007, 3:1941-1949.
48. Davis RR, Lockwood PE, Hobbs DT, Messer RL, Price RJ, Lewis JB, Wataha JC:
In vitro biological effects of sodium titanate materials. J Biomed Mater
Res B Appl Biomater 2007, 83:505-511.
49. Schulze C, Schaefer UF, Ruge CA, Wohlleben W, Lehr CM: Interaction of
metal oxide nanoparticles with lung surfactant protein A. Eur J Pharm
Biopharm 2010, 77:376-383.
50. Poth A, Jaeger M: Alternative testing - the intelligent way to REACH
compliance. Proc. 6th World Congress on Alternatives & Animal Use in the
Life Sciences 2008, AATEX 14:799-803.
51. Pittenger MF, Mackay AM, Beck SC, Jaiswal RK, Douglas R, Mosca JD,
Moorman MA, Simonetti DW, Craig S, Marshak DR: Multilineage potential
of adult human mesenchymal stem cells. Science 1999, 284:143-147.
52. Frens G: Controlled nucleation for the regulation of the particle size in
monodisperse gold suspensions. Nature Physical Science
1973, 241:20-22.
doi:10.1186/1556-276X-6-505
Cite this article as: Kohl et al.: Biocompatible micro-sized cell culture
chamber for the detection of nanoparticle-induced IL8 promoter
activity on a small cell population. Nanoscale Research Letters 2011 6:505.
Submit your manuscript to a
journal and benefi t from:
7 Convenient online submission
7 Rigorous peer review
7 Immediate publication on acceptance
7 Open access: articles freely available online
7 High visibility within the fi eld
7 Retaining the copyright to your article
Submit your next manuscript at 7 springeropen.com
Kohl et al. Nanoscale Research Letters 2011, 6:505
/>Page 14 of 14