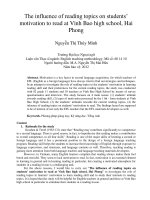
Table 1: The table below gives information on students studying
Bạn đang xem bản rút gọn của tài liệu. Xem và tải ngay bản đầy đủ của tài liệu tại đây (508.6 KB, 4 trang )
Table 1: The table below gives information on students studying in six departments in an Australian
university in 2011.
Table 2:
Multiple charts:
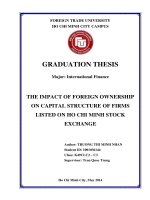
Pie chart
The pie charts below show the average household
expenditures in a country in 1950 and 2010.
The graph shows estimated oil production capacity for several Gulf countries between 1990 and 2010